| Param | Original file | Final file |
|---|---|---|
| Filename | modeM0/AS1T05_158T01_9000005868_43327cztM0_level2.fits | modeM0/AS1T05_158T01_9000005868_43327cztM0_level2_quad_clean.evt |
| Size (bytes) | 306,460,800 | 92,450,880 |
| Size | 292.3 MB | 88.2 MB |
| Events in quadrant A | 3,161,021 | 621,246 |
| Events in quadrant B | 2,639,295 | 640,675 |
| Events in quadrant C | 2,658,961 | 606,483 |
| Events in quadrant D | 2,466,090 | 554,360 |
| Mode M0 | |||
|---|---|---|---|
| Quadrant | BADHDUFLAG | Total packets | Discarded packets |
| A | 0 | 12676 | 2 |
| B | 0 | 11566 | 3 |
| C | 0 | 11186 | 2 |
| D | 0 | 11324 | 2 |
| Mode M9 | |||
|---|---|---|---|
| Quadrant | BADHDUFLAG | Total packets | Discarded packets |
| A | 0 | 30 | 0 |
| B | 0 | 31 | 0 |
| C | 0 | 31 | 0 |
| D | 0 | 31 | 0 |
| Mode SS | |||
|---|---|---|---|
| Quadrant | BADHDUFLAG | Total packets | Discarded packets |
| A | 0 | 112 | 0 |
| B | 0 | 112 | 0 |
| C | 0 | 112 | 0 |
| D | 0 | 112 | 0 |
| Quadrant | Total seconds | Saturated seconds | Saturation percentage |
|---|---|---|---|
| A | 5372 | 83 | 1.545048% |
| B | 5371 | 82 | 1.526718% |
| C | 5371 | 11 | 0.204804% |
| D | 5371 | 32 | 0.595792% |
Noise dominated data is calculated using 1-second bins in cleaned event files. If a bin has >2000 counts, and if more than 50% of those come from <1% of pixels, then it is considered to be noise-dominated and hence unusable.
| Quadrant | # 1 sec bins | Bins with >0 counts | Bins with >2000 counts | High rate bins dominated by noise | Noise dominated (total time) | Noise dominated (detector-on time) | Marked lightcurve |
|---|---|---|---|---|---|---|---|
| A | 7254 | 5373 | 63 | 63 | 0.87% | 1.17% | 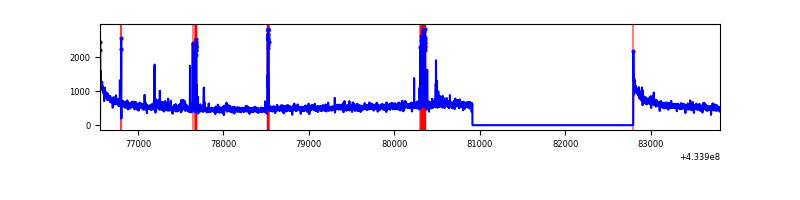 |
| B | 7253 | 5372 | 37 | 37 | 0.51% | 0.69% | 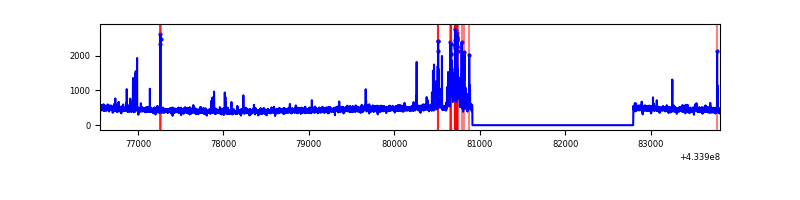 |
| C | 7253 | 5372 | 9 | 9 | 0.12% | 0.17% | 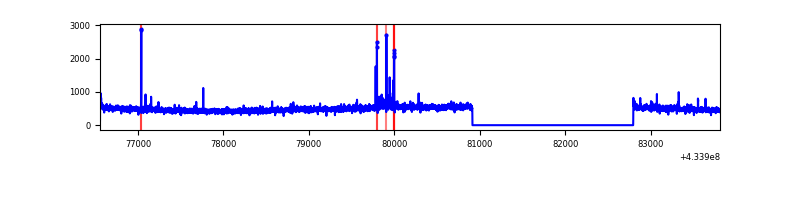 |
| D | 7253 | 5372 | 25 | 25 | 0.34% | 0.47% | 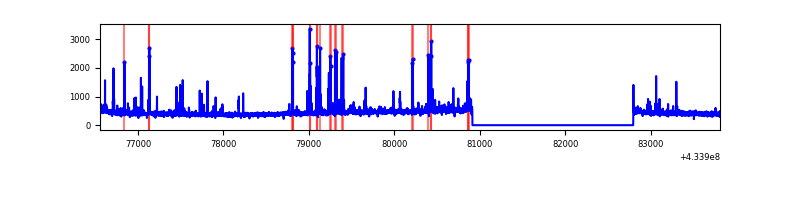 |
Top three noisy pixels from each quadrant. If the there are fewer than three noisy pixels in the level2.evt file, extra rows are filled as -1
| Pixel properties | Quadrant properties | ||||||
|---|---|---|---|---|---|---|---|
| Quadrant | DetID | PixID | Counts | Sigma | Mean | Median | Sigma |
| A | 10 | 83 | 560261 | 4528.13 | 600 | 589 | 123.6 |
| A | 15 | 237 | 198685 | 1602.73 | 600 | 589 | 123.6 |
| A | 12 | 189 | 66066 | 529.75 | 600 | 589 | 123.6 |
| B | 5 | 172 | 268303 | 2300.45 | 600 | 583 | 116.4 |
| B | 12 | 111 | 14574 | 120.22 | 600 | 583 | 116.4 |
| B | 11 | 111 | 13527 | 111.22 | 600 | 583 | 116.4 |
| C | 15 | 214 | 224257 | 1594.81 | 596 | 599 | 140.2 |
| C | 3 | 233 | 77273 | 546.73 | 596 | 599 | 140.2 |
| C | 0 | 207 | 17762 | 122.38 | 596 | 599 | 140.2 |
| D | 12 | 6 | 79091 | 543.78 | 587 | 571 | 144.4 |
| D | 2 | 249 | 63068 | 432.82 | 587 | 571 | 144.4 |
| D | 13 | 249 | 45835 | 313.47 | 587 | 571 | 144.4 |
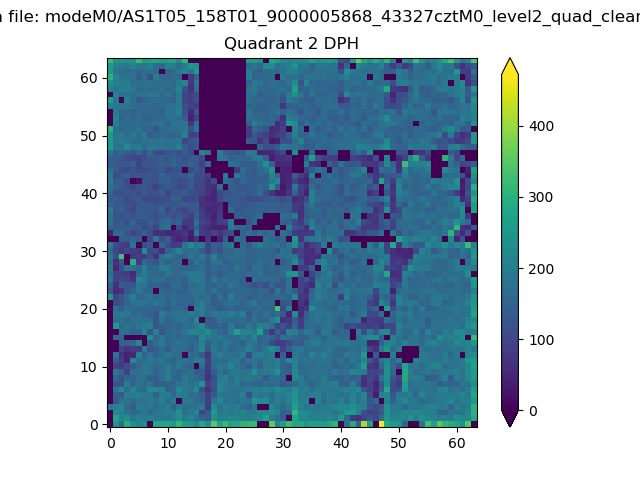
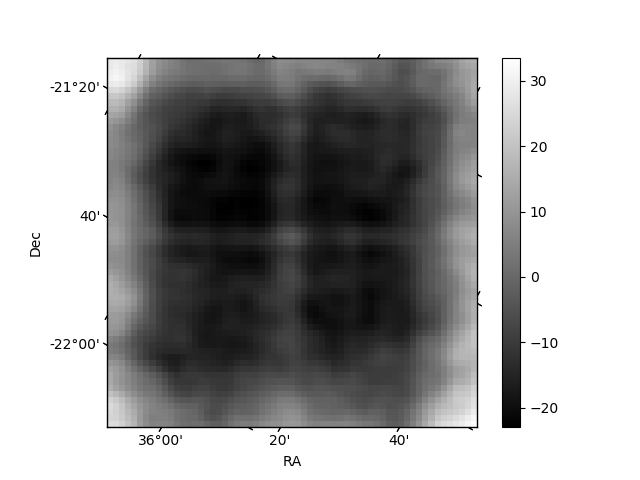
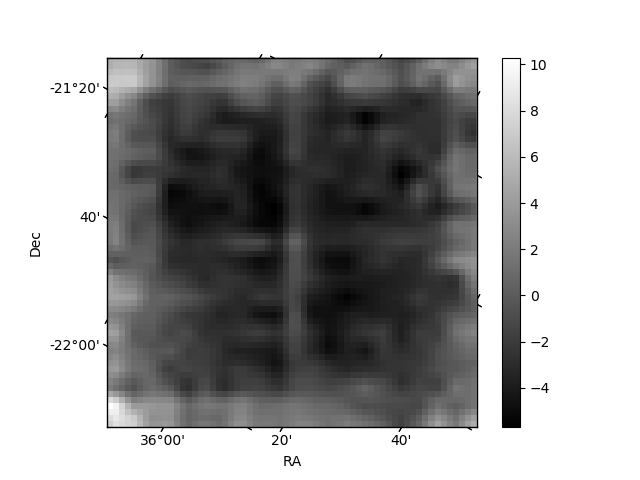
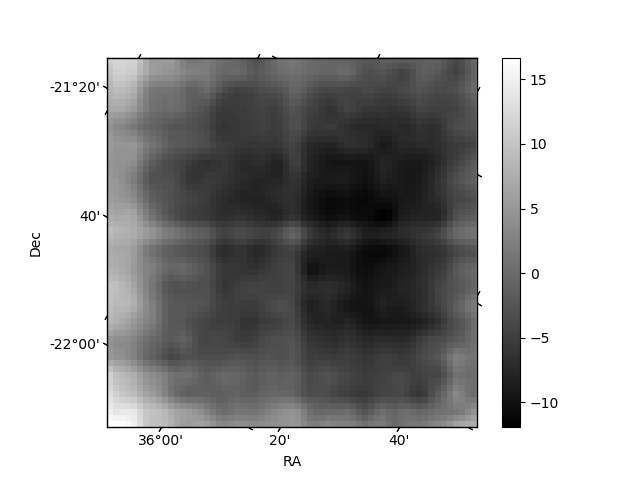
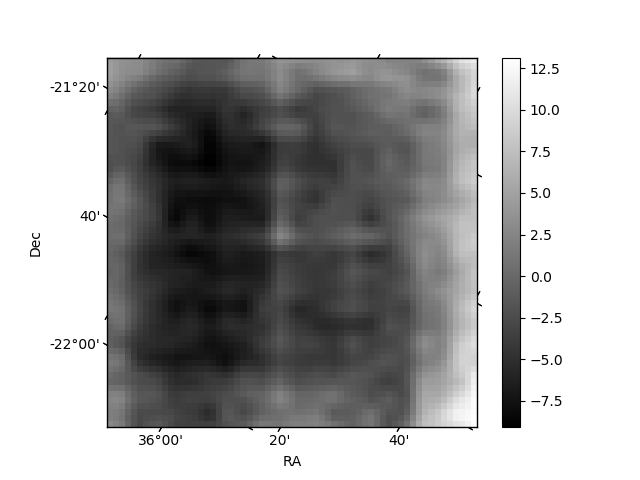
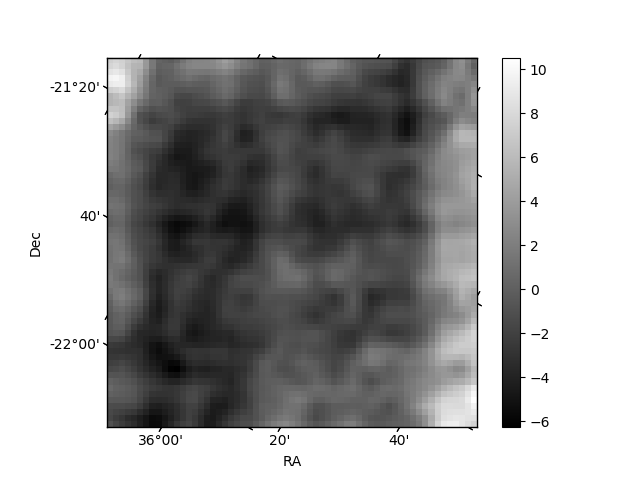
Histogram calculated using DETX and DETY for each event in the final _common_clean file
| Quadrant A | 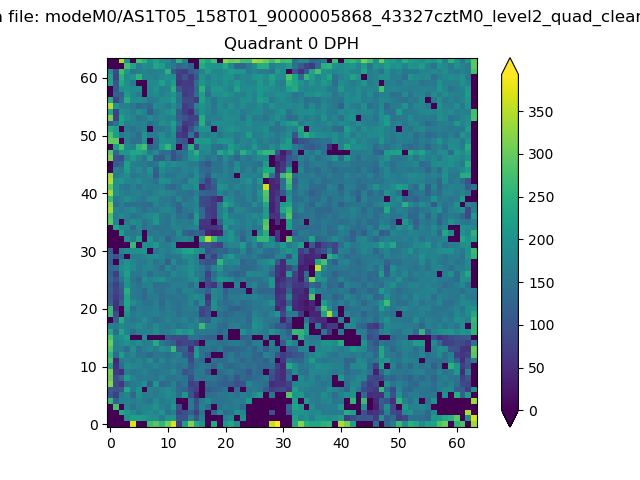 |
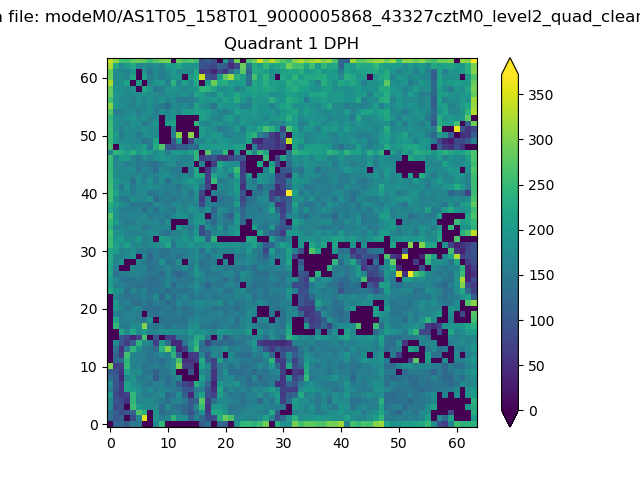 |
Quadrant B |
|---|---|---|---|
| Quadrant D | 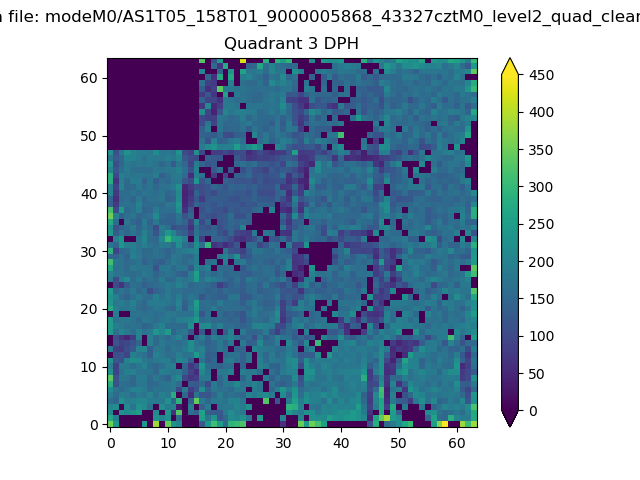 |
 |
Quadrant C |
| Plot type | Count rate plots | Images |
|---|---|---|
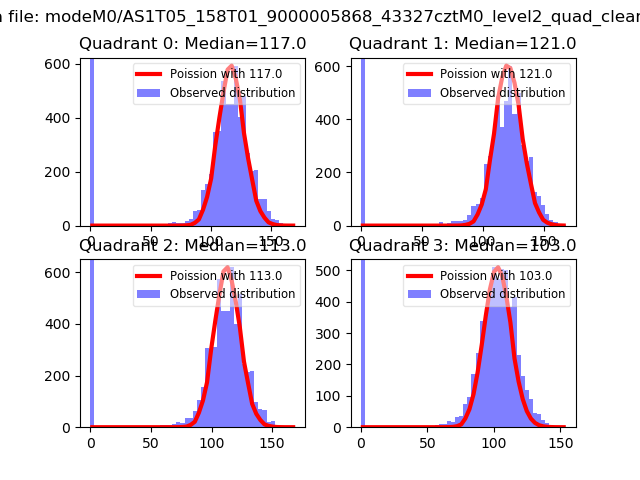
| Comparison with Poisson distribution Blue bars denote a histogram of data divided into 1 sec bins. Red curve is a Poisson curve with rate = median count rate of data. |
 |
 |
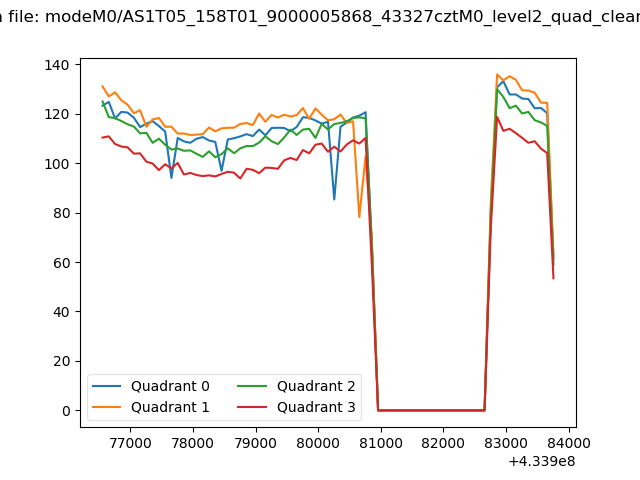
| Quadrant-wise count rates Data is divided into 100 sec bins |
 |
|
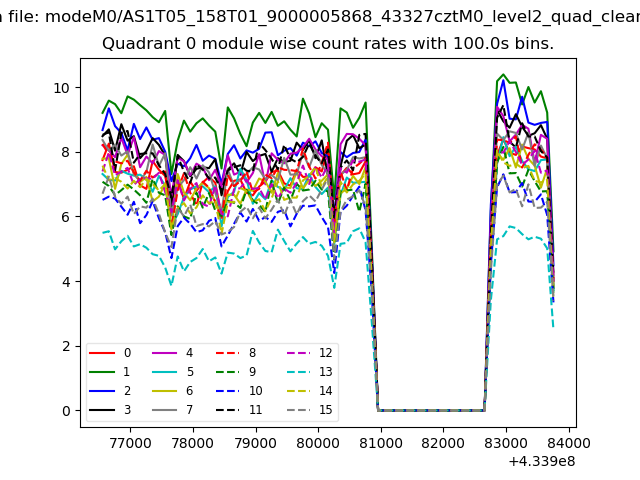
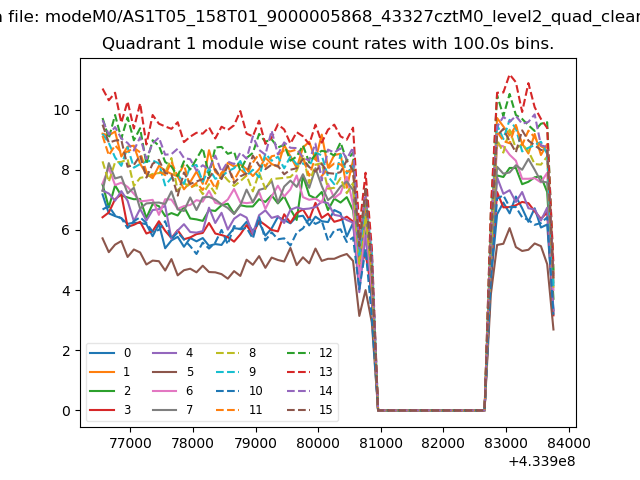
| Module-wise count rates for Quadrant A Data is divided into 100 sec bins |
 |
 |
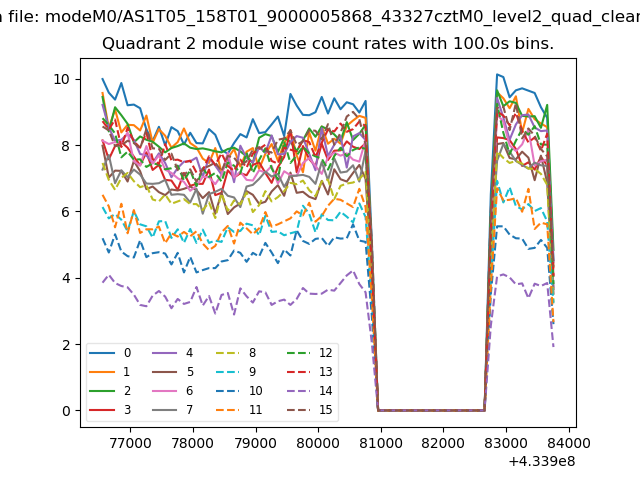
| Module-wise count rates for Quadrant B Data is divided into 100 sec bins |
 |
 |
| Module-wise count rates for Quadrant C Data is divided into 100 sec bins |
 |
 |
| Module-wise count rates for Quadrant D Data is divided into 100 sec bins |
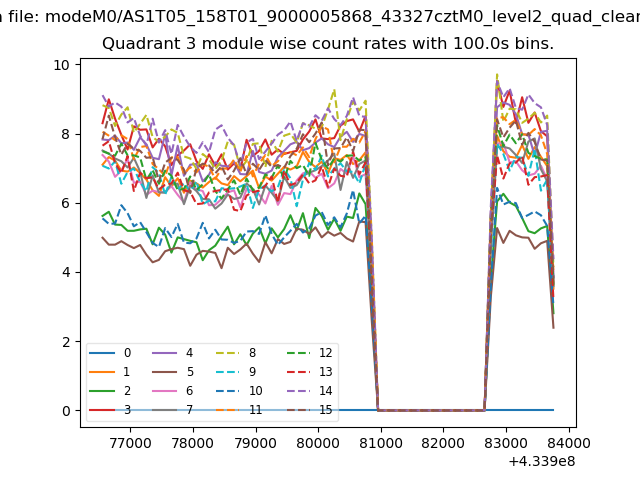 |
 |
| Parameter | Plot |
|---|---|
| CZT HV Monitor | 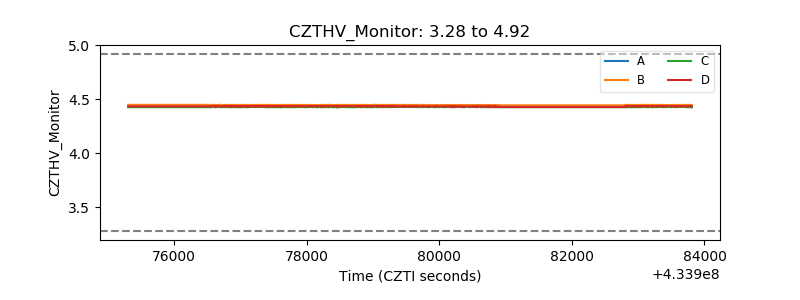 |
| D_VDD | 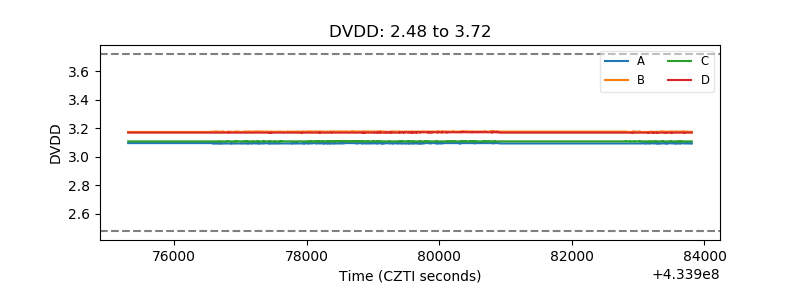 |
| Temperature 1 | 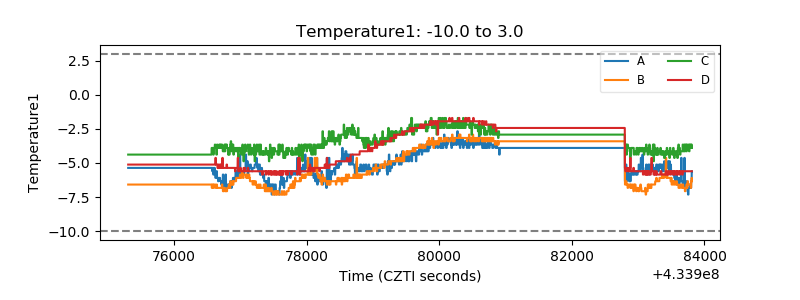 |
| Veto HV Monitor | 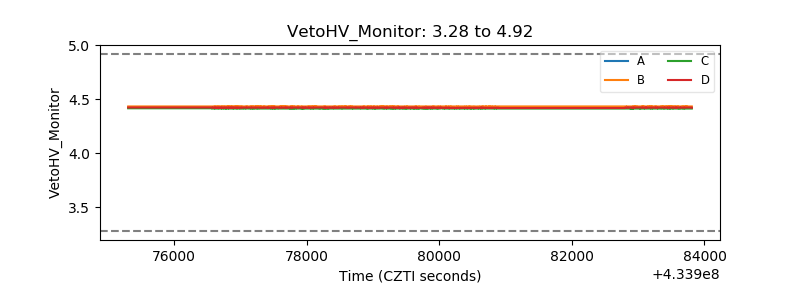 |
| Veto LLD | 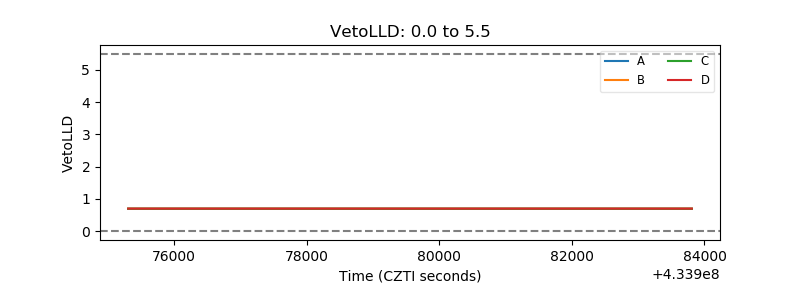 |
| Alpha Counter | 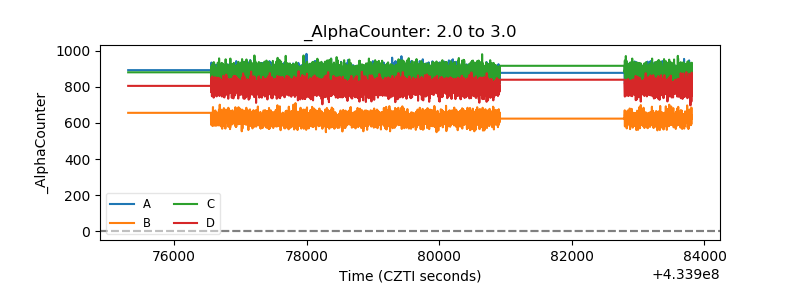 |
| _CPM_Rate | 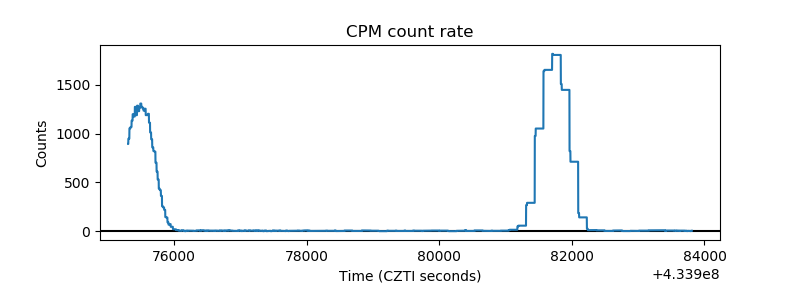 |
| CZT Counter | 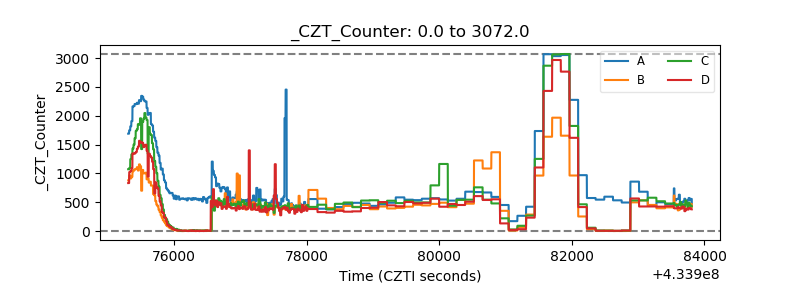 |
| +2.5 Volts monitor |  |
| +5 Volts monitor | 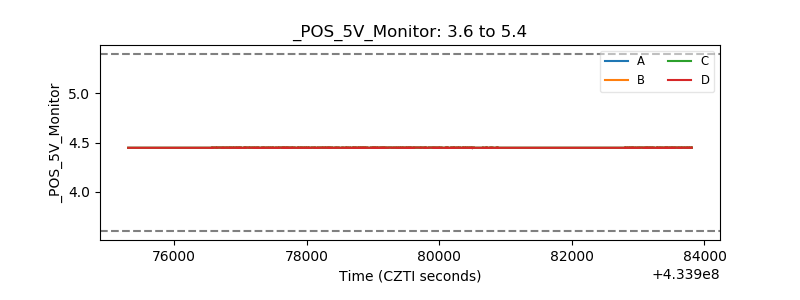 |
| _ROLL_ROT | 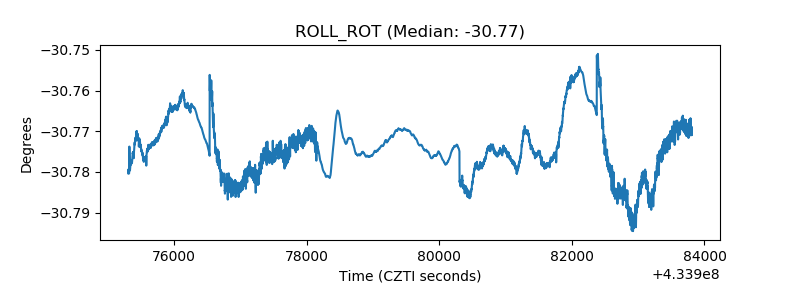 |
| _Roll_DEC | 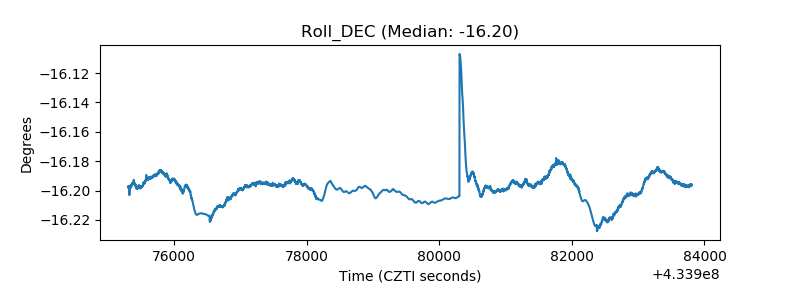 |
| _Roll_RA | 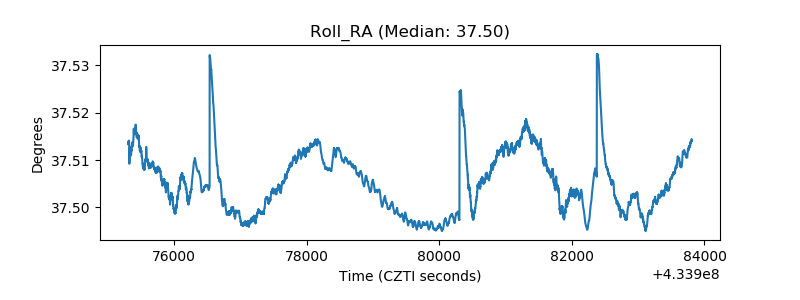 |
| Veto Counter | 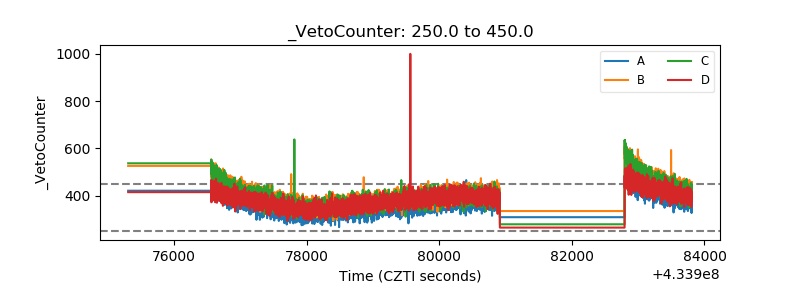 |