| Param | Original file | Final file |
|---|---|---|
| Filename | modeM0/AS1T05_158T01_9000005868_43328cztM0_level2.fits | modeM0/AS1T05_158T01_9000005868_43328cztM0_level2_quad_clean.evt |
| Size (bytes) | 300,110,400 | 94,343,040 |
| Size | 286.2 MB | 90.0 MB |
| Events in quadrant A | 3,051,033 | 639,841 |
| Events in quadrant B | 2,478,503 | 659,687 |
| Events in quadrant C | 2,656,937 | 619,615 |
| Events in quadrant D | 2,510,179 | 566,773 |
| Mode M0 | |||
|---|---|---|---|
| Quadrant | BADHDUFLAG | Total packets | Discarded packets |
| A | 0 | 12192 | 2 |
| B | 0 | 10780 | 2 |
| C | 0 | 10920 | 2 |
| D | 0 | 11178 | 2 |
| Mode M9 | |||
|---|---|---|---|
| Quadrant | BADHDUFLAG | Total packets | Discarded packets |
| A | 0 | 38 | 0 |
| B | 0 | 38 | 0 |
| C | 0 | 38 | 0 |
| D | 0 | 38 | 0 |
| Mode SS | |||
|---|---|---|---|
| Quadrant | BADHDUFLAG | Total packets | Discarded packets |
| A | 0 | 112 | 0 |
| B | 0 | 112 | 0 |
| C | 0 | 112 | 0 |
| D | 0 | 112 | 0 |
| Quadrant | Total seconds | Saturated seconds | Saturation percentage |
|---|---|---|---|
| A | 5291 | 18 | 0.340200% |
| B | 5291 | 18 | 0.340200% |
| C | 5291 | 5 | 0.094500% |
| D | 5291 | 25 | 0.472500% |
Noise dominated data is calculated using 1-second bins in cleaned event files. If a bin has >2000 counts, and if more than 50% of those come from <1% of pixels, then it is considered to be noise-dominated and hence unusable.
| Quadrant | # 1 sec bins | Bins with >0 counts | Bins with >2000 counts | High rate bins dominated by noise | Noise dominated (total time) | Noise dominated (detector-on time) | Marked lightcurve |
|---|---|---|---|---|---|---|---|
| A | 9174 | 5293 | 11 | 11 | 0.12% | 0.21% | 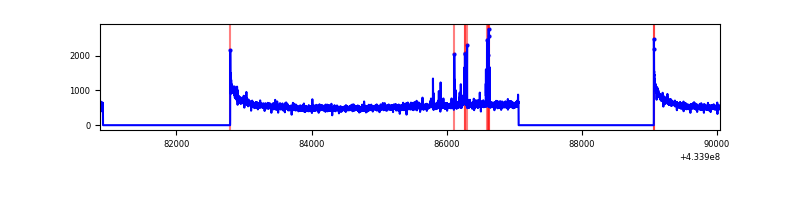 |
| B | 9174 | 5293 | 9 | 9 | 0.10% | 0.17% | 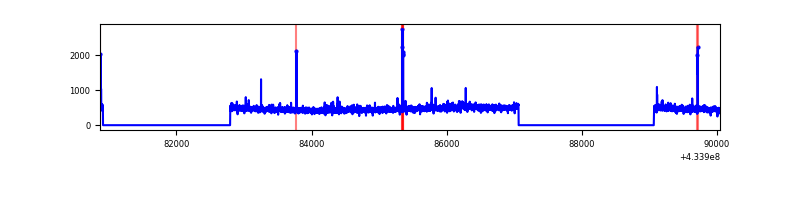 |
| C | 9174 | 5293 | 6 | 6 | 0.07% | 0.11% | 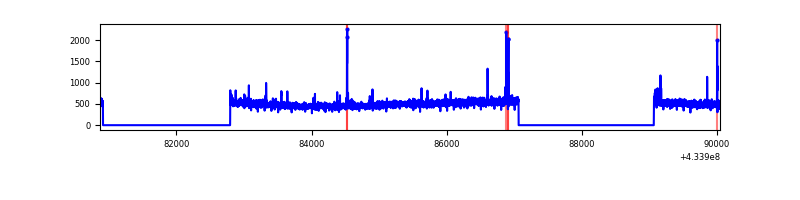 |
| D | 9174 | 5293 | 13 | 13 | 0.14% | 0.25% | 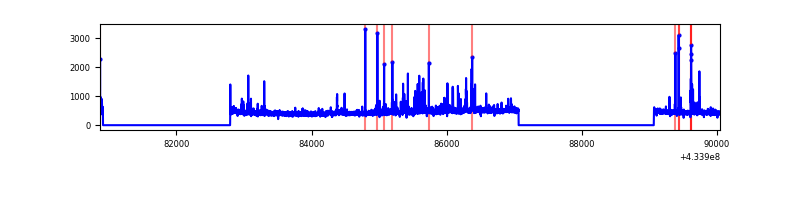 |
Top three noisy pixels from each quadrant. If the there are fewer than three noisy pixels in the level2.evt file, extra rows are filled as -1
| Pixel properties | Quadrant properties | ||||||
|---|---|---|---|---|---|---|---|
| Quadrant | DetID | PixID | Counts | Sigma | Mean | Median | Sigma |
| A | 10 | 83 | 565670 | 4512.35 | 613 | 601 | 125.2 |
| A | 15 | 237 | 83259 | 660.06 | 613 | 601 | 125.2 |
| A | 13 | 6 | 15078 | 115.61 | 613 | 601 | 125.2 |
| B | 5 | 172 | 42942 | 362.82 | 608 | 592 | 116.7 |
| B | 0 | 245 | 25164 | 210.51 | 608 | 592 | 116.7 |
| B | 0 | 189 | 24109 | 201.48 | 608 | 592 | 116.7 |
| C | 15 | 214 | 220824 | 1560.49 | 603 | 608 | 141.1 |
| C | 3 | 233 | 29843 | 207.16 | 603 | 608 | 141.1 |
| C | 2 | 16 | 24107 | 166.52 | 603 | 608 | 141.1 |
| D | 2 | 249 | 58853 | 396.7 | 597 | 581 | 146.9 |
| D | 1 | 52 | 52669 | 354.6 | 597 | 581 | 146.9 |
| D | 13 | 249 | 39714 | 266.41 | 597 | 581 | 146.9 |
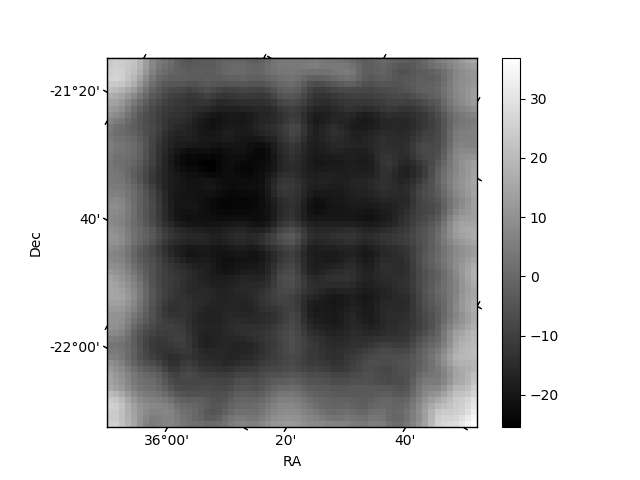
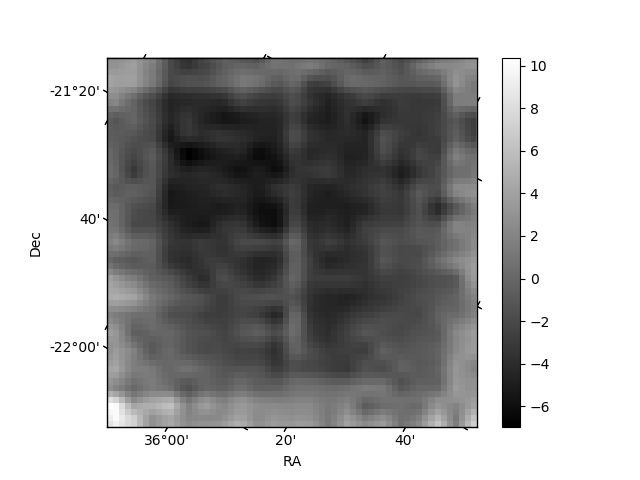
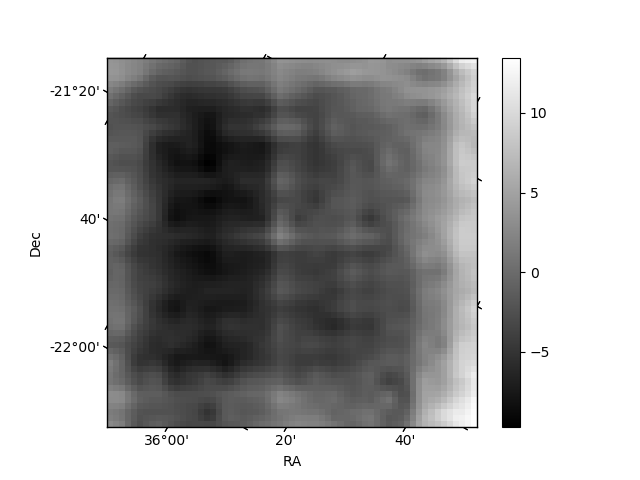
Histogram calculated using DETX and DETY for each event in the final _common_clean file
| Quadrant A | 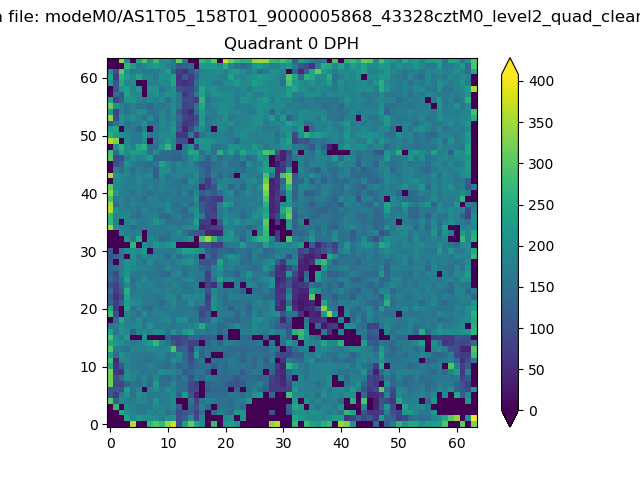 |
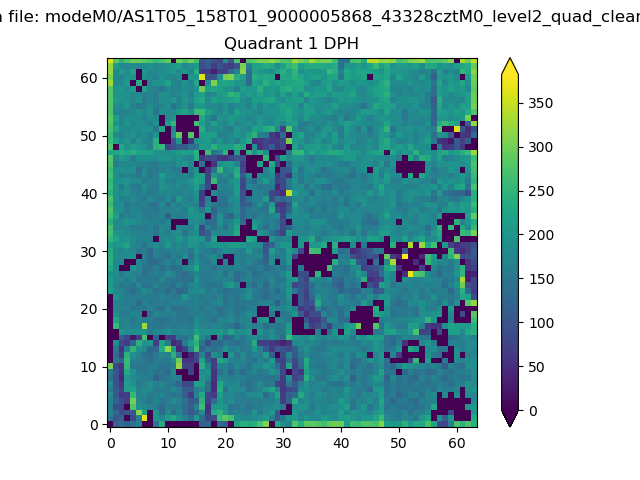 |
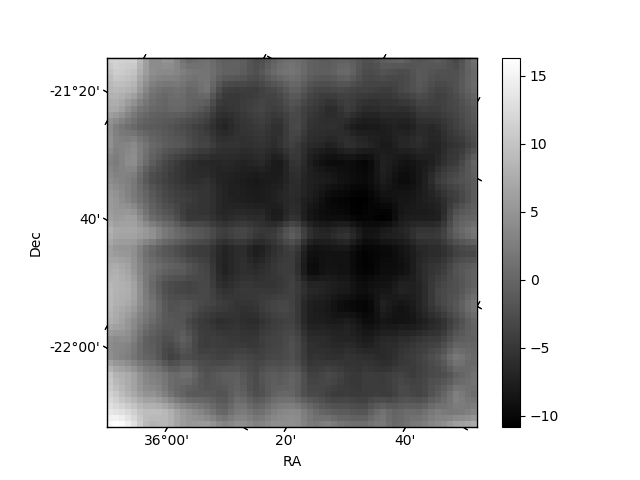
Quadrant B |
|---|---|---|---|
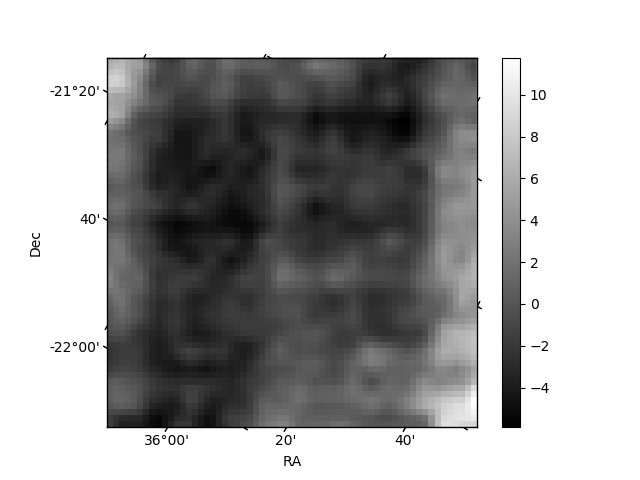
| Quadrant D | 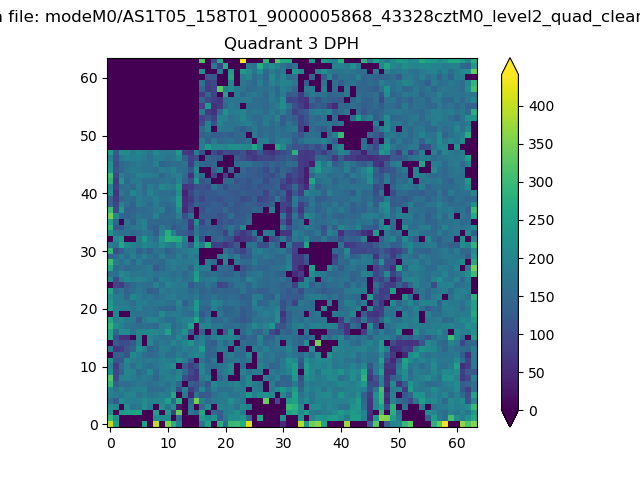 |
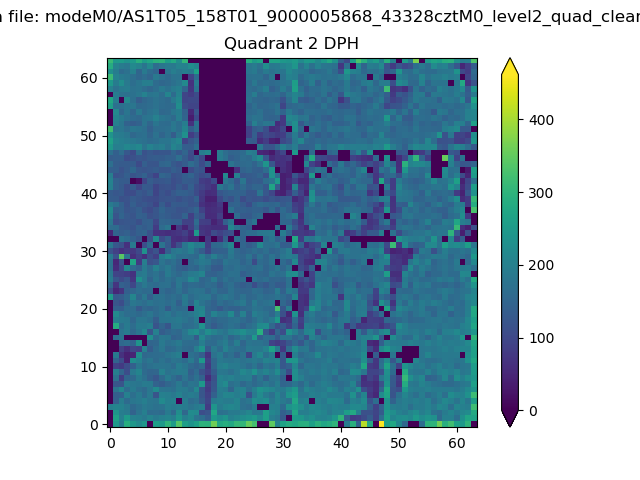 |
Quadrant C |
| Plot type | Count rate plots | Images |
|---|---|---|
| Comparison with Poisson distribution Blue bars denote a histogram of data divided into 1 sec bins. Red curve is a Poisson curve with rate = median count rate of data. |
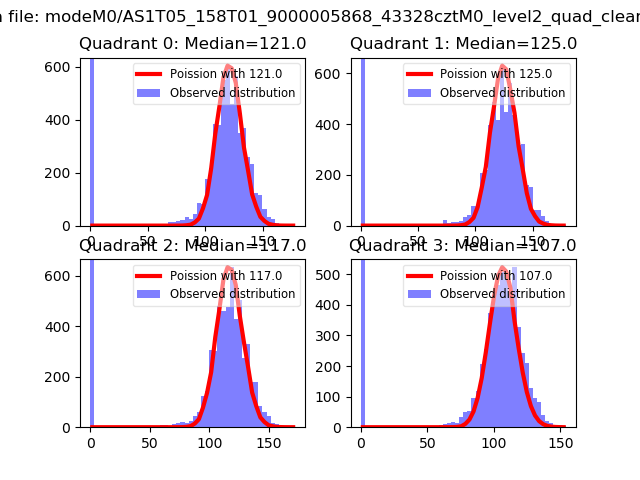 |
 |
| Quadrant-wise count rates Data is divided into 100 sec bins |
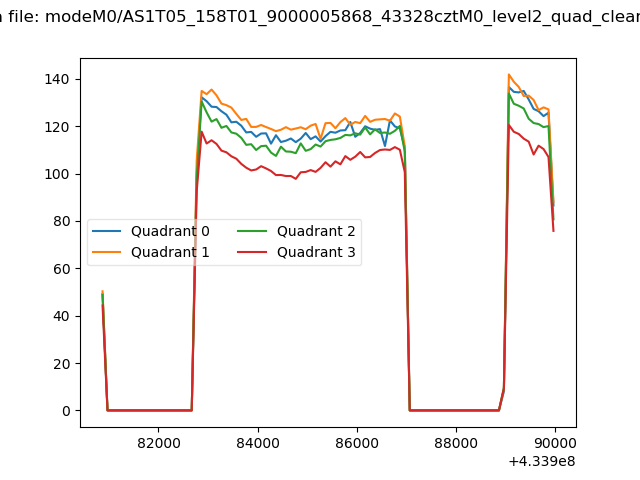 |
|
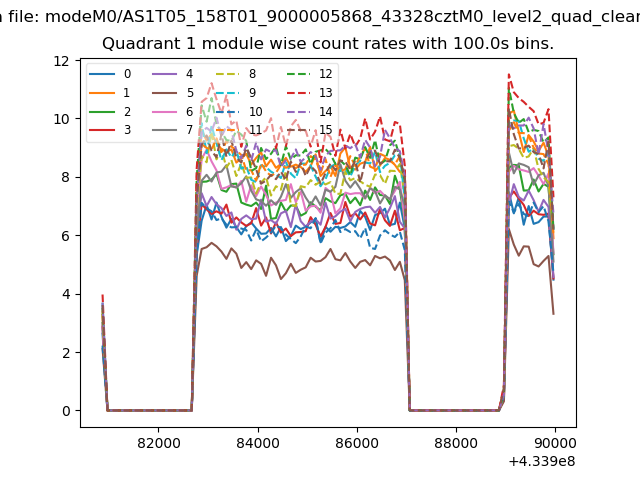
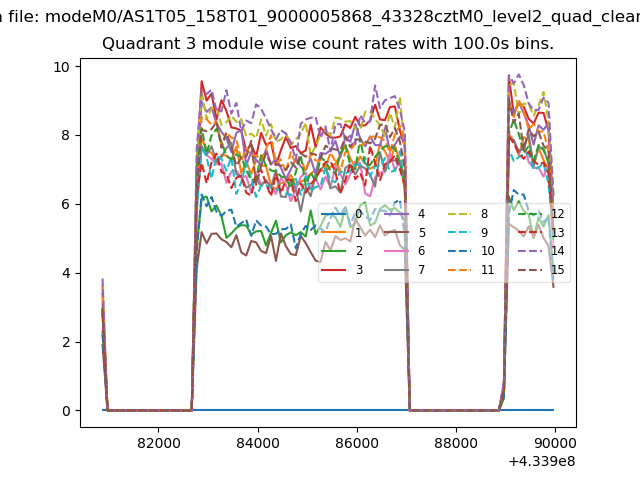
| Module-wise count rates for Quadrant A Data is divided into 100 sec bins |
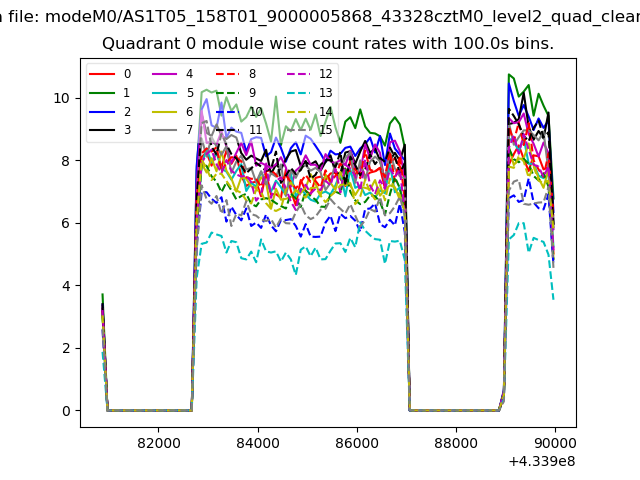 |
 |
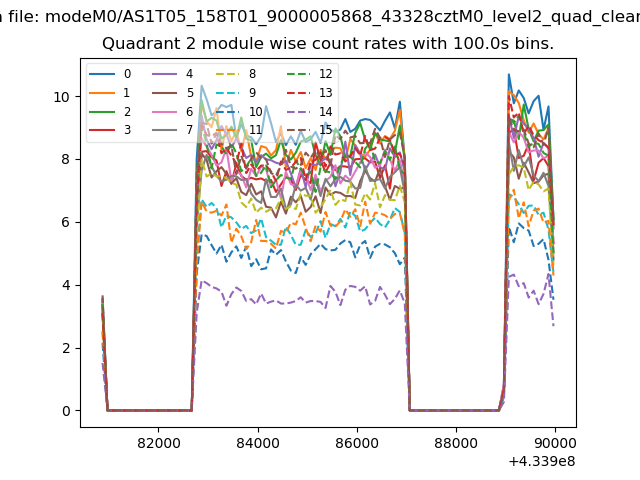
| Module-wise count rates for Quadrant B Data is divided into 100 sec bins |
 |
 |
| Module-wise count rates for Quadrant C Data is divided into 100 sec bins |
 |
 |
| Module-wise count rates for Quadrant D Data is divided into 100 sec bins |
 |
 |
| Parameter | Plot |
|---|---|
| CZT HV Monitor | 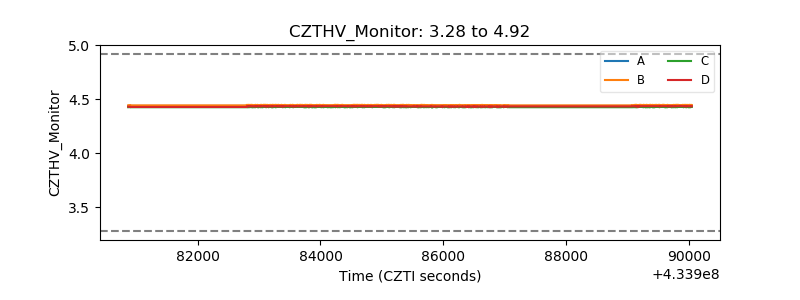 |
| D_VDD | 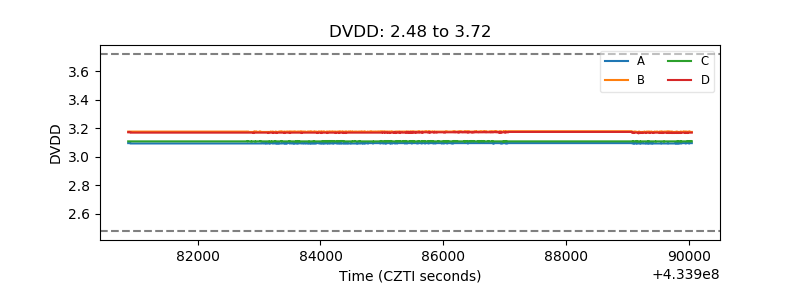 |
| Temperature 1 | 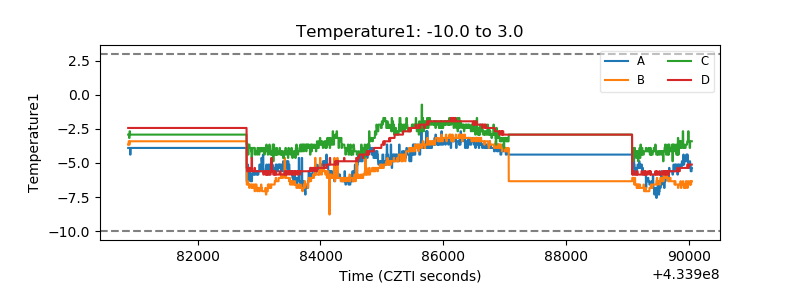 |
| Veto HV Monitor | 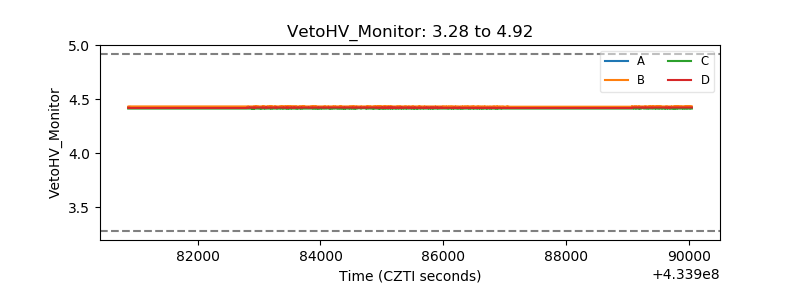 |
| Veto LLD | 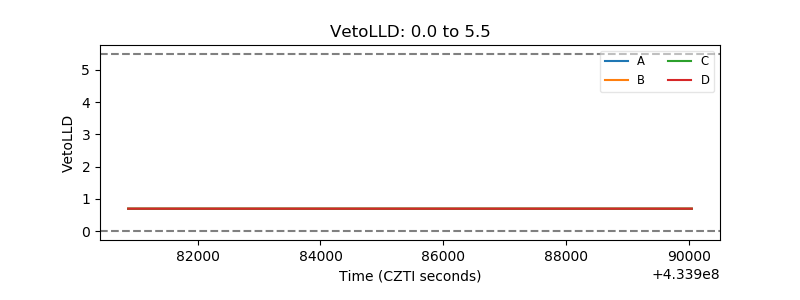 |
| Alpha Counter | 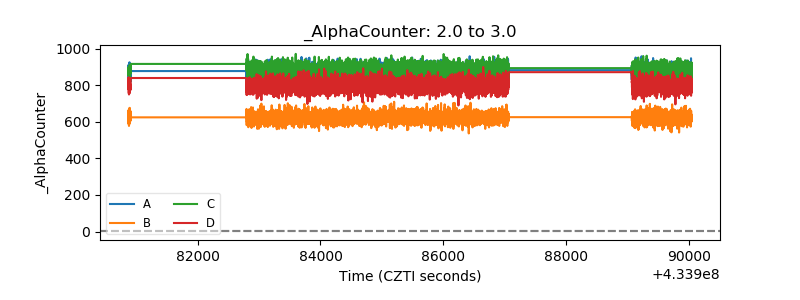 |
| _CPM_Rate | 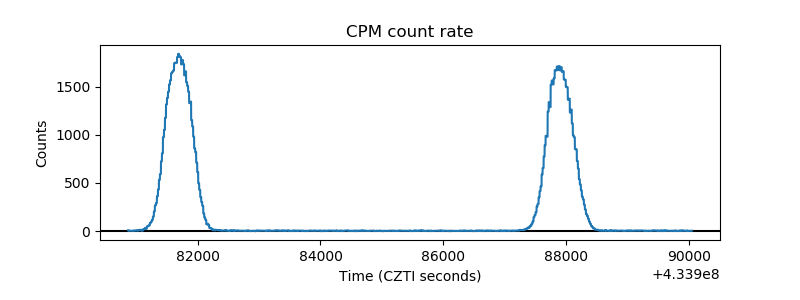 |
| CZT Counter | 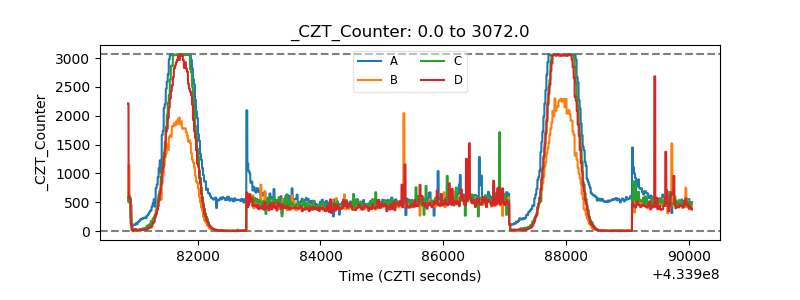 |
| +2.5 Volts monitor | 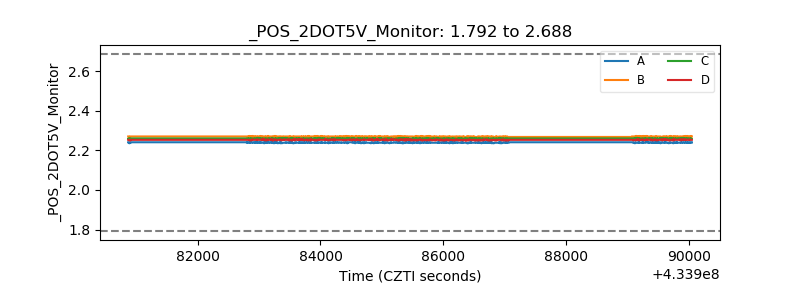 |
| +5 Volts monitor | 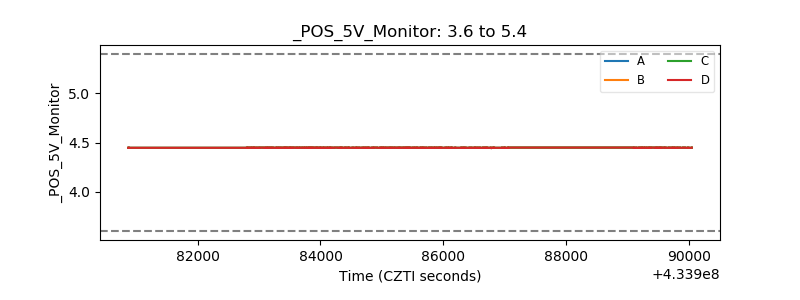 |
| _ROLL_ROT | 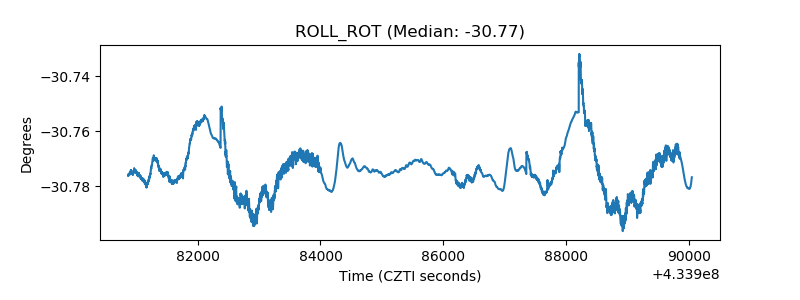 |
| _Roll_DEC | 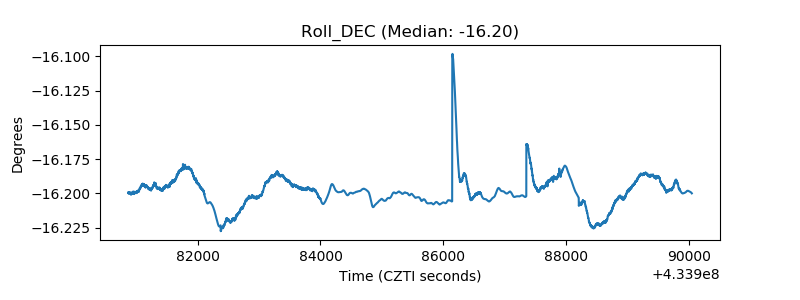 |
| _Roll_RA | 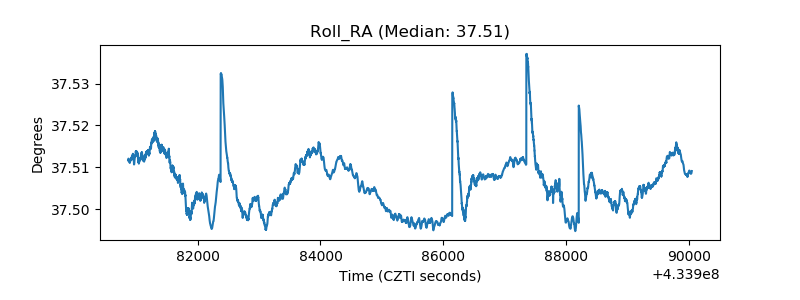 |
| Veto Counter | 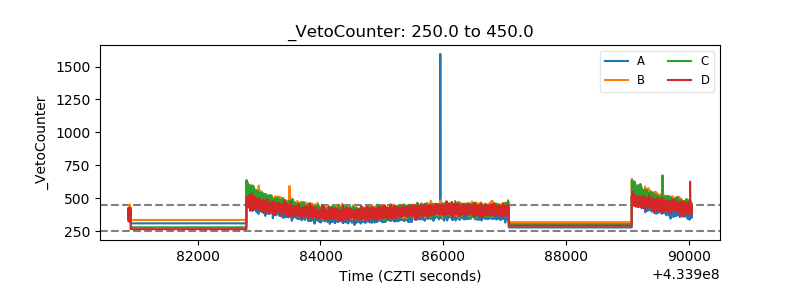 |