| Param | Original file | Final file |
|---|---|---|
| Filename | modeM0/AS1T05_158T01_9000005868_43330cztM0_level2.fits | modeM0/AS1T05_158T01_9000005868_43330cztM0_level2_quad_clean.evt |
| Size (bytes) | 289,520,640 | 86,040,000 |
| Size | 276.1 MB | 82.1 MB |
| Events in quadrant A | 2,935,862 | 577,255 |
| Events in quadrant B | 2,296,274 | 599,323 |
| Events in quadrant C | 2,422,437 | 570,150 |
| Events in quadrant D | 2,681,540 | 515,975 |
| Mode M0 | |||
|---|---|---|---|
| Quadrant | BADHDUFLAG | Total packets | Discarded packets |
| A | 0 | 11526 | 2 |
| B | 0 | 9901 | 2 |
| C | 0 | 9892 | 5 |
| D | 0 | 11338 | 2 |
| Mode M9 | |||
|---|---|---|---|
| Quadrant | BADHDUFLAG | Total packets | Discarded packets |
| A | 0 | 40 | 0 |
| B | 0 | 41 | 0 |
| C | 0 | 41 | 0 |
| D | 0 | 41 | 0 |
| Mode SS | |||
|---|---|---|---|
| Quadrant | BADHDUFLAG | Total packets | Discarded packets |
| A | 0 | 100 | 0 |
| B | 0 | 100 | 0 |
| C | 0 | 100 | 0 |
| D | 0 | 100 | 0 |
| Quadrant | Total seconds | Saturated seconds | Saturation percentage |
|---|---|---|---|
| A | 4885 | 63 | 1.289662% |
| B | 4885 | 8 | 0.163767% |
| C | 4883 | 3 | 0.061438% |
| D | 4885 | 94 | 1.924258% |
Noise dominated data is calculated using 1-second bins in cleaned event files. If a bin has >2000 counts, and if more than 50% of those come from <1% of pixels, then it is considered to be noise-dominated and hence unusable.
| Quadrant | # 1 sec bins | Bins with >0 counts | Bins with >2000 counts | High rate bins dominated by noise | Noise dominated (total time) | Noise dominated (detector-on time) | Marked lightcurve |
|---|---|---|---|---|---|---|---|
| A | 7037 | 4886 | 48 | 48 | 0.68% | 0.98% | 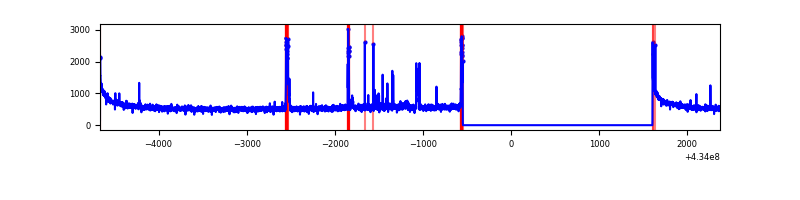 |
| B | 7037 | 4886 | 2 | 2 | 0.03% | 0.04% | 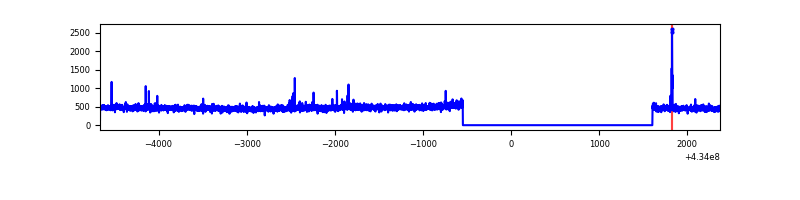 |
| C | 7037 | 4885 | 0 | 0 | 0.00% | 0.00% | 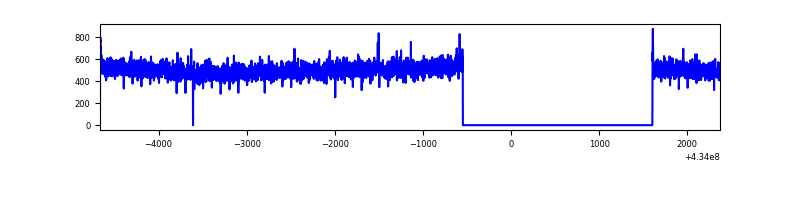 |
| D | 7037 | 4886 | 85 | 85 | 1.21% | 1.74% | 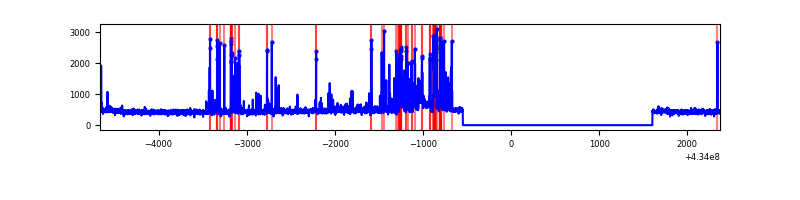 |
Top three noisy pixels from each quadrant. If the there are fewer than three noisy pixels in the level2.evt file, extra rows are filled as -1
| Pixel properties | Quadrant properties | ||||||
|---|---|---|---|---|---|---|---|
| Quadrant | DetID | PixID | Counts | Sigma | Mean | Median | Sigma |
| A | 10 | 83 | 532235 | 4508.71 | 571 | 560 | 117.9 |
| A | 15 | 237 | 194585 | 1645.37 | 571 | 560 | 117.9 |
| A | 13 | 6 | 7004 | 54.65 | 571 | 560 | 117.9 |
| B | 5 | 172 | 29954 | 269.13 | 565 | 549 | 109.3 |
| B | 0 | 189 | 17927 | 159.05 | 565 | 549 | 109.3 |
| B | 0 | 230 | 17232 | 152.69 | 565 | 549 | 109.3 |
| C | 15 | 214 | 206493 | 1562.49 | 562 | 565 | 131.8 |
| C | 3 | 233 | 14800 | 108.01 | 562 | 565 | 131.8 |
| C | 2 | 16 | 7201 | 50.35 | 562 | 565 | 131.8 |
| D | 13 | 249 | 398786 | 2905.27 | 556 | 541 | 137.1 |
| D | 12 | 6 | 74445 | 539.14 | 556 | 541 | 137.1 |
| D | 2 | 249 | 48342 | 348.72 | 556 | 541 | 137.1 |
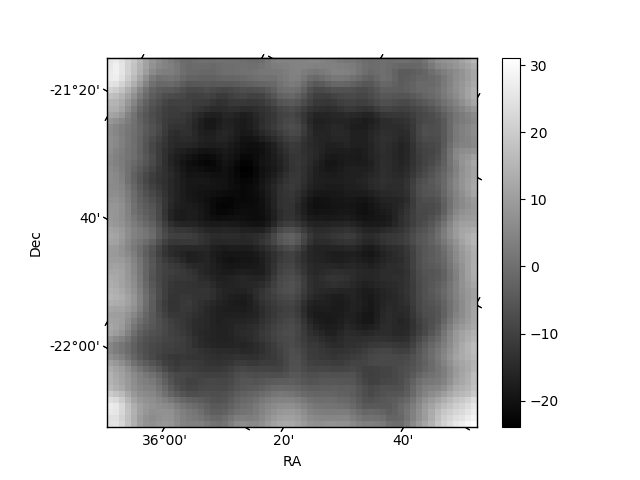
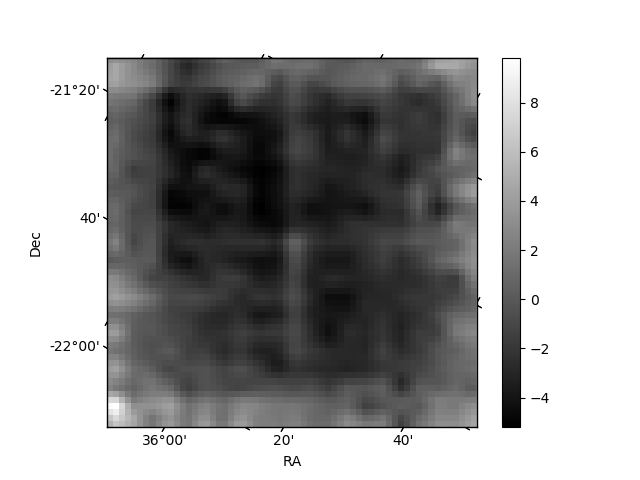
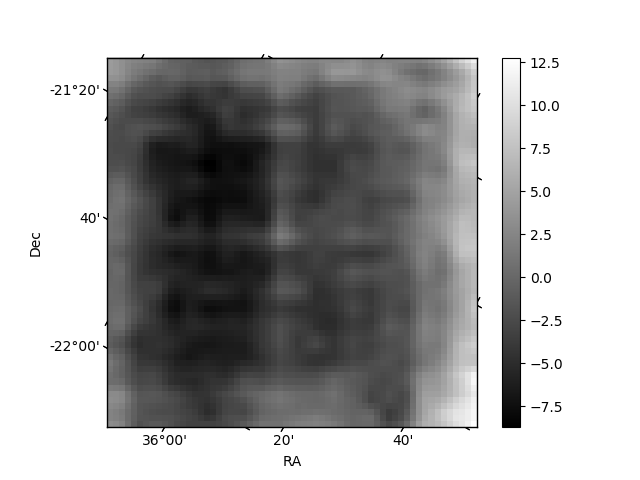
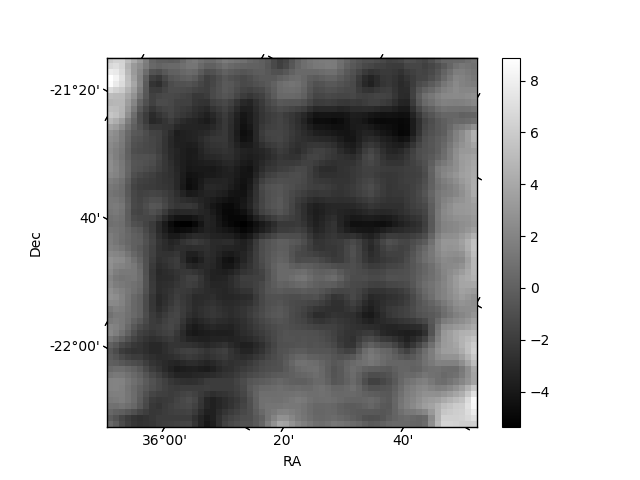
Histogram calculated using DETX and DETY for each event in the final _common_clean file
| Quadrant A | 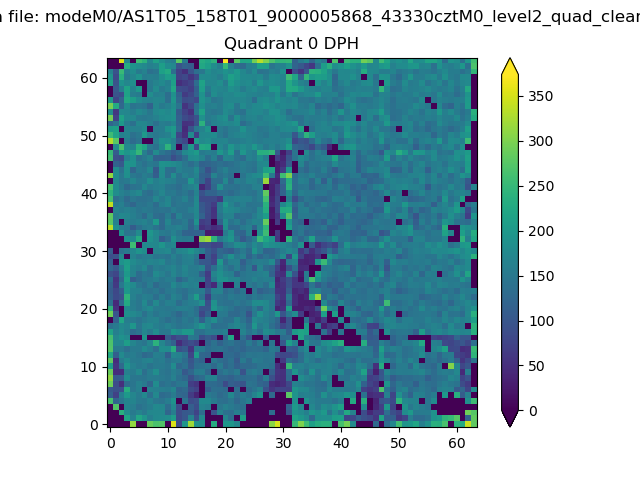 |
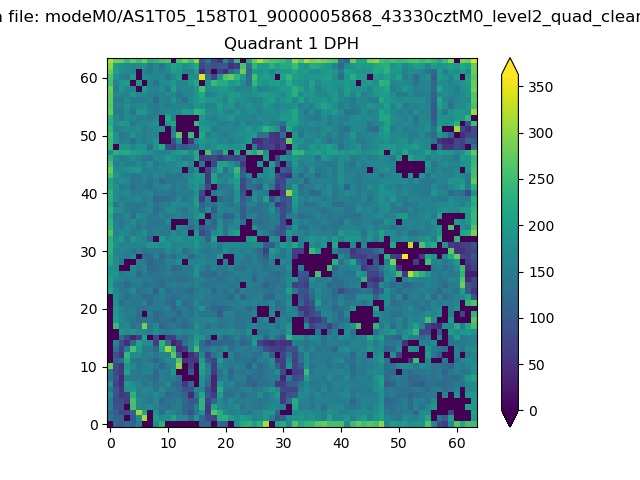 |
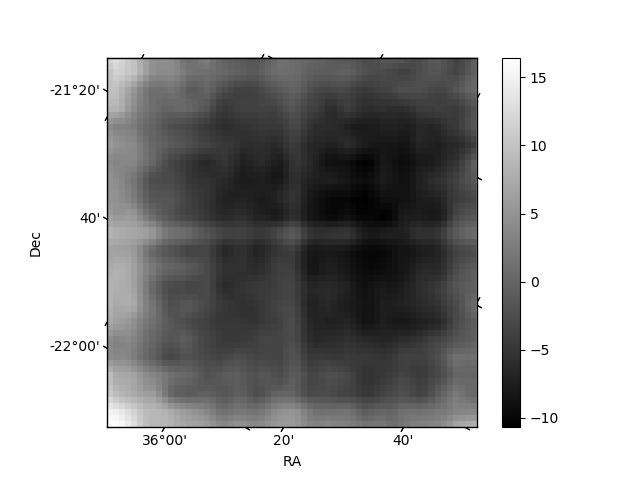
Quadrant B |
|---|---|---|---|
| Quadrant D | 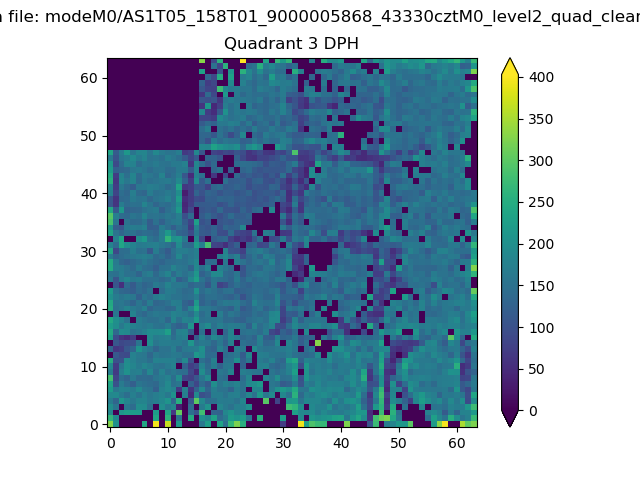 |
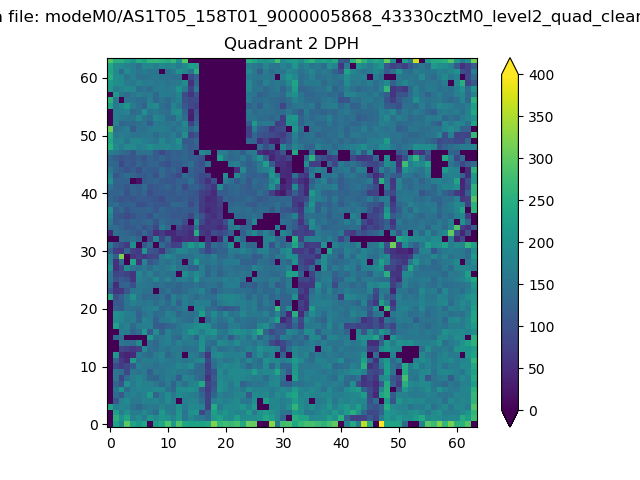 |
Quadrant C |
| Plot type | Count rate plots | Images |
|---|---|---|
| Comparison with Poisson distribution Blue bars denote a histogram of data divided into 1 sec bins. Red curve is a Poisson curve with rate = median count rate of data. |
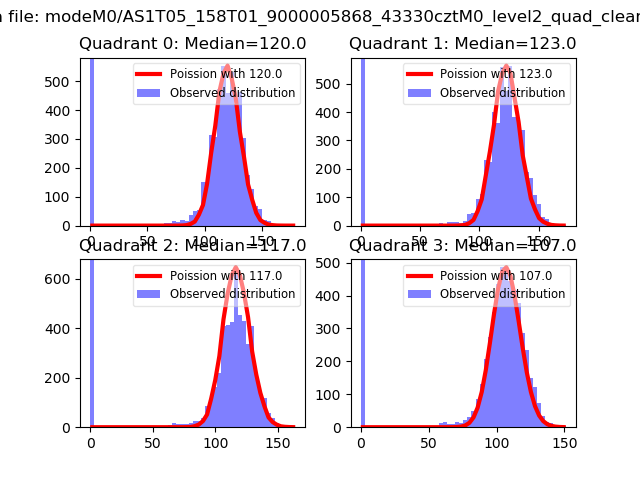 |
 |
| Quadrant-wise count rates Data is divided into 100 sec bins |
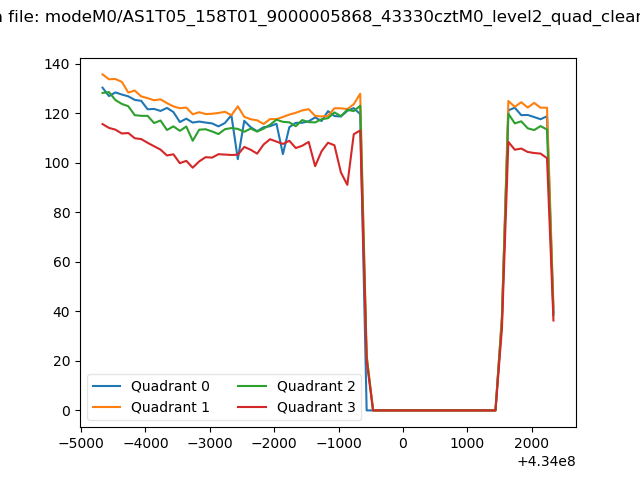 |
|
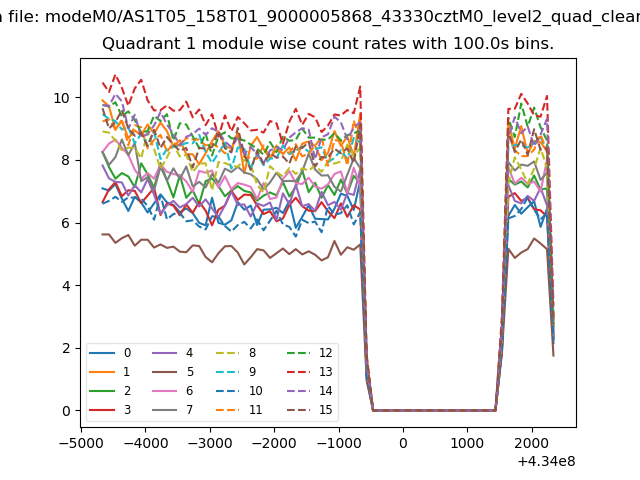
| Module-wise count rates for Quadrant A Data is divided into 100 sec bins |
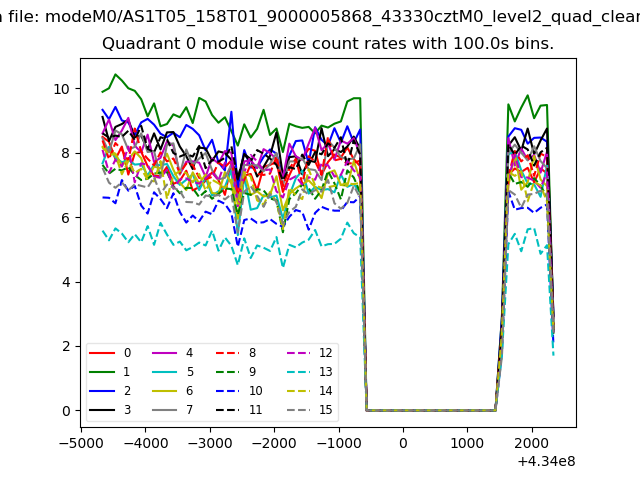 |
 |
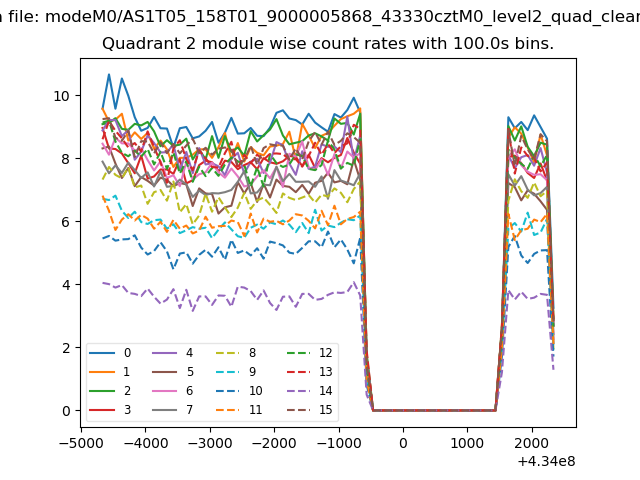
| Module-wise count rates for Quadrant B Data is divided into 100 sec bins |
 |
 |
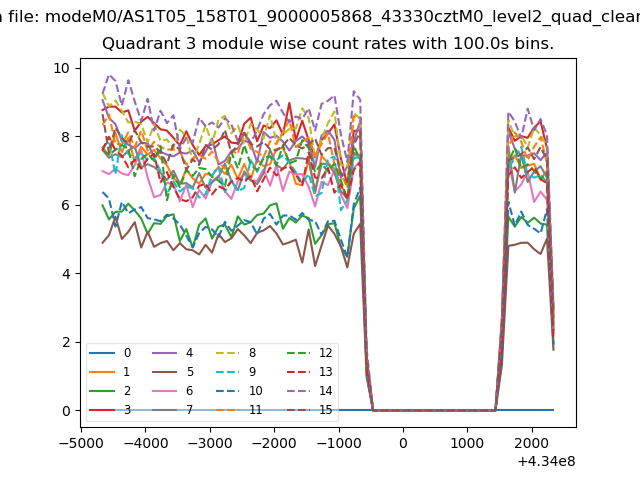
| Module-wise count rates for Quadrant C Data is divided into 100 sec bins |
 |
 |
| Module-wise count rates for Quadrant D Data is divided into 100 sec bins |
 |
 |
| Parameter | Plot |
|---|---|
| CZT HV Monitor | 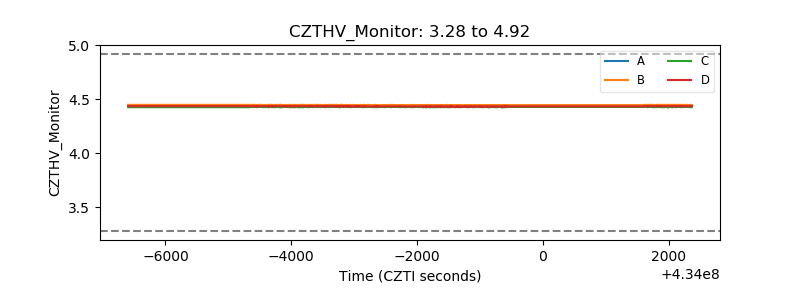 |
| D_VDD | 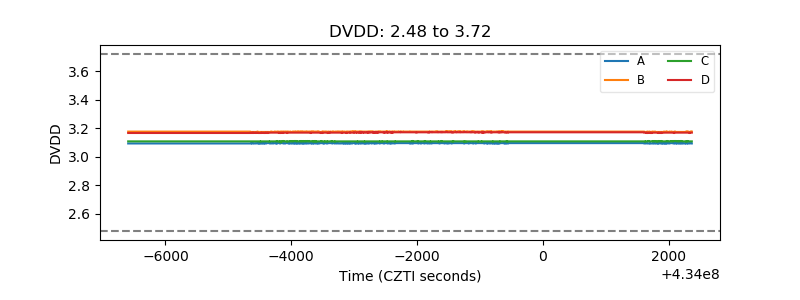 |
| Temperature 1 | 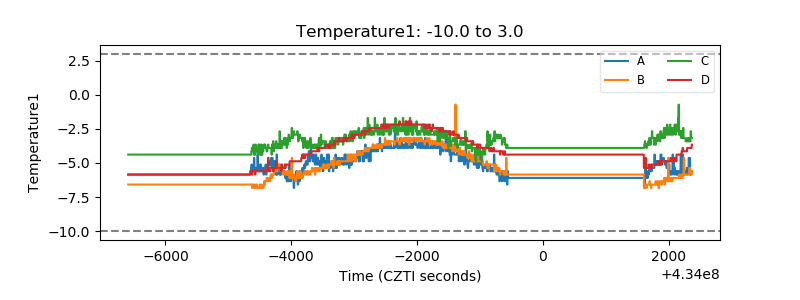 |
| Veto HV Monitor | 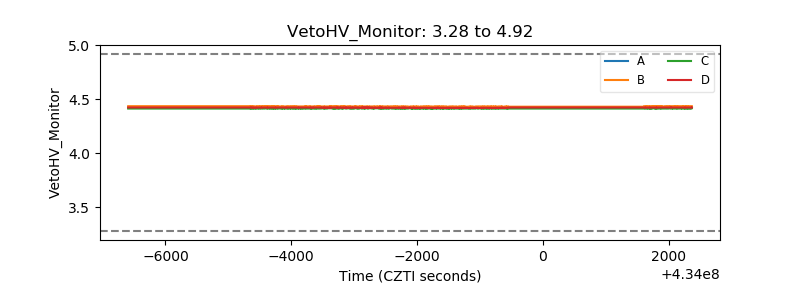 |
| Veto LLD | 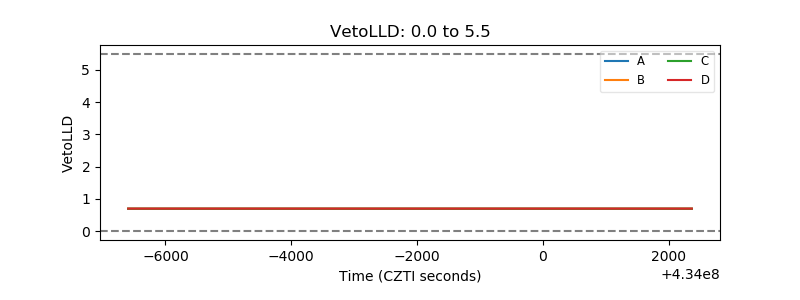 |
| Alpha Counter | 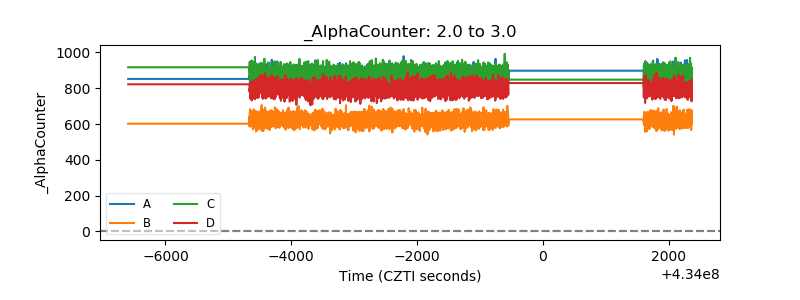 |
| _CPM_Rate | 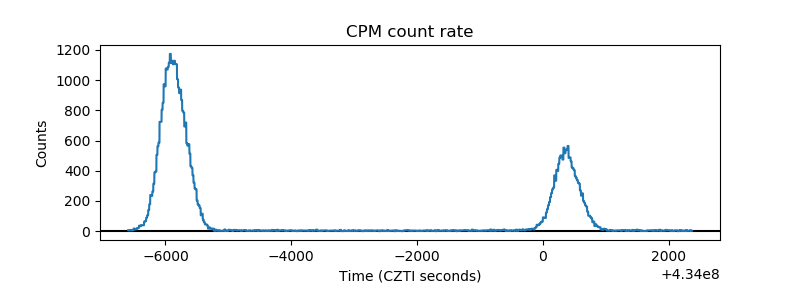 |
| CZT Counter | 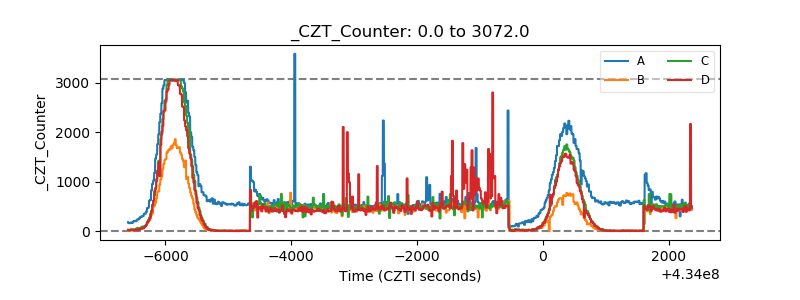 |
| +2.5 Volts monitor | 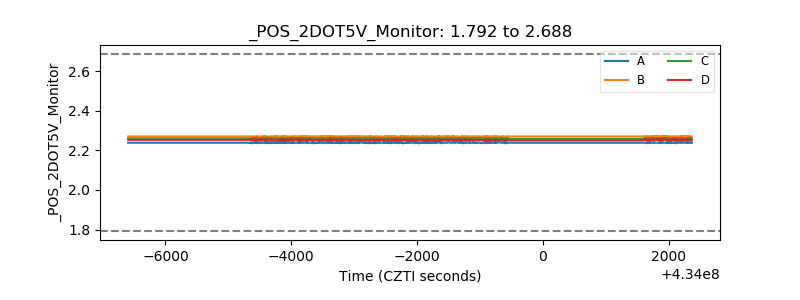 |
| +5 Volts monitor | 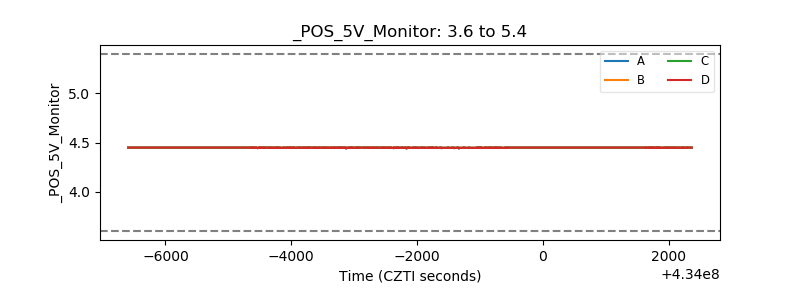 |
| _ROLL_ROT | 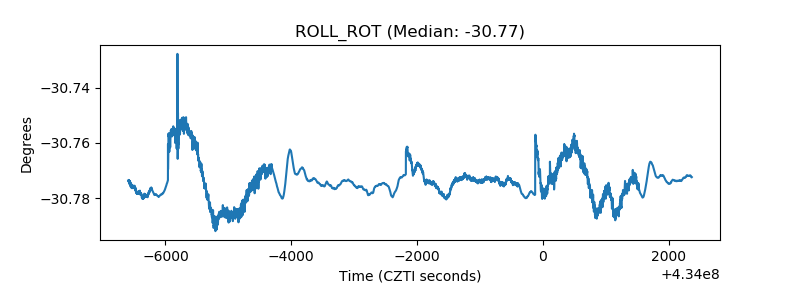 |
| _Roll_DEC | 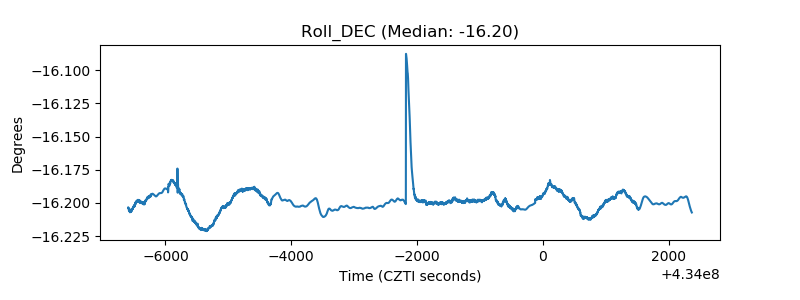 |
| _Roll_RA | 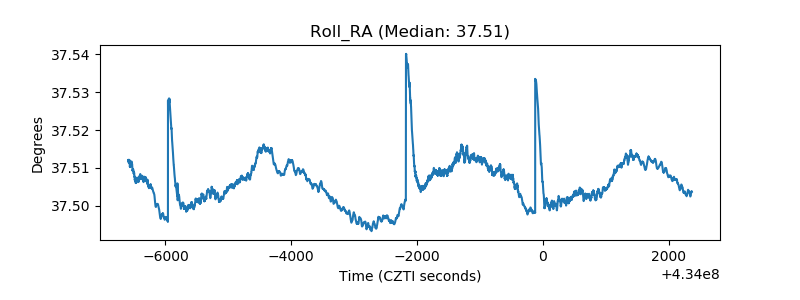 |
| Veto Counter | 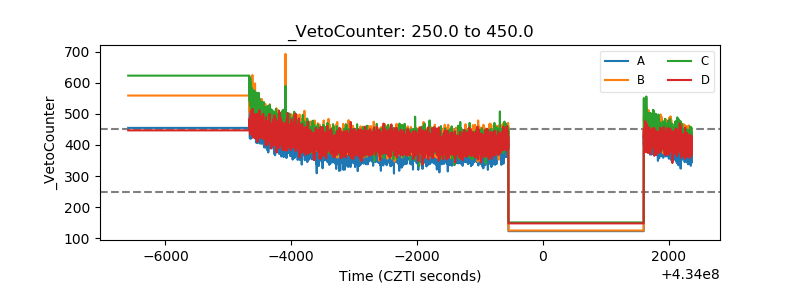 |