| Param | Original file | Final file |
|---|---|---|
| Filename | modeM0/AS1T05_158T01_9000005868_43331cztM0_level2.fits | modeM0/AS1T05_158T01_9000005868_43331cztM0_level2_quad_clean.evt |
| Size (bytes) | 285,477,120 | 81,823,680 |
| Size | 272.3 MB | 78.0 MB |
| Events in quadrant A | 2,716,561 | 552,722 |
| Events in quadrant B | 2,367,934 | 561,276 |
| Events in quadrant C | 2,359,504 | 541,524 |
| Events in quadrant D | 2,748,850 | 485,250 |
| Mode M0 | |||
|---|---|---|---|
| Quadrant | BADHDUFLAG | Total packets | Discarded packets |
| A | 0 | 10774 | 2 |
| B | 0 | 10157 | 2 |
| C | 0 | 9691 | 2 |
| D | 0 | 11486 | 2 |
| Mode M9 | |||
|---|---|---|---|
| Quadrant | BADHDUFLAG | Total packets | Discarded packets |
| A | 0 | 31 | 0 |
| B | 0 | 32 | 0 |
| C | 0 | 32 | 0 |
| D | 0 | 32 | 0 |
| Mode SS | |||
|---|---|---|---|
| Quadrant | BADHDUFLAG | Total packets | Discarded packets |
| A | 0 | 98 | 0 |
| B | 0 | 98 | 0 |
| C | 0 | 98 | 0 |
| D | 0 | 98 | 0 |
| Quadrant | Total seconds | Saturated seconds | Saturation percentage |
|---|---|---|---|
| A | 4800 | 12 | 0.250000% |
| B | 4800 | 59 | 1.229167% |
| C | 4800 | 3 | 0.062500% |
| D | 4800 | 147 | 3.062500% |
Noise dominated data is calculated using 1-second bins in cleaned event files. If a bin has >2000 counts, and if more than 50% of those come from <1% of pixels, then it is considered to be noise-dominated and hence unusable.
| Quadrant | # 1 sec bins | Bins with >0 counts | Bins with >2000 counts | High rate bins dominated by noise | Noise dominated (total time) | Noise dominated (detector-on time) | Marked lightcurve |
|---|---|---|---|---|---|---|---|
| A | 6893 | 4801 | 9 | 9 | 0.13% | 0.19% | 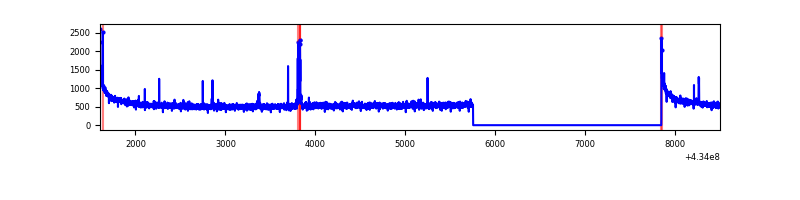 |
| B | 6893 | 4801 | 52 | 52 | 0.75% | 1.08% | 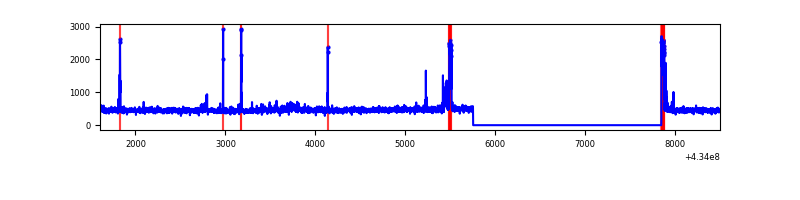 |
| C | 6893 | 4801 | 0 | 0 | 0.00% | 0.00% | 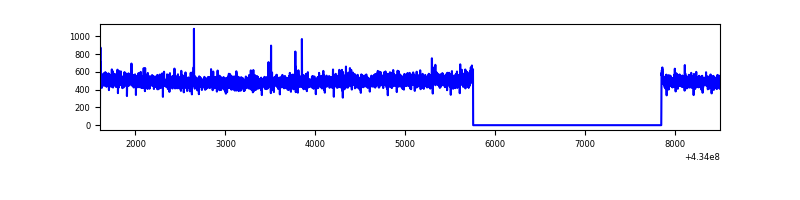 |
| D | 6892 | 4800 | 135 | 135 | 1.96% | 2.81% | 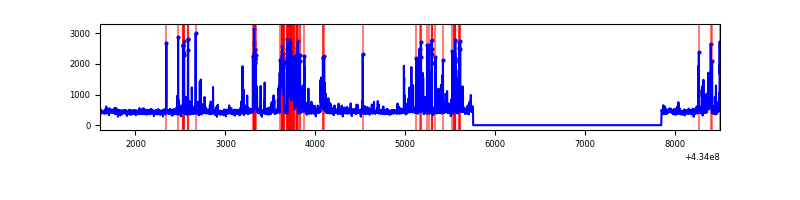 |
Top three noisy pixels from each quadrant. If the there are fewer than three noisy pixels in the level2.evt file, extra rows are filled as -1
| Pixel properties | Quadrant properties | ||||||
|---|---|---|---|---|---|---|---|
| Quadrant | DetID | PixID | Counts | Sigma | Mean | Median | Sigma |
| A | 10 | 83 | 520357 | 4575.75 | 552 | 541 | 113.6 |
| A | 15 | 237 | 57500 | 501.39 | 552 | 541 | 113.6 |
| A | 13 | 6 | 7187 | 58.5 | 552 | 541 | 113.6 |
| B | 5 | 172 | 168760 | 1583.56 | 541 | 527 | 106.2 |
| B | 0 | 189 | 44146 | 410.58 | 541 | 527 | 106.2 |
| B | 0 | 245 | 16637 | 151.64 | 541 | 527 | 106.2 |
| C | 15 | 214 | 202358 | 1586.1 | 542 | 545 | 127.2 |
| C | 3 | 233 | 27946 | 215.35 | 542 | 545 | 127.2 |
| C | 15 | 159 | 6471 | 46.57 | 542 | 545 | 127.2 |
| D | 13 | 249 | 436533 | 3312.78 | 535 | 520 | 131.6 |
| D | 12 | 6 | 116658 | 882.41 | 535 | 520 | 131.6 |
| D | 7 | 96 | 100755 | 761.58 | 535 | 520 | 131.6 |
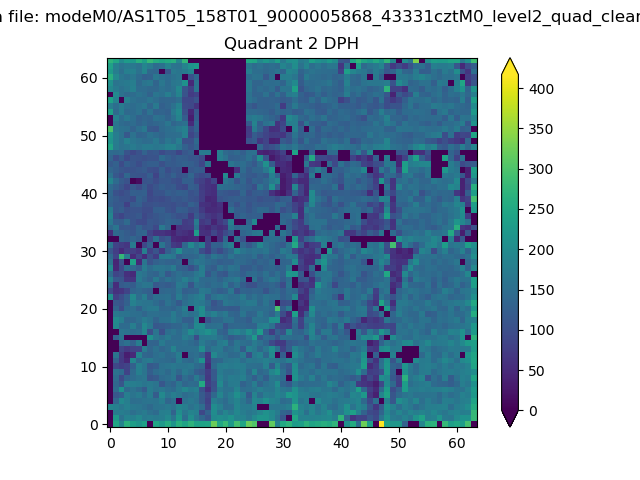
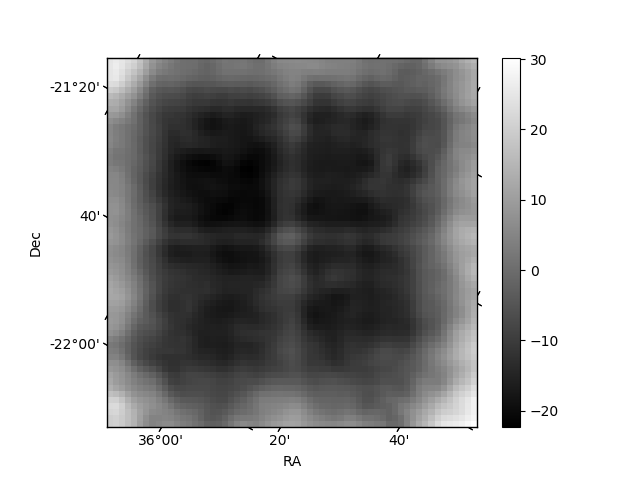
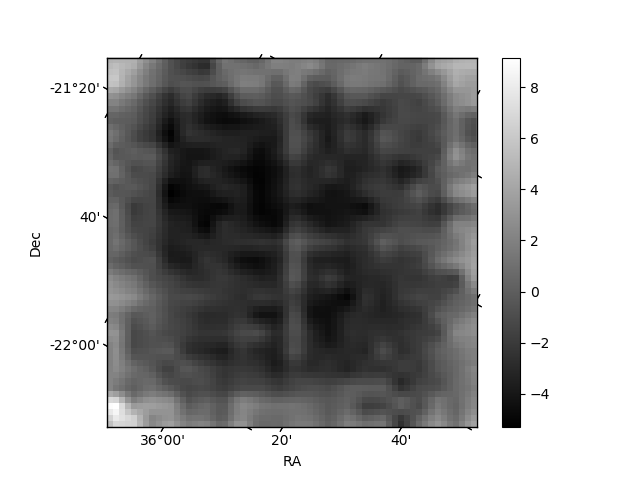
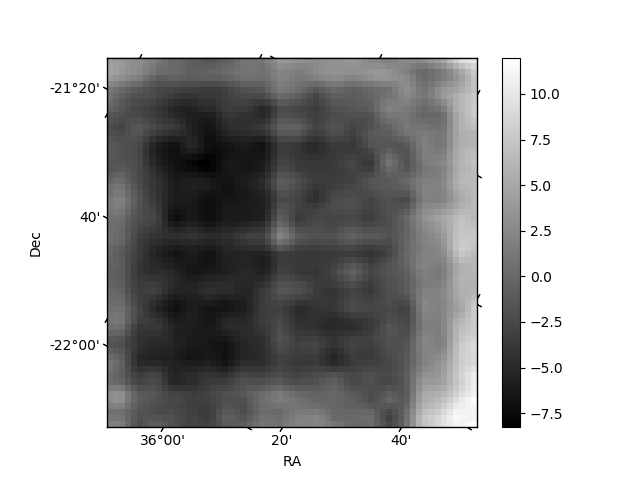
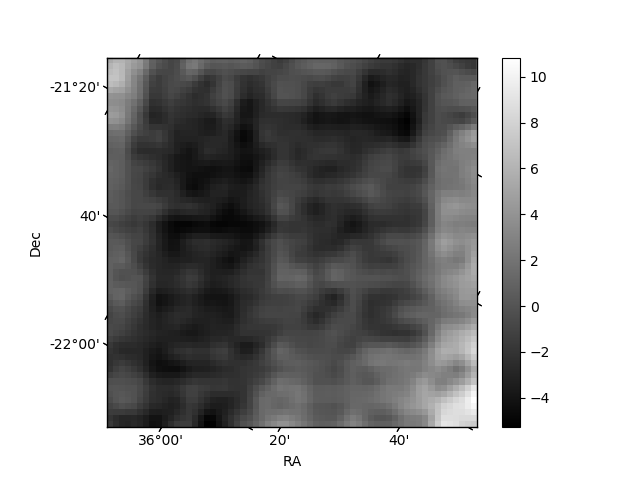
Histogram calculated using DETX and DETY for each event in the final _common_clean file
| Quadrant A | 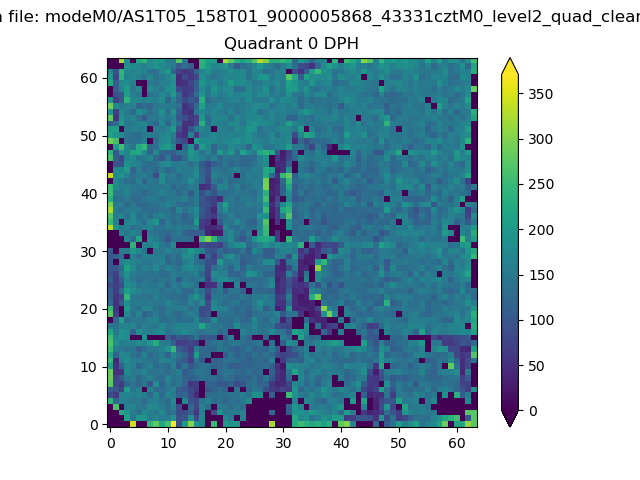 |
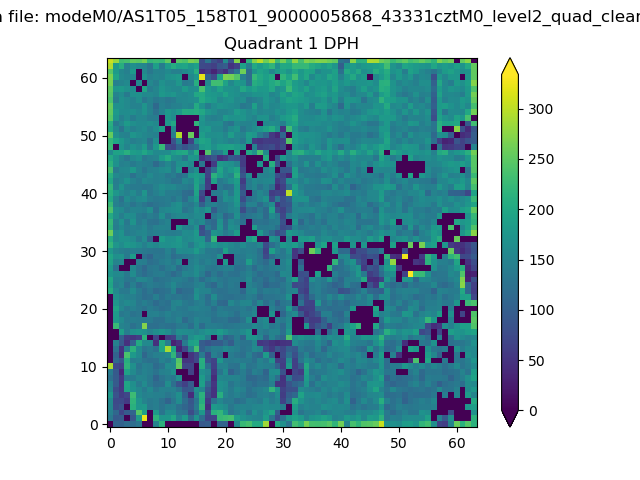 |
Quadrant B |
|---|---|---|---|
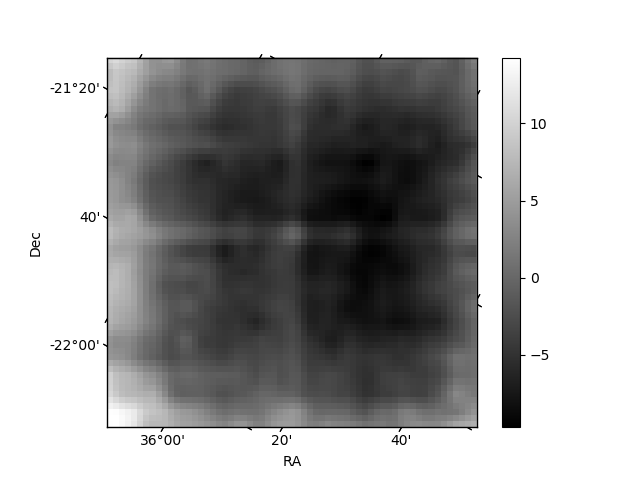
| Quadrant D | 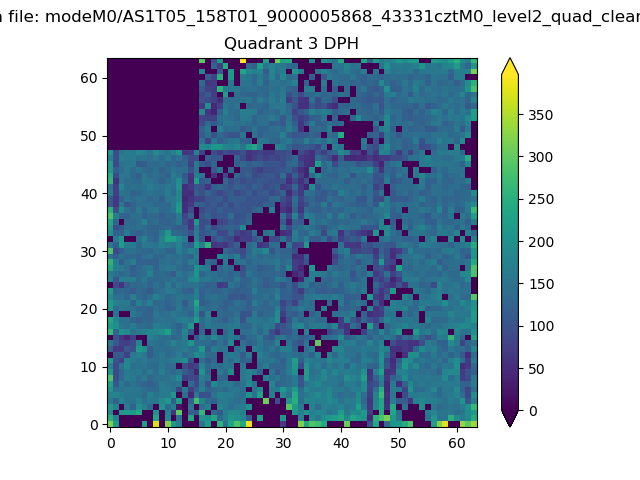 |
 |
Quadrant C |
| Plot type | Count rate plots | Images |
|---|---|---|
| Comparison with Poisson distribution Blue bars denote a histogram of data divided into 1 sec bins. Red curve is a Poisson curve with rate = median count rate of data. |
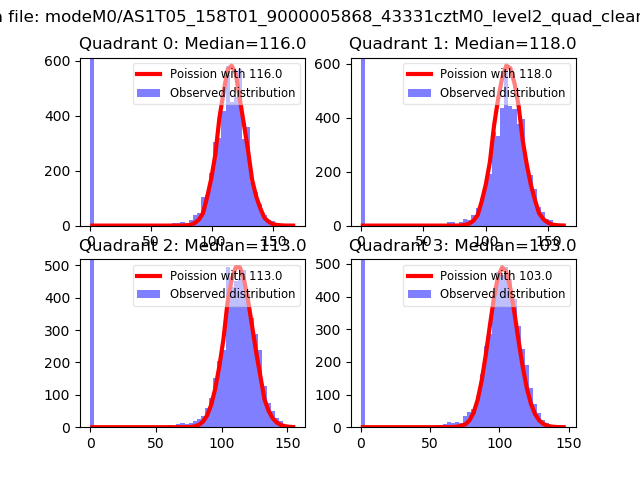 |
 |
| Quadrant-wise count rates Data is divided into 100 sec bins |
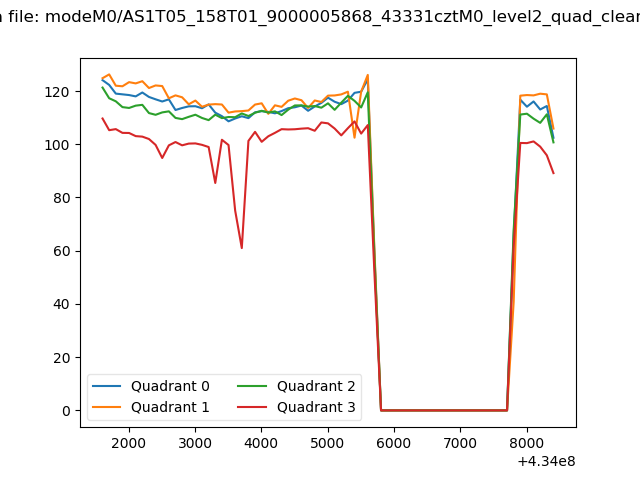 |
|
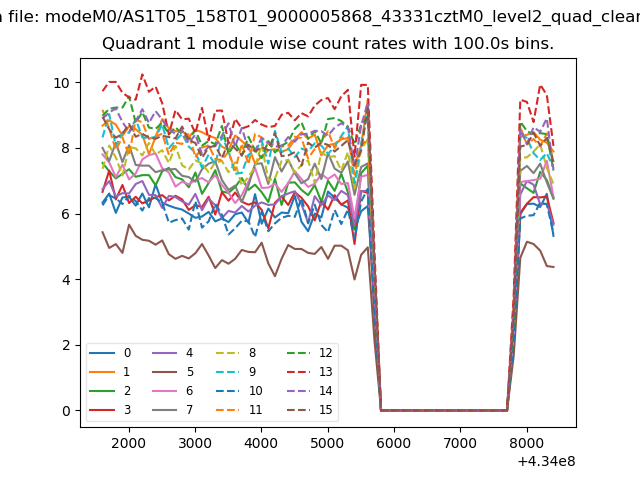
| Module-wise count rates for Quadrant A Data is divided into 100 sec bins |
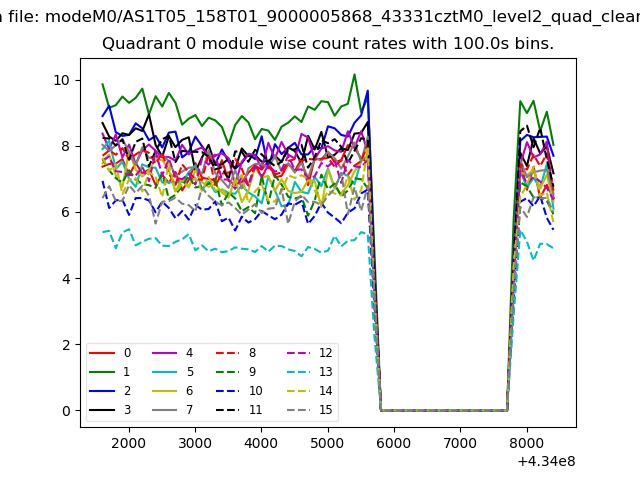 |
 |
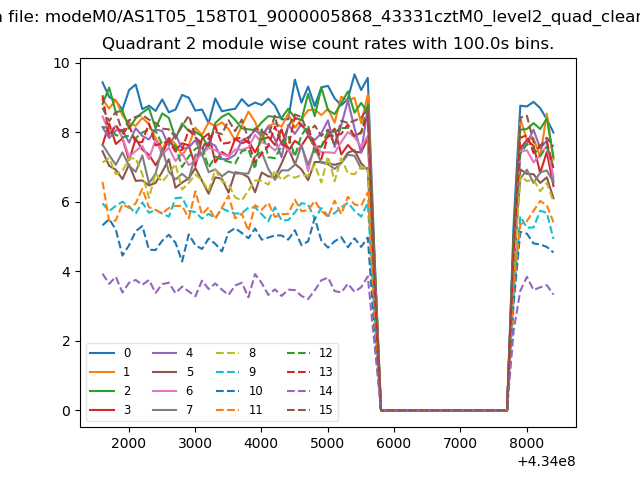
| Module-wise count rates for Quadrant B Data is divided into 100 sec bins |
 |
 |
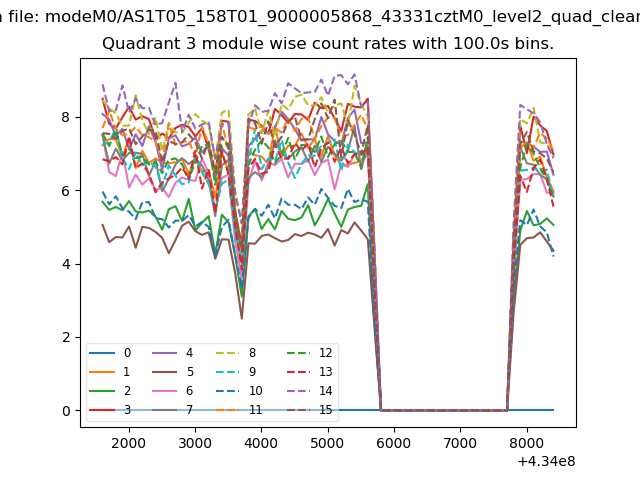
| Module-wise count rates for Quadrant C Data is divided into 100 sec bins |
 |
 |
| Module-wise count rates for Quadrant D Data is divided into 100 sec bins |
 |
 |
| Parameter | Plot |
|---|---|
| CZT HV Monitor | 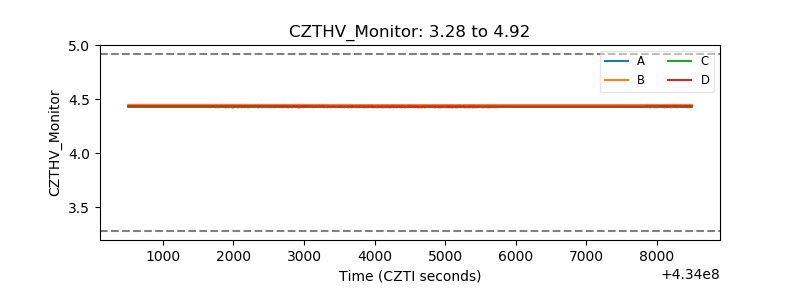 |
| D_VDD | 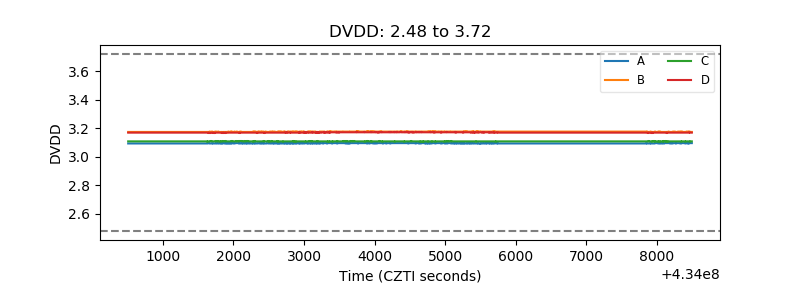 |
| Temperature 1 | 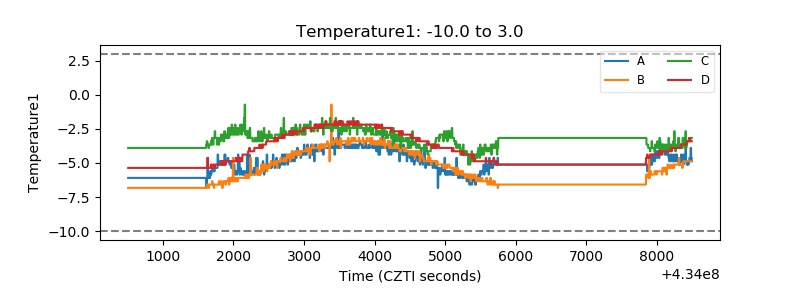 |
| Veto HV Monitor | 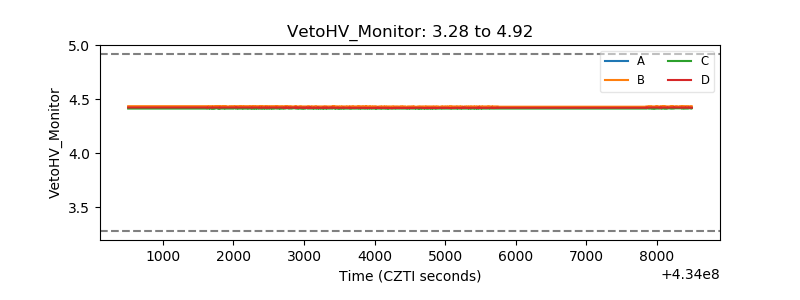 |
| Veto LLD | 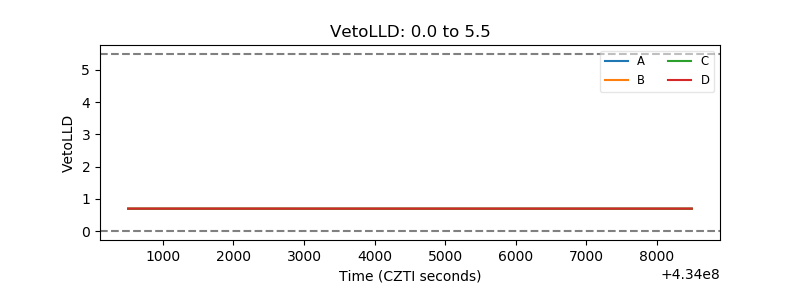 |
| Alpha Counter | 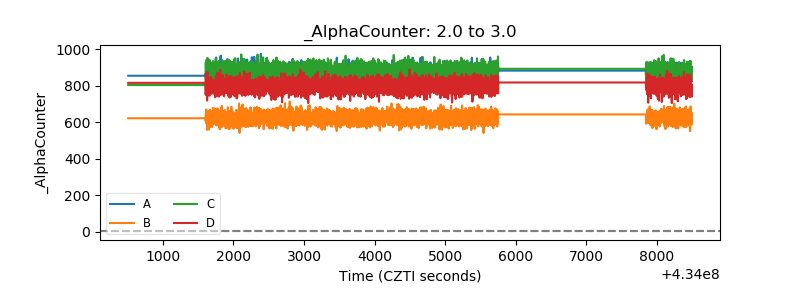 |
| _CPM_Rate | 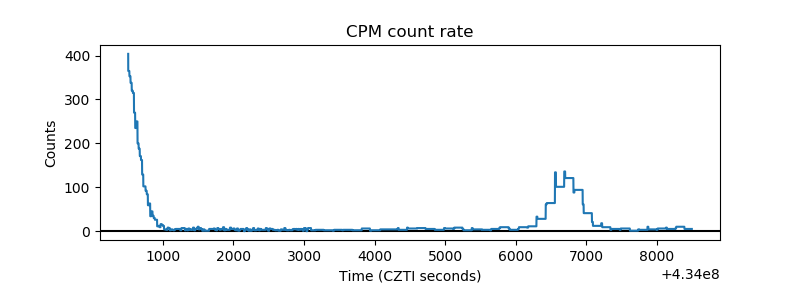 |
| CZT Counter | 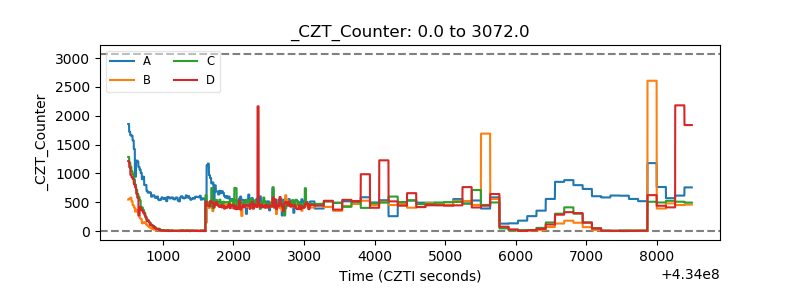 |
| +2.5 Volts monitor | 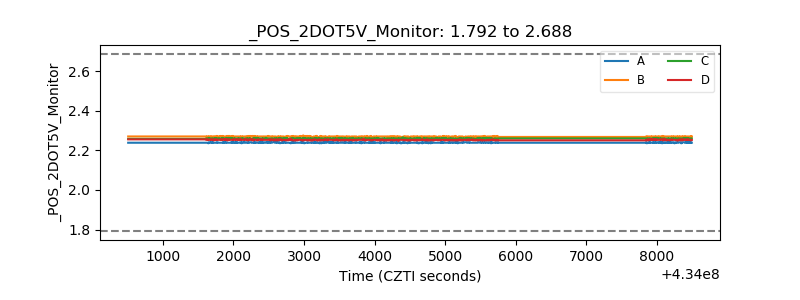 |
| +5 Volts monitor | 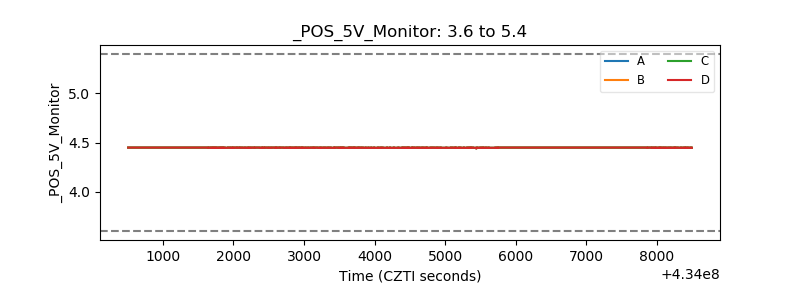 |
| _ROLL_ROT | 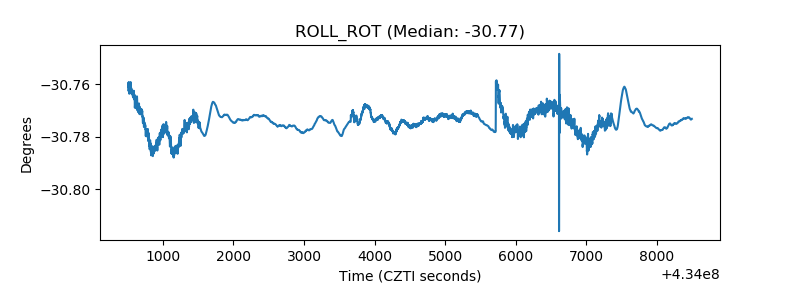 |
| _Roll_DEC | 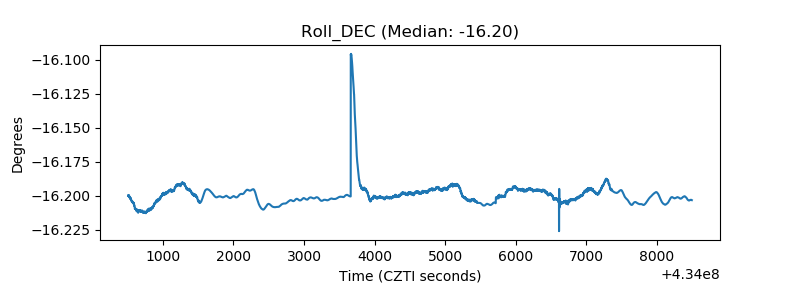 |
| _Roll_RA | 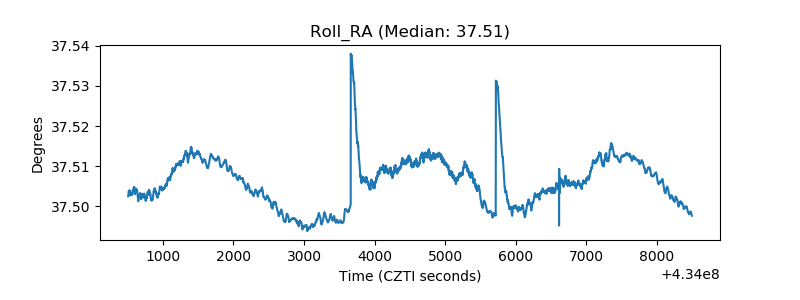 |
| Veto Counter | 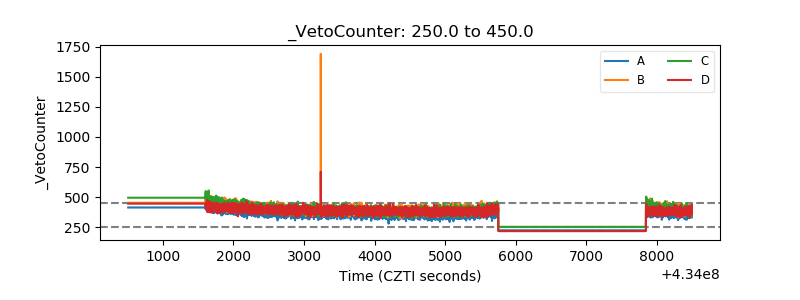 |