| Param | Original file | Final file |
|---|---|---|
| Filename | modeM0/AS1T05_158T01_9000005868_43332cztM0_level2.fits | modeM0/AS1T05_158T01_9000005868_43332cztM0_level2_quad_clean.evt |
| Size (bytes) | 302,270,400 | 86,434,560 |
| Size | 288.3 MB | 82.4 MB |
| Events in quadrant A | 3,012,754 | 575,235 |
| Events in quadrant B | 2,528,359 | 591,762 |
| Events in quadrant C | 2,550,225 | 569,856 |
| Events in quadrant D | 2,691,654 | 515,767 |
| Mode M0 | |||
|---|---|---|---|
| Quadrant | BADHDUFLAG | Total packets | Discarded packets |
| A | 0 | 11922 | 2 |
| B | 0 | 10854 | 3 |
| C | 0 | 10650 | 2 |
| D | 0 | 11669 | 2 |
| Mode M9 | |||
|---|---|---|---|
| Quadrant | BADHDUFLAG | Total packets | Discarded packets |
| A | 0 | 34 | 0 |
| B | 0 | 35 | 0 |
| C | 0 | 35 | 0 |
| D | 0 | 35 | 0 |
| Mode SS | |||
|---|---|---|---|
| Quadrant | BADHDUFLAG | Total packets | Discarded packets |
| A | 0 | 106 | 0 |
| B | 0 | 106 | 0 |
| C | 0 | 106 | 0 |
| D | 0 | 106 | 0 |
| Quadrant | Total seconds | Saturated seconds | Saturation percentage |
|---|---|---|---|
| A | 5207 | 59 | 1.133090% |
| B | 5206 | 43 | 0.825970% |
| C | 5206 | 6 | 0.115252% |
| D | 5206 | 85 | 1.632731% |
Noise dominated data is calculated using 1-second bins in cleaned event files. If a bin has >2000 counts, and if more than 50% of those come from <1% of pixels, then it is considered to be noise-dominated and hence unusable.
| Quadrant | # 1 sec bins | Bins with >0 counts | Bins with >2000 counts | High rate bins dominated by noise | Noise dominated (total time) | Noise dominated (detector-on time) | Marked lightcurve |
|---|---|---|---|---|---|---|---|
| A | 7091 | 5208 | 51 | 51 | 0.72% | 0.98% | 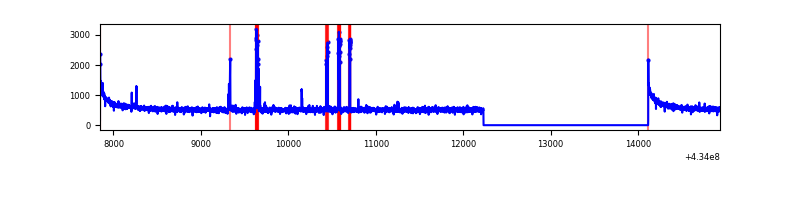 |
| B | 7090 | 5207 | 34 | 34 | 0.48% | 0.65% | 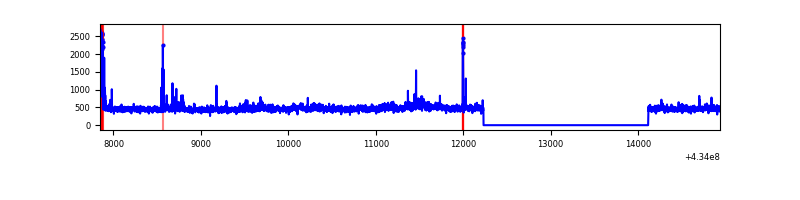 |
| C | 7090 | 5207 | 6 | 6 | 0.08% | 0.12% | 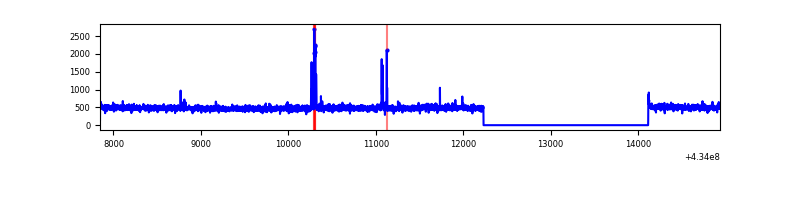 |
| D | 7090 | 5207 | 70 | 70 | 0.99% | 1.34% | 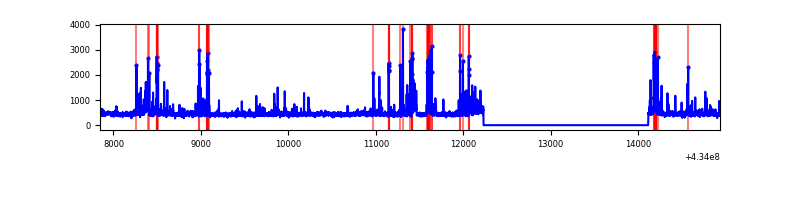 |
Top three noisy pixels from each quadrant. If the there are fewer than three noisy pixels in the level2.evt file, extra rows are filled as -1
| Pixel properties | Quadrant properties | ||||||
|---|---|---|---|---|---|---|---|
| Quadrant | DetID | PixID | Counts | Sigma | Mean | Median | Sigma |
| A | 10 | 83 | 551634 | 4504.01 | 587 | 573 | 122.3 |
| A | 15 | 237 | 182222 | 1484.68 | 587 | 573 | 122.3 |
| A | 13 | 6 | 7095 | 53.3 | 587 | 573 | 122.3 |
| B | 5 | 172 | 112270 | 984.73 | 580 | 563 | 113.4 |
| B | 0 | 189 | 74639 | 653.0 | 580 | 563 | 113.4 |
| B | 0 | 245 | 55538 | 484.62 | 580 | 563 | 113.4 |
| C | 15 | 214 | 220646 | 1619.01 | 576 | 579 | 135.9 |
| C | 12 | 2 | 33863 | 244.87 | 576 | 579 | 135.9 |
| C | 2 | 16 | 21929 | 157.07 | 576 | 579 | 135.9 |
| D | 12 | 6 | 153130 | 1081.31 | 572 | 554 | 141.1 |
| D | 13 | 249 | 150792 | 1064.74 | 572 | 554 | 141.1 |
| D | 7 | 96 | 142636 | 1006.94 | 572 | 554 | 141.1 |
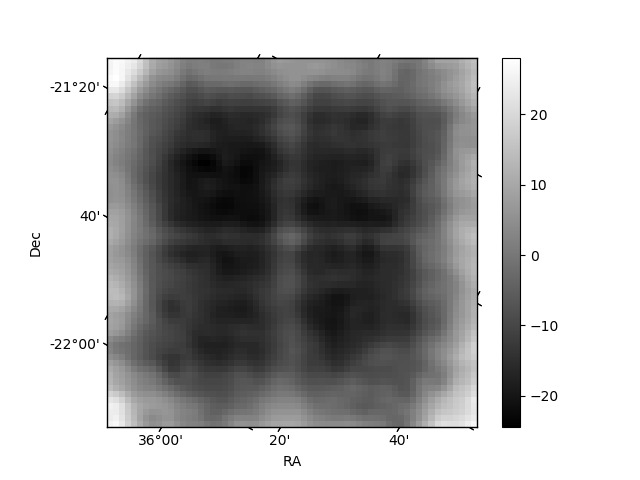
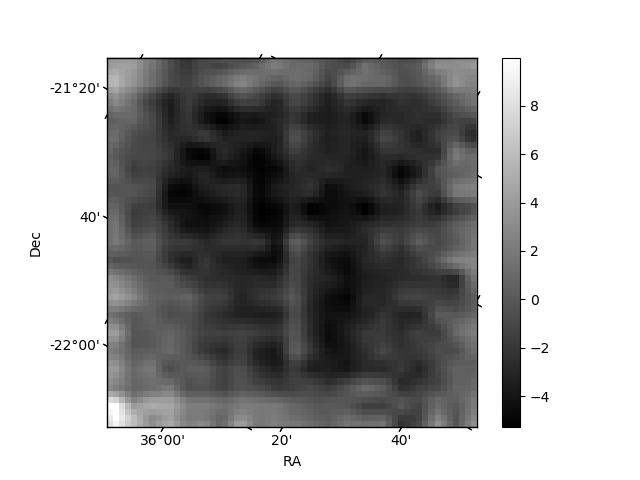
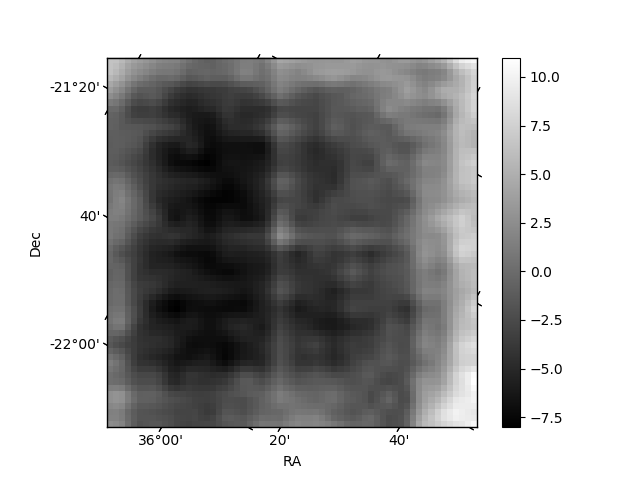
Histogram calculated using DETX and DETY for each event in the final _common_clean file
| Quadrant A | 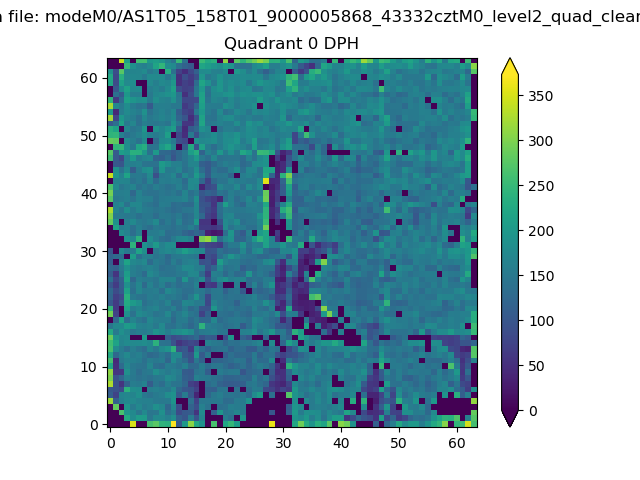 |
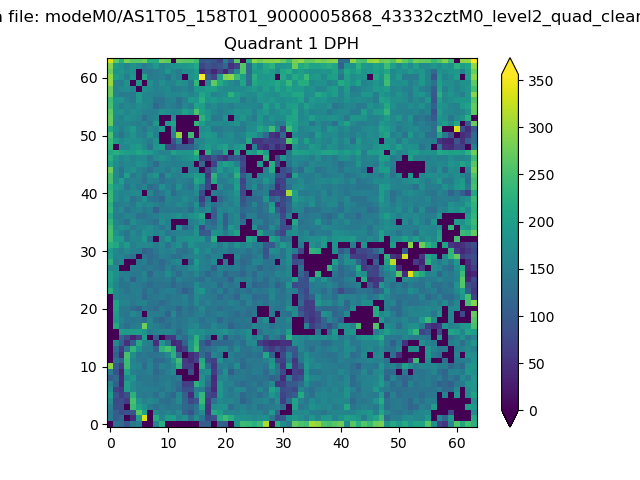 |
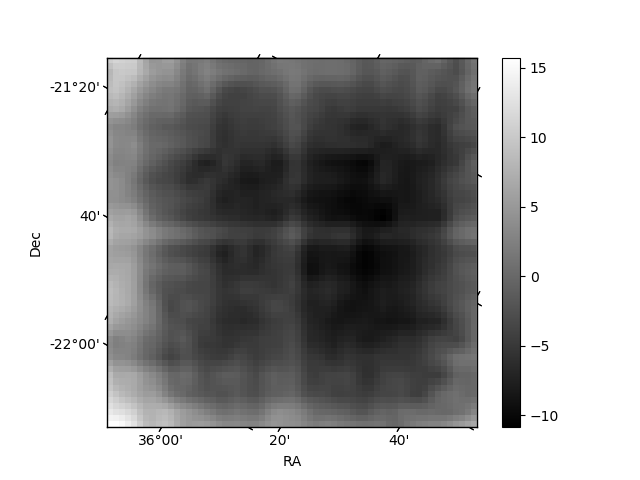
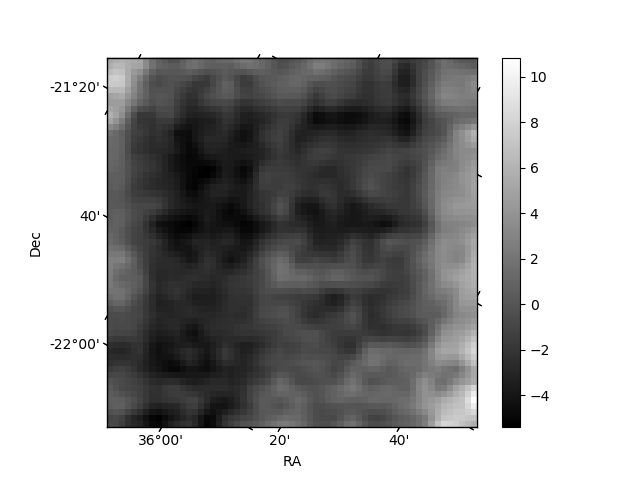
Quadrant B |
|---|---|---|---|
| Quadrant D | 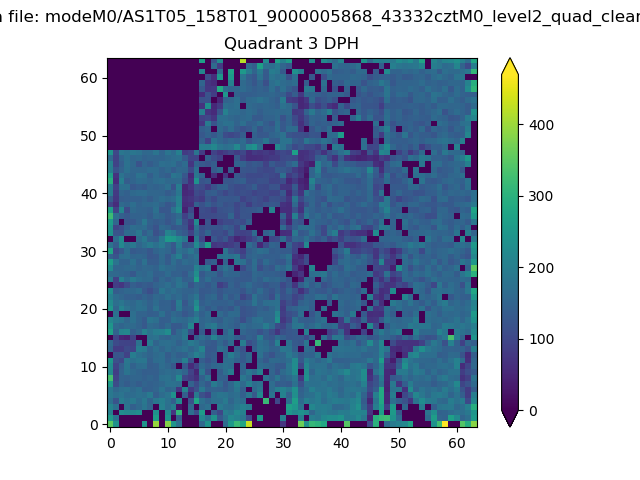 |
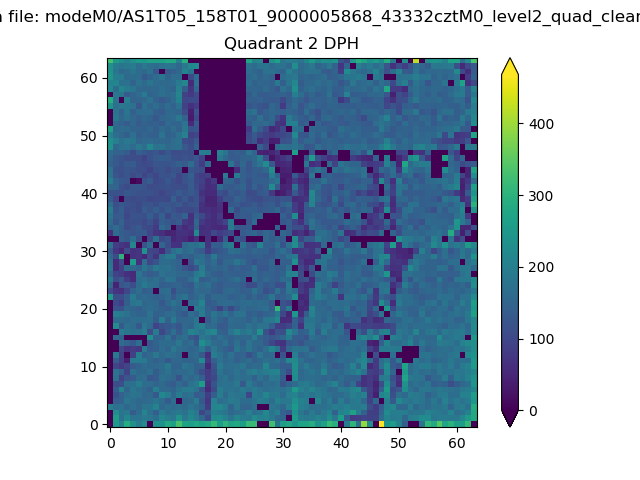 |
Quadrant C |
| Plot type | Count rate plots | Images |
|---|---|---|
| Comparison with Poisson distribution Blue bars denote a histogram of data divided into 1 sec bins. Red curve is a Poisson curve with rate = median count rate of data. |
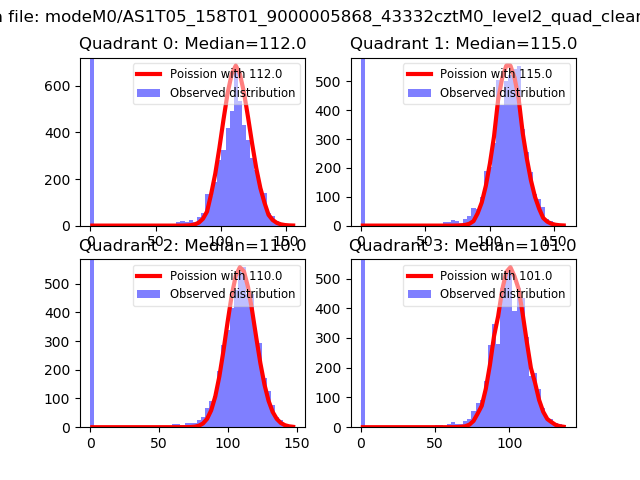 |
 |
| Quadrant-wise count rates Data is divided into 100 sec bins |
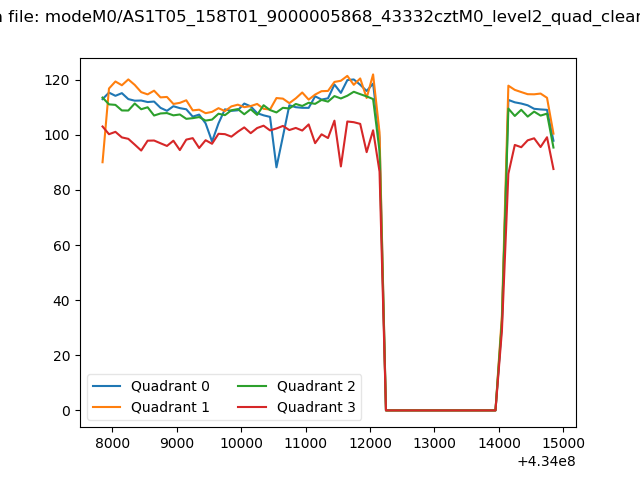 |
|
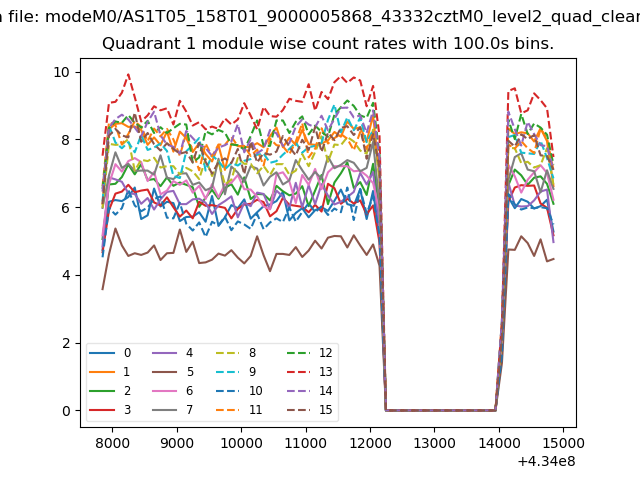
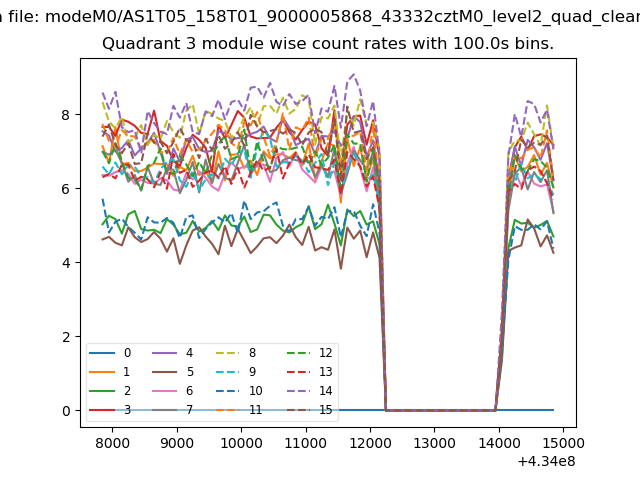
| Module-wise count rates for Quadrant A Data is divided into 100 sec bins |
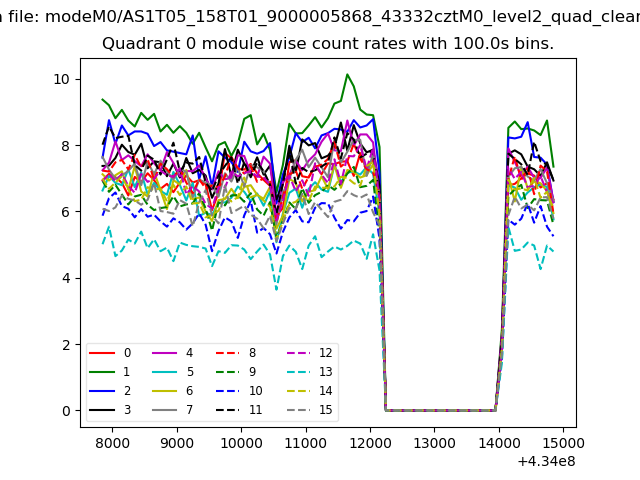 |
 |
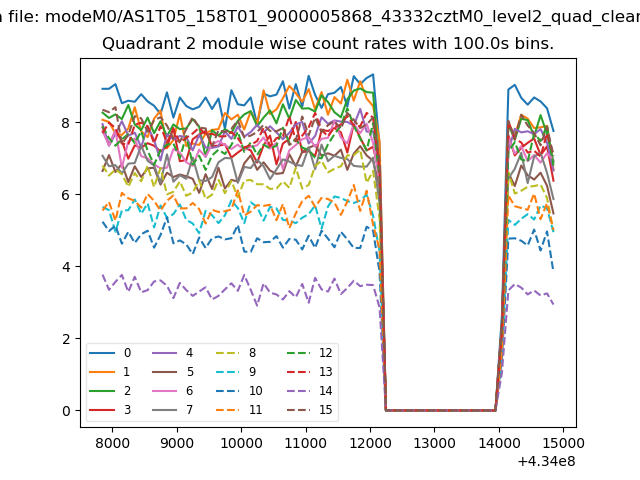
| Module-wise count rates for Quadrant B Data is divided into 100 sec bins |
 |
 |
| Module-wise count rates for Quadrant C Data is divided into 100 sec bins |
 |
 |
| Module-wise count rates for Quadrant D Data is divided into 100 sec bins |
 |
 |
| Parameter | Plot |
|---|---|
| CZT HV Monitor | 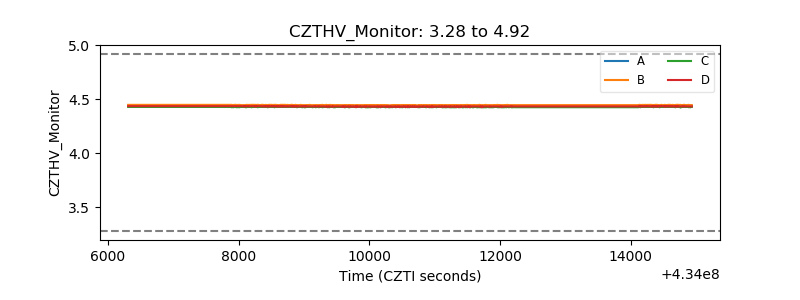 |
| D_VDD | 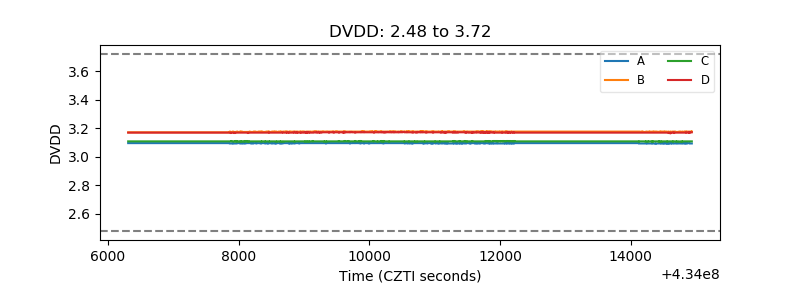 |
| Temperature 1 | 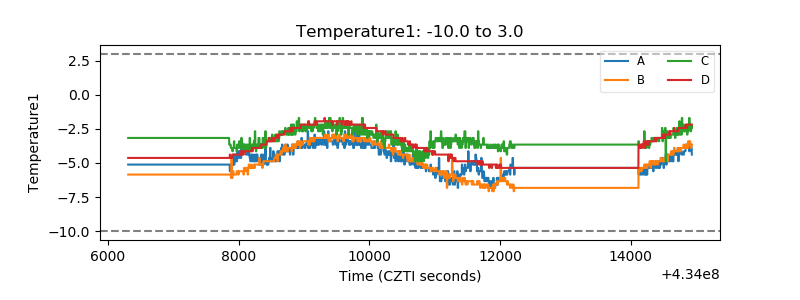 |
| Veto HV Monitor | 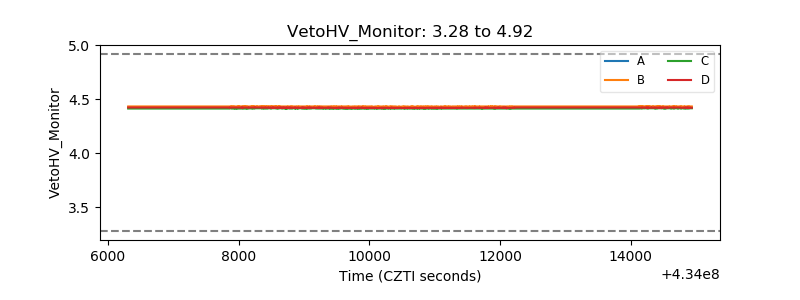 |
| Veto LLD | 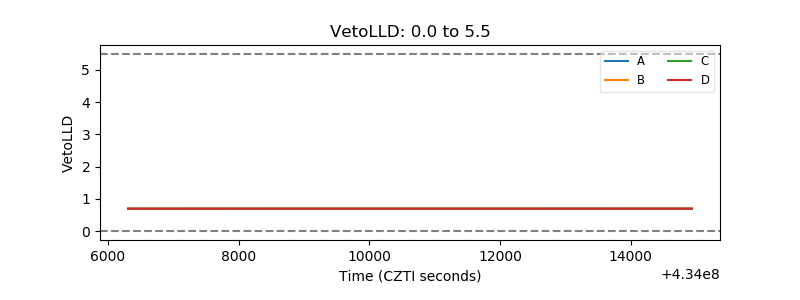 |
| Alpha Counter | 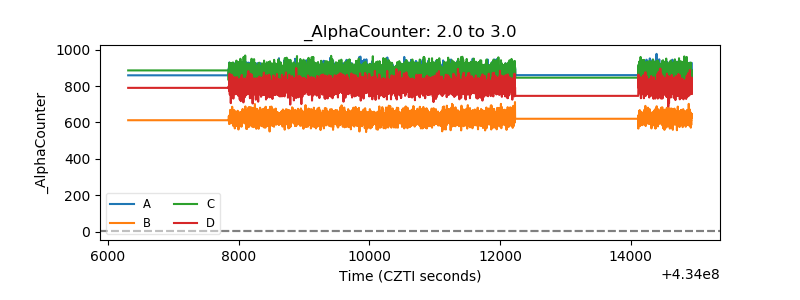 |
| _CPM_Rate | 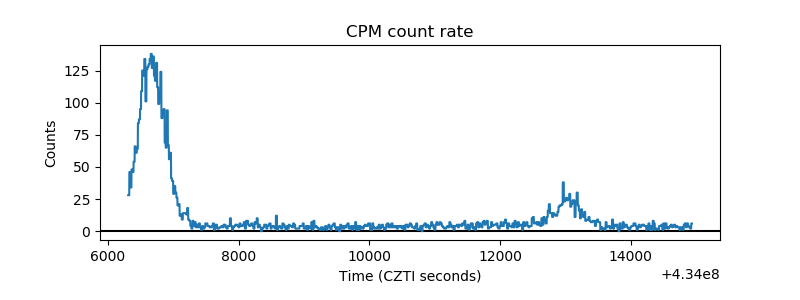 |
| CZT Counter | 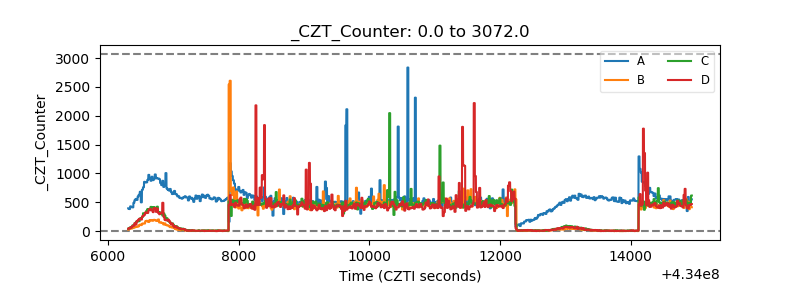 |
| +2.5 Volts monitor | 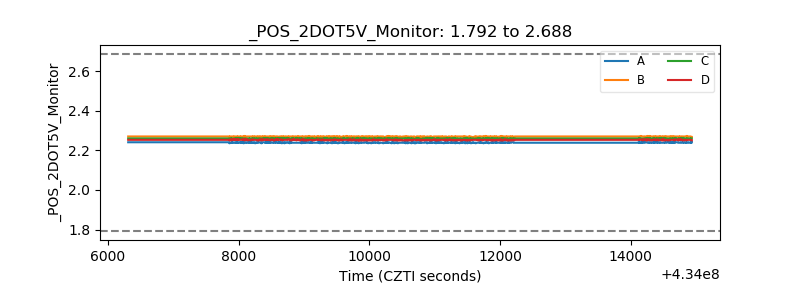 |
| +5 Volts monitor | 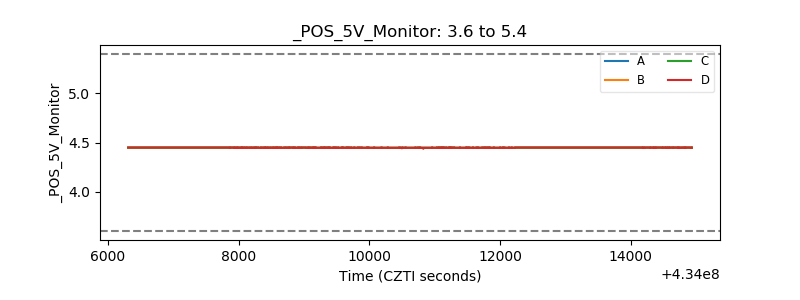 |
| _ROLL_ROT | 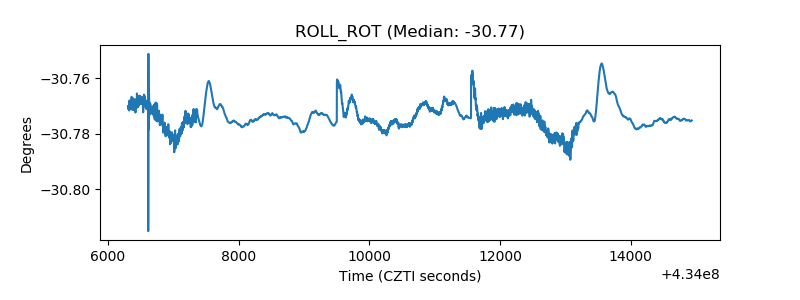 |
| _Roll_DEC | 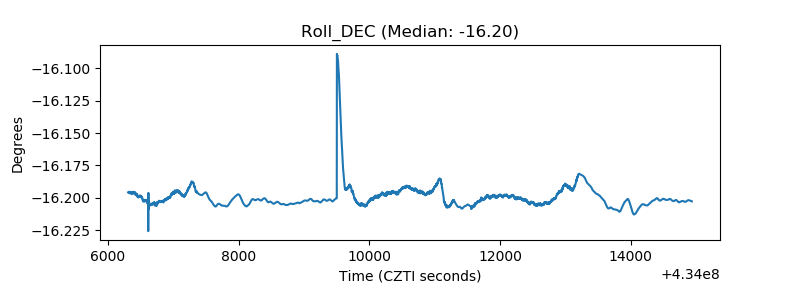 |
| _Roll_RA | 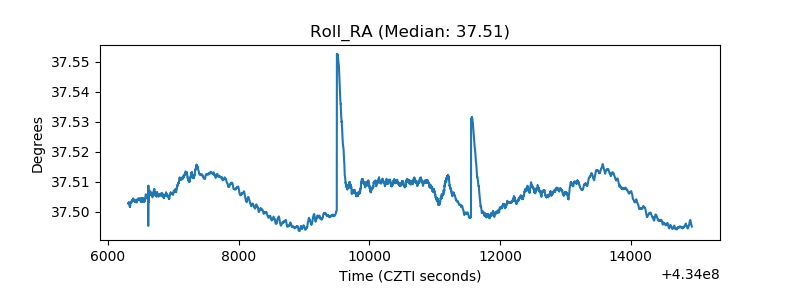 |
| Veto Counter | 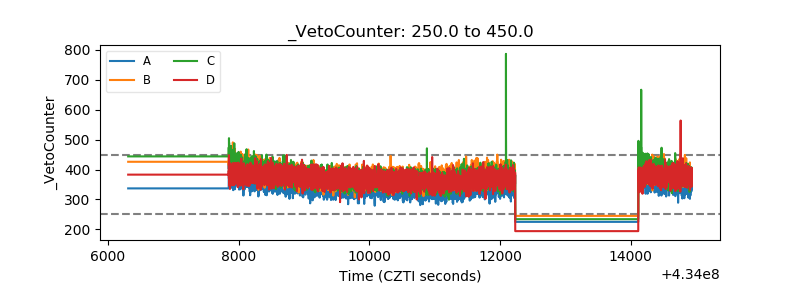 |