| Param | Original file | Final file |
|---|---|---|
| Filename | modeM0/AS1T05_158T01_9000005868_43333cztM0_level2.fits | modeM0/AS1T05_158T01_9000005868_43333cztM0_level2_quad_clean.evt |
| Size (bytes) | 334,059,840 | 95,863,680 |
| Size | 318.6 MB | 91.4 MB |
| Events in quadrant A | 3,118,495 | 641,909 |
| Events in quadrant B | 2,935,846 | 652,351 |
| Events in quadrant C | 2,810,652 | 627,550 |
| Events in quadrant D | 3,046,664 | 573,215 |
| Mode M0 | |||
|---|---|---|---|
| Quadrant | BADHDUFLAG | Total packets | Discarded packets |
| A | 0 | 12627 | 2 |
| B | 0 | 12606 | 2 |
| C | 0 | 11817 | 2 |
| D | 0 | 13195 | 2 |
| Mode M9 | |||
|---|---|---|---|
| Quadrant | BADHDUFLAG | Total packets | Discarded packets |
| A | 0 | 34 | 0 |
| B | 0 | 34 | 0 |
| C | 0 | 34 | 0 |
| D | 0 | 34 | 0 |
| Mode SS | |||
|---|---|---|---|
| Quadrant | BADHDUFLAG | Total packets | Discarded packets |
| A | 0 | 122 | 0 |
| B | 0 | 122 | 0 |
| C | 0 | 122 | 0 |
| D | 0 | 122 | 0 |
| Quadrant | Total seconds | Saturated seconds | Saturation percentage |
|---|---|---|---|
| A | 5830 | 10 | 0.171527% |
| B | 5829 | 75 | 1.286670% |
| C | 5830 | 6 | 0.102916% |
| D | 5830 | 107 | 1.835334% |
Noise dominated data is calculated using 1-second bins in cleaned event files. If a bin has >2000 counts, and if more than 50% of those come from <1% of pixels, then it is considered to be noise-dominated and hence unusable.
| Quadrant | # 1 sec bins | Bins with >0 counts | Bins with >2000 counts | High rate bins dominated by noise | Noise dominated (total time) | Noise dominated (detector-on time) | Marked lightcurve |
|---|---|---|---|---|---|---|---|
| A | 9266 | 5832 | 3 | 3 | 0.03% | 0.05% | 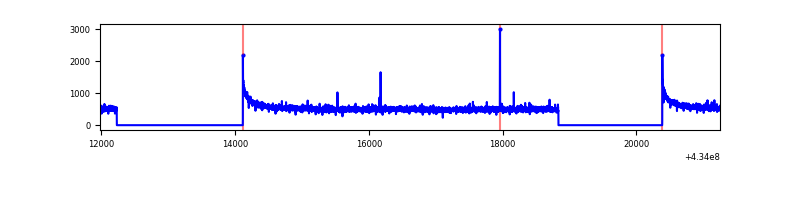 |
| B | 9265 | 5831 | 59 | 59 | 0.64% | 1.01% | 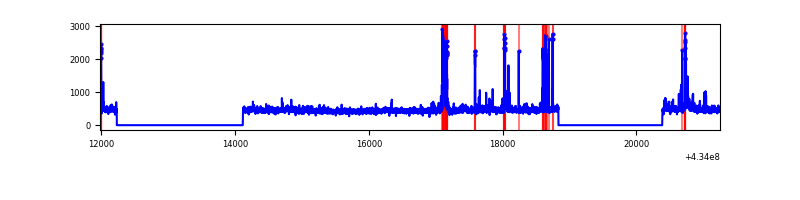 |
| C | 9266 | 5832 | 1 | 1 | 0.01% | 0.02% | 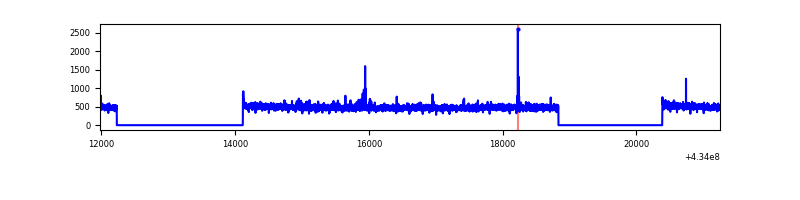 |
| D | 9266 | 5832 | 87 | 87 | 0.94% | 1.49% | 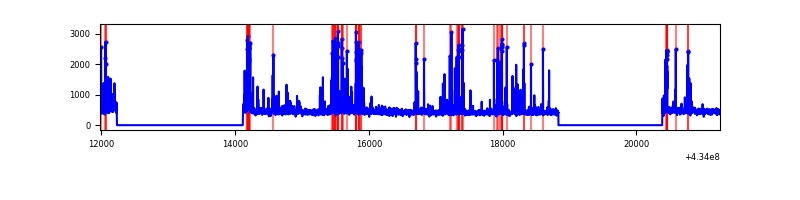 |
Top three noisy pixels from each quadrant. If the there are fewer than three noisy pixels in the level2.evt file, extra rows are filled as -1
| Pixel properties | Quadrant properties | ||||||
|---|---|---|---|---|---|---|---|
| Quadrant | DetID | PixID | Counts | Sigma | Mean | Median | Sigma |
| A | 10 | 83 | 581318 | 4293.71 | 653 | 638 | 135.2 |
| A | 15 | 190 | 8601 | 58.88 | 653 | 638 | 135.2 |
| A | 3 | 137 | 7439 | 50.29 | 653 | 638 | 135.2 |
| B | 5 | 172 | 293927 | 2303.53 | 643 | 625 | 127.3 |
| B | 0 | 189 | 89719 | 699.72 | 643 | 625 | 127.3 |
| B | 0 | 245 | 22034 | 168.14 | 643 | 625 | 127.3 |
| C | 15 | 214 | 246143 | 1640.48 | 638 | 642 | 149.7 |
| C | 3 | 233 | 39375 | 258.82 | 638 | 642 | 149.7 |
| C | 15 | 159 | 20443 | 132.31 | 638 | 642 | 149.7 |
| D | 13 | 249 | 233168 | 1496.83 | 632 | 615 | 155.4 |
| D | 2 | 249 | 102342 | 654.76 | 632 | 615 | 155.4 |
| D | 12 | 6 | 93797 | 599.76 | 632 | 615 | 155.4 |
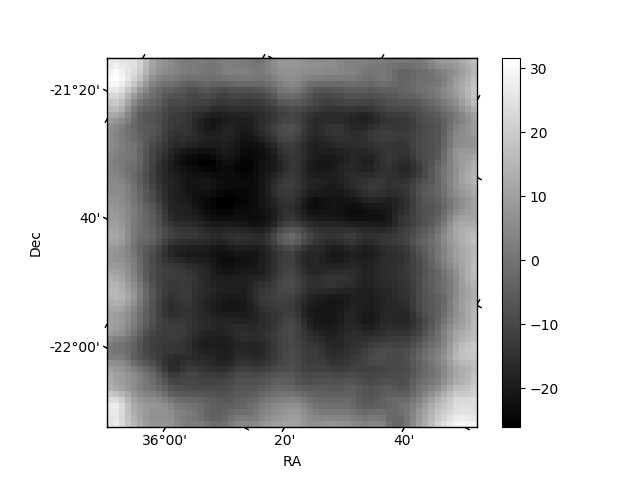
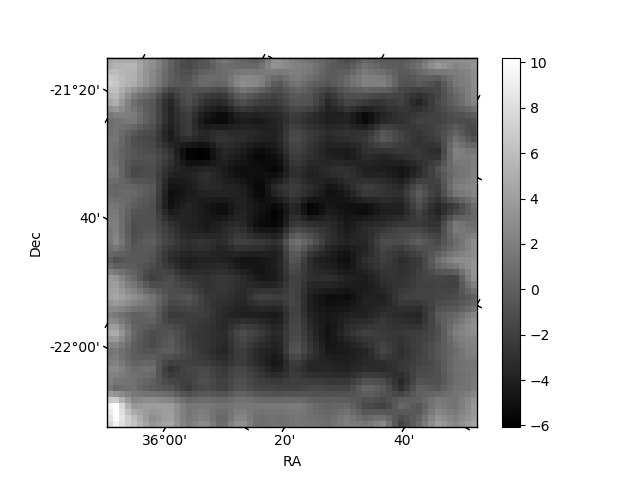
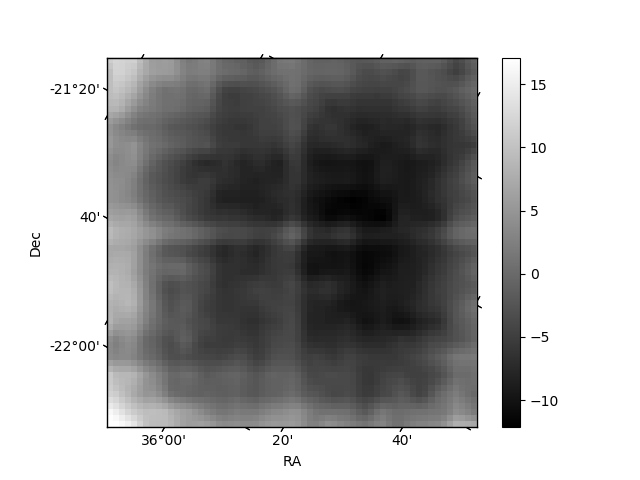
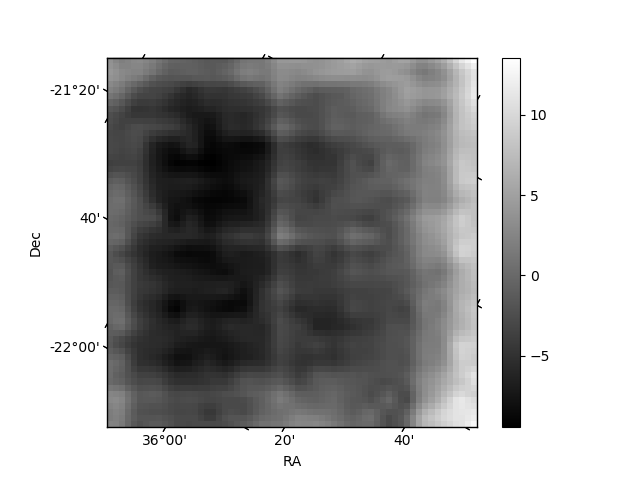
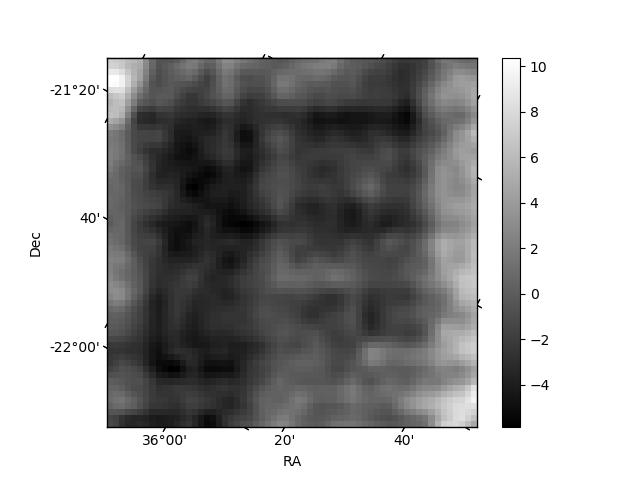
Histogram calculated using DETX and DETY for each event in the final _common_clean file
| Quadrant A | 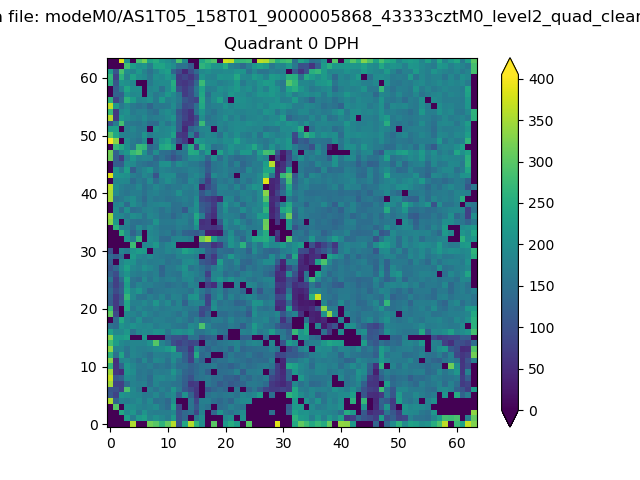 |
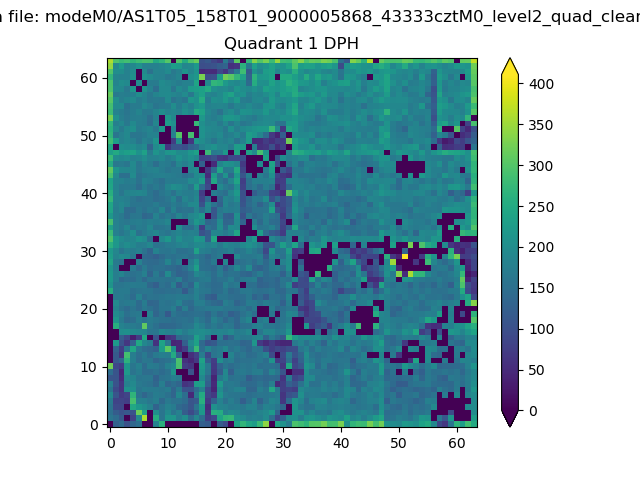 |
Quadrant B |
|---|---|---|---|
| Quadrant D | 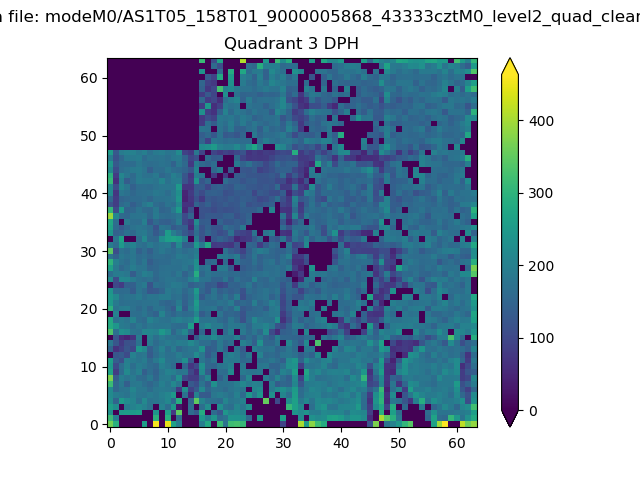 |
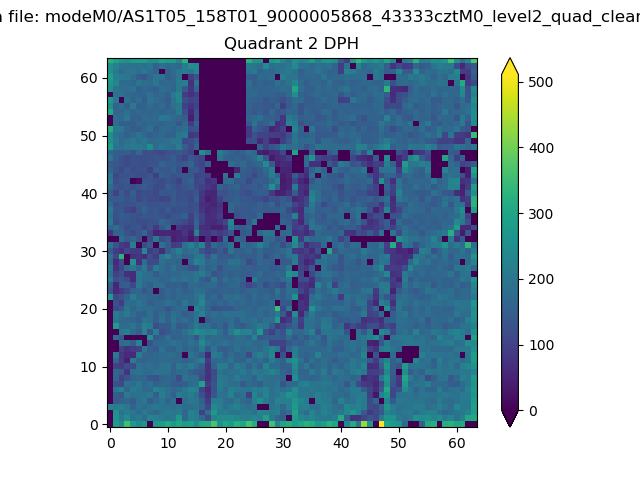 |
Quadrant C |
| Plot type | Count rate plots | Images |
|---|---|---|
| Comparison with Poisson distribution Blue bars denote a histogram of data divided into 1 sec bins. Red curve is a Poisson curve with rate = median count rate of data. |
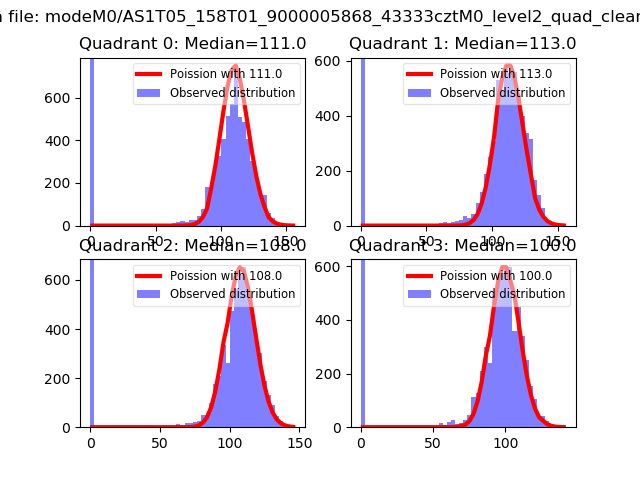 |
 |
| Quadrant-wise count rates Data is divided into 100 sec bins |
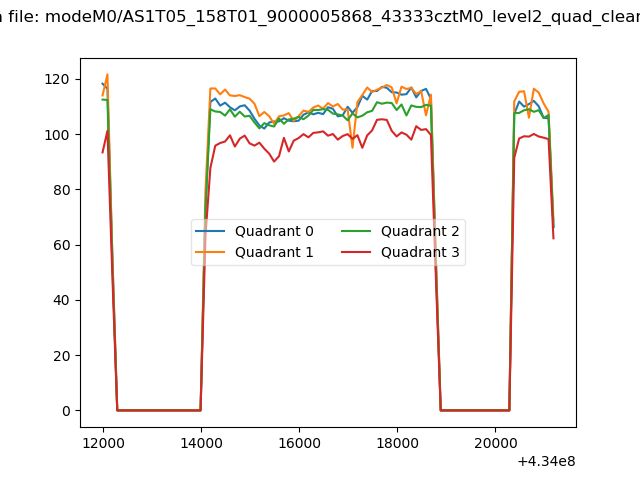 |
|
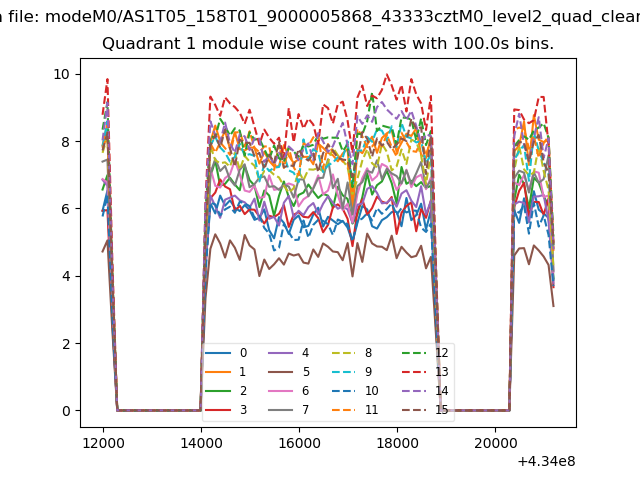
| Module-wise count rates for Quadrant A Data is divided into 100 sec bins |
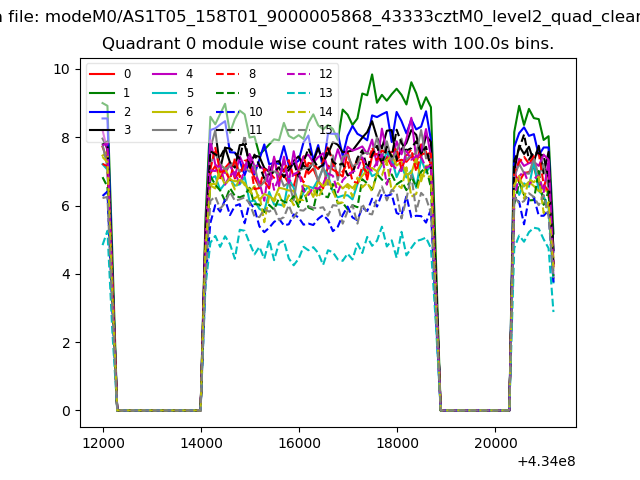 |
 |
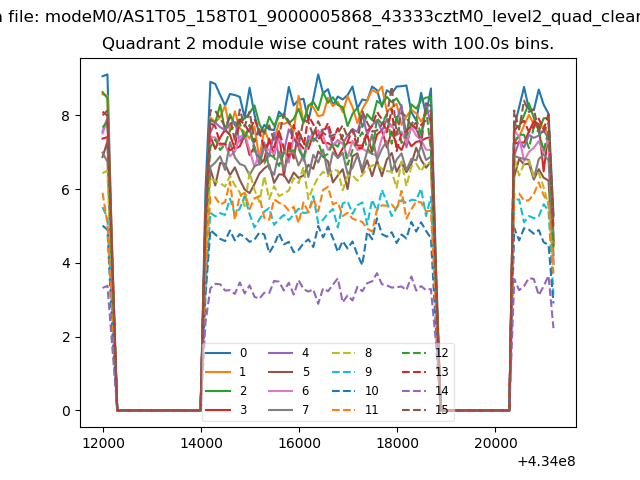
| Module-wise count rates for Quadrant B Data is divided into 100 sec bins |
 |
 |
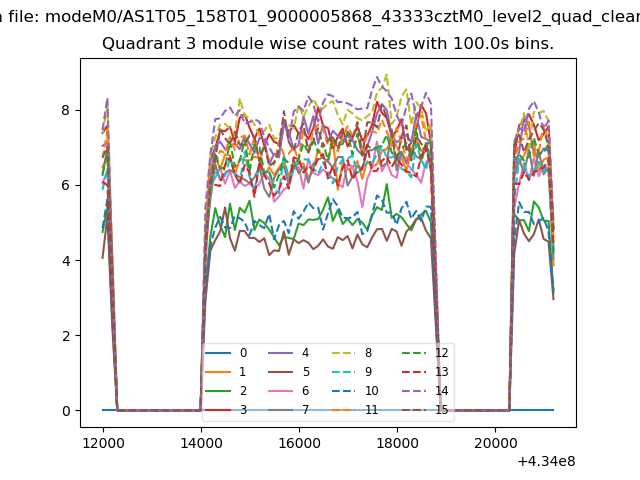
| Module-wise count rates for Quadrant C Data is divided into 100 sec bins |
 |
 |
| Module-wise count rates for Quadrant D Data is divided into 100 sec bins |
 |
 |
| Parameter | Plot |
|---|---|
| CZT HV Monitor | 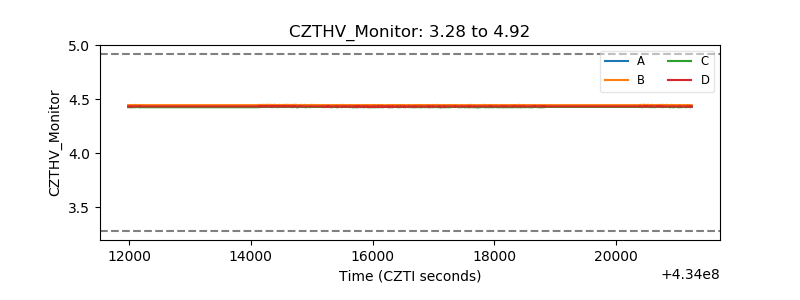 |
| D_VDD | 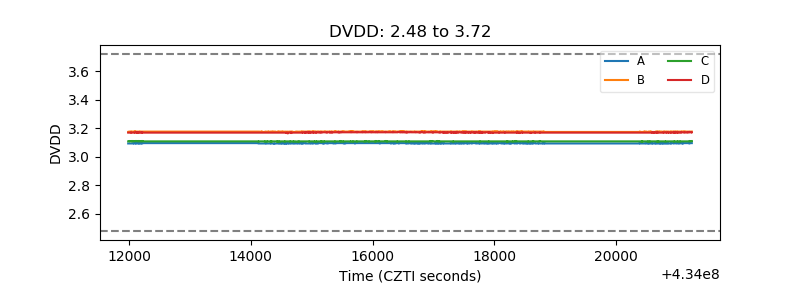 |
| Temperature 1 | 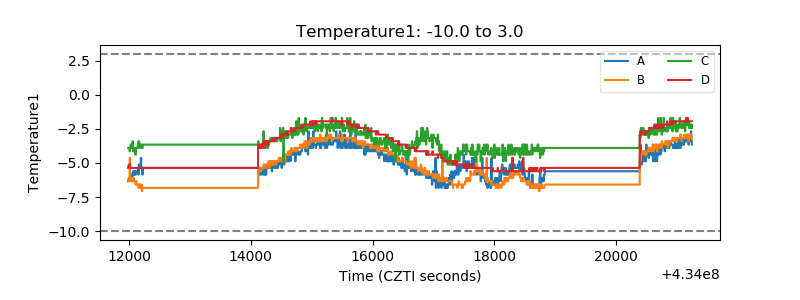 |
| Veto HV Monitor | 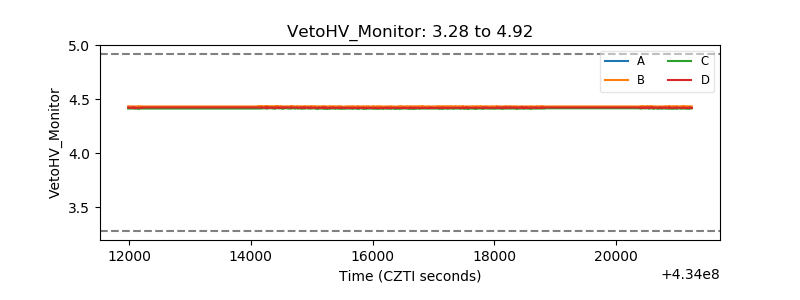 |
| Veto LLD | 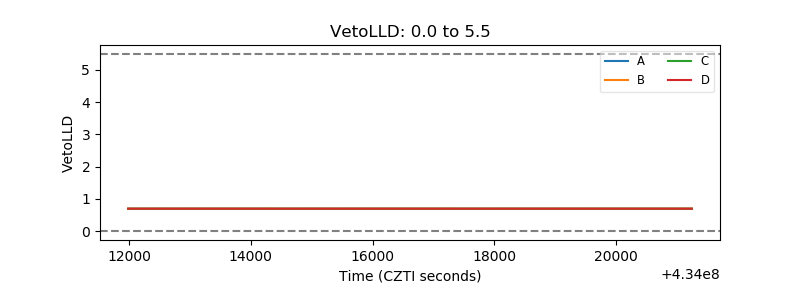 |
| Alpha Counter | 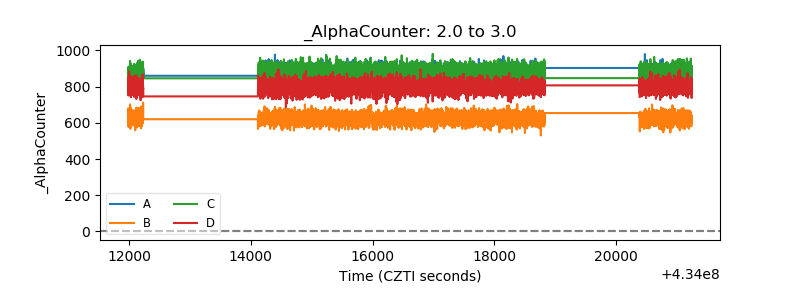 |
| _CPM_Rate | 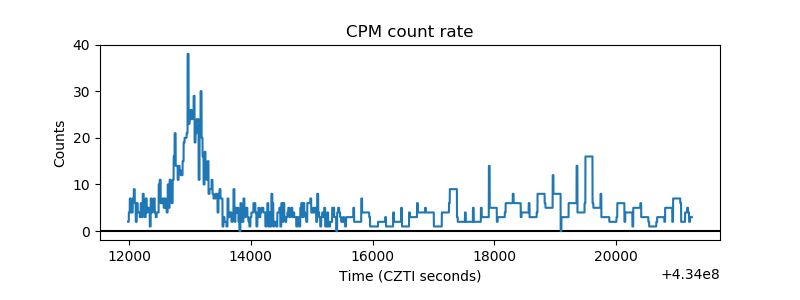 |
| CZT Counter |  |
| +2.5 Volts monitor | 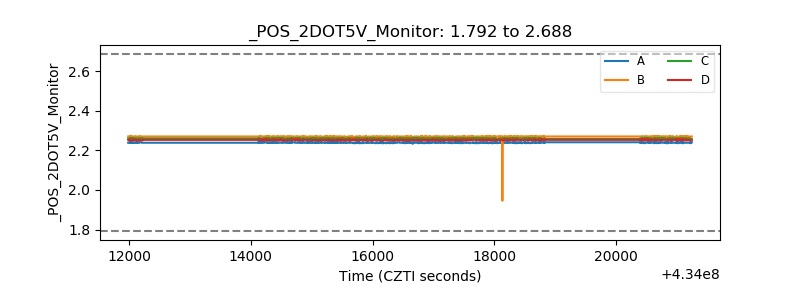 |
| +5 Volts monitor | 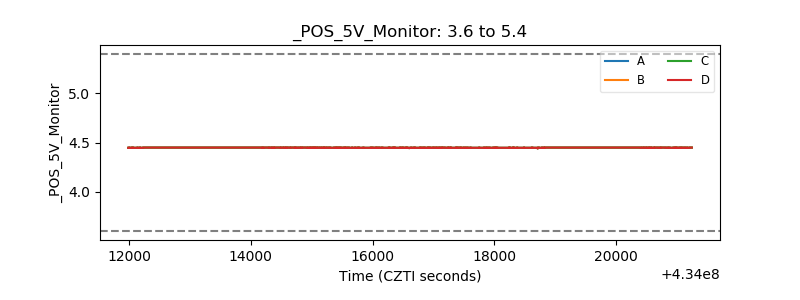 |
| _ROLL_ROT | 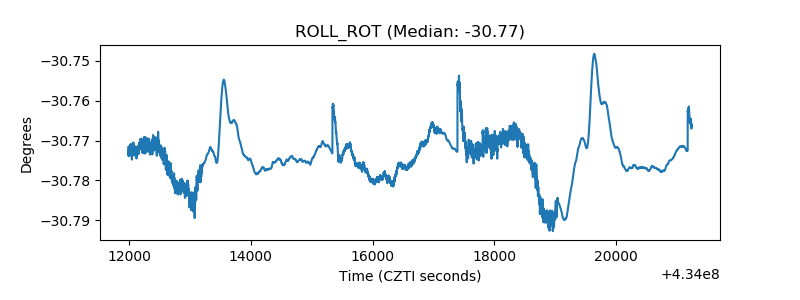 |
| _Roll_DEC | 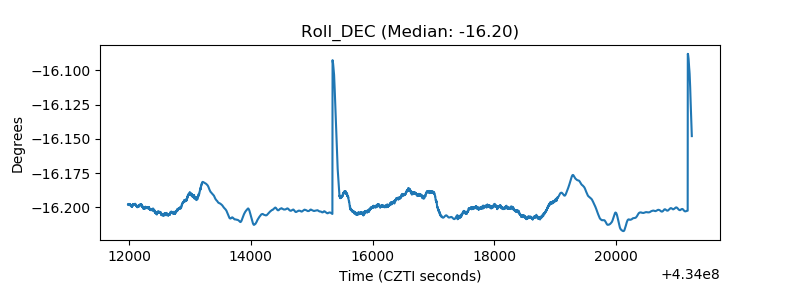 |
| _Roll_RA | 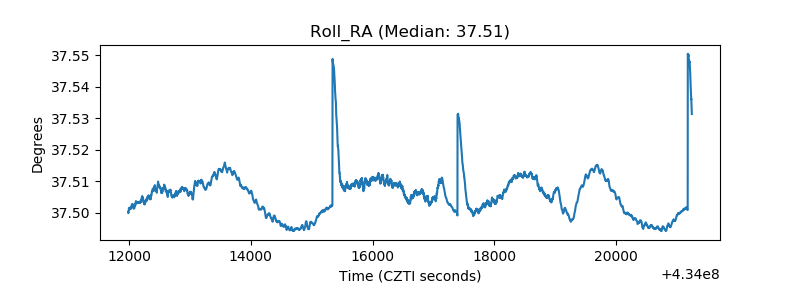 |
| Veto Counter | 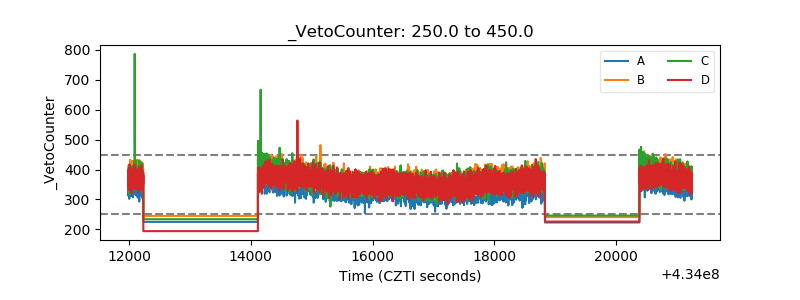 |