| Param | Original file | Final file |
|---|---|---|
| Filename | modeM0/AS1T05_158T01_9000005868_43334cztM0_level2.fits | modeM0/AS1T05_158T01_9000005868_43334cztM0_level2_quad_clean.evt |
| Size (bytes) | 339,431,040 | 93,954,240 |
| Size | 323.7 MB | 89.6 MB |
| Events in quadrant A | 3,452,755 | 619,885 |
| Events in quadrant B | 2,697,836 | 640,899 |
| Events in quadrant C | 2,925,890 | 614,183 |
| Events in quadrant D | 3,036,137 | 564,511 |
| Mode M0 | |||
|---|---|---|---|
| Quadrant | BADHDUFLAG | Total packets | Discarded packets |
| A | 0 | 13758 | 2 |
| B | 0 | 11951 | 2 |
| C | 0 | 12289 | 2 |
| D | 0 | 13190 | 2 |
| Mode M9 | |||
|---|---|---|---|
| Quadrant | BADHDUFLAG | Total packets | Discarded packets |
| A | 0 | 20 | 0 |
| B | 0 | 21 | 0 |
| C | 0 | 21 | 0 |
| D | 0 | 21 | 0 |
| Mode SS | |||
|---|---|---|---|
| Quadrant | BADHDUFLAG | Total packets | Discarded packets |
| A | 0 | 118 | 0 |
| B | 0 | 118 | 0 |
| C | 0 | 118 | 0 |
| D | 0 | 118 | 0 |
| Quadrant | Total seconds | Saturated seconds | Saturation percentage |
|---|---|---|---|
| A | 5801 | 142 | 2.447854% |
| B | 5801 | 20 | 0.344768% |
| C | 5801 | 16 | 0.275815% |
| D | 5801 | 114 | 1.965178% |
Noise dominated data is calculated using 1-second bins in cleaned event files. If a bin has >2000 counts, and if more than 50% of those come from <1% of pixels, then it is considered to be noise-dominated and hence unusable.
| Quadrant | # 1 sec bins | Bins with >0 counts | Bins with >2000 counts | High rate bins dominated by noise | Noise dominated (total time) | Noise dominated (detector-on time) | Marked lightcurve |
|---|---|---|---|---|---|---|---|
| A | 7114 | 5802 | 115 | 115 | 1.62% | 1.98% | 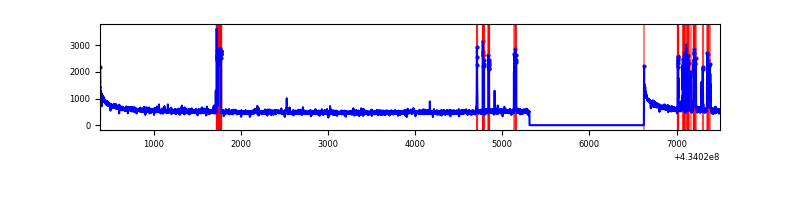 |
| B | 7114 | 5802 | 10 | 10 | 0.14% | 0.17% | 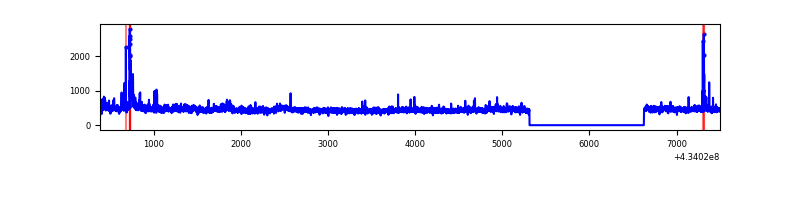 |
| C | 7114 | 5802 | 9 | 9 | 0.13% | 0.16% | 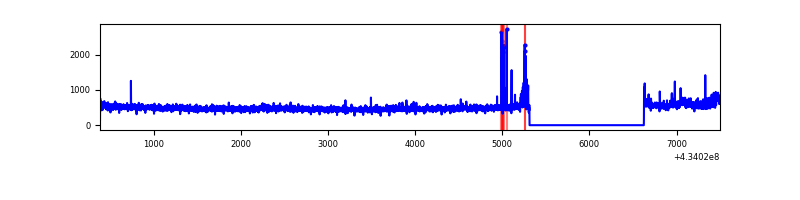 |
| D | 7114 | 5802 | 113 | 113 | 1.59% | 1.95% | 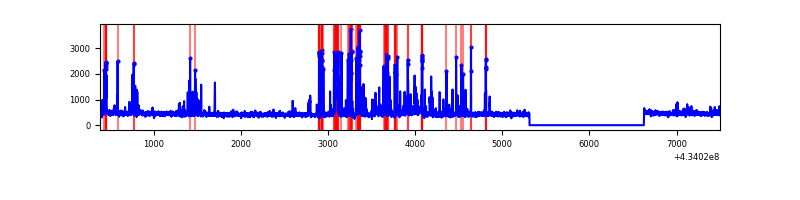 |
Top three noisy pixels from each quadrant. If the there are fewer than three noisy pixels in the level2.evt file, extra rows are filled as -1
| Pixel properties | Quadrant properties | ||||||
|---|---|---|---|---|---|---|---|
| Quadrant | DetID | PixID | Counts | Sigma | Mean | Median | Sigma |
| A | 10 | 83 | 588044 | 4444.52 | 637 | 623 | 132.2 |
| A | 15 | 237 | 392657 | 2966.19 | 637 | 623 | 132.2 |
| A | 12 | 189 | 13656 | 98.61 | 637 | 623 | 132.2 |
| B | 0 | 189 | 116307 | 928.44 | 637 | 617 | 124.6 |
| B | 5 | 172 | 54416 | 431.75 | 637 | 617 | 124.6 |
| B | 15 | 32 | 19122 | 148.51 | 637 | 617 | 124.6 |
| C | 15 | 214 | 244179 | 1627.33 | 631 | 633 | 149.7 |
| C | 3 | 233 | 79459 | 526.7 | 631 | 633 | 149.7 |
| C | 15 | 159 | 73997 | 490.2 | 631 | 633 | 149.7 |
| D | 13 | 249 | 380244 | 2439.96 | 625 | 606 | 155.6 |
| D | 12 | 6 | 132063 | 844.88 | 625 | 606 | 155.6 |
| D | 2 | 249 | 74639 | 475.82 | 625 | 606 | 155.6 |
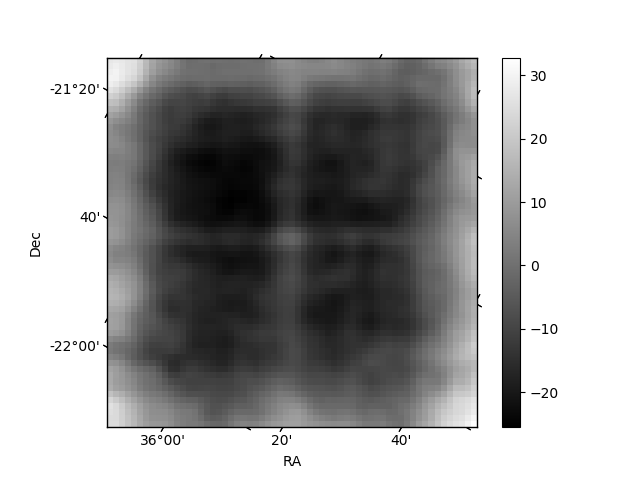
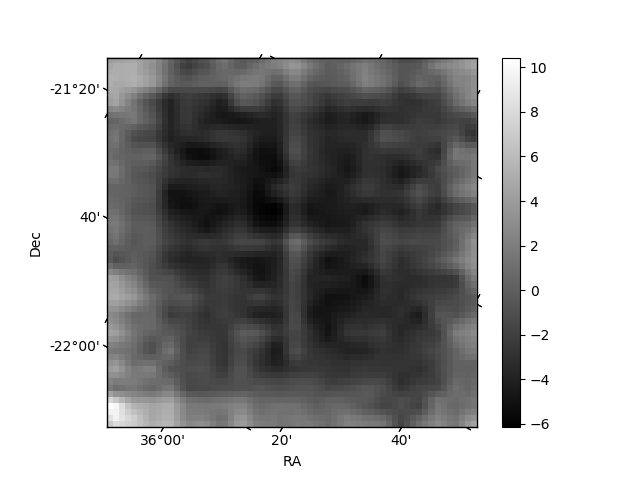
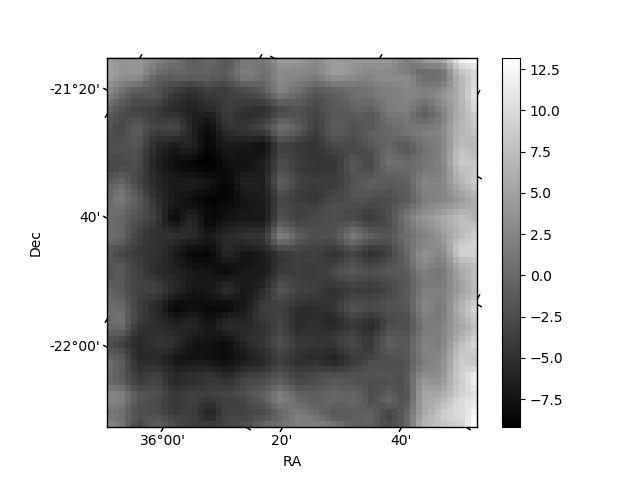
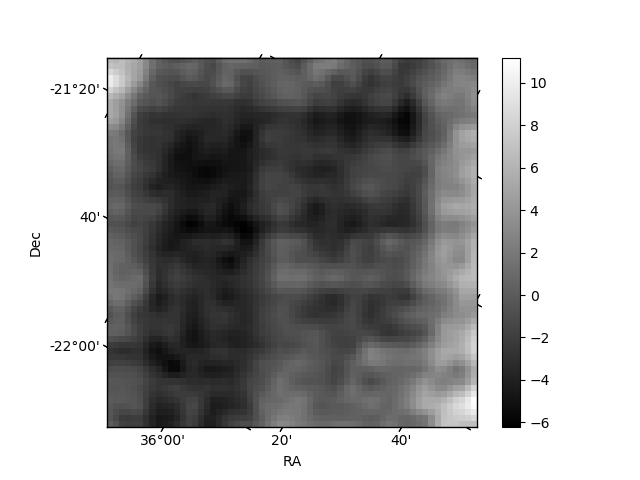
Histogram calculated using DETX and DETY for each event in the final _common_clean file
| Quadrant A | 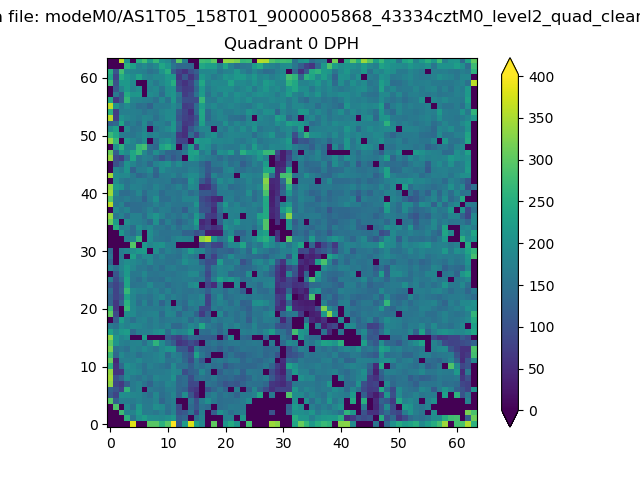 |
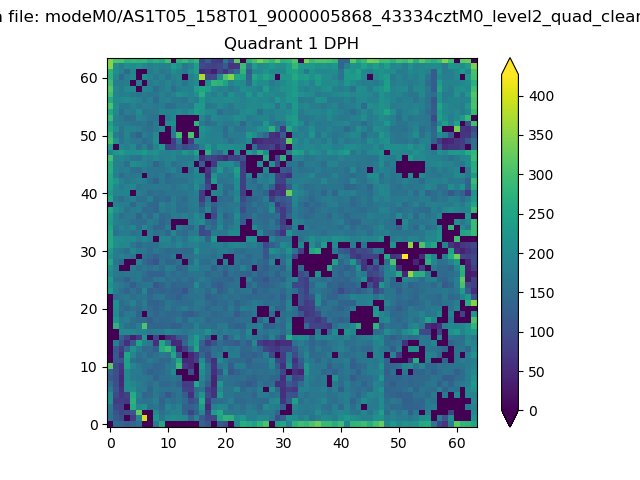 |
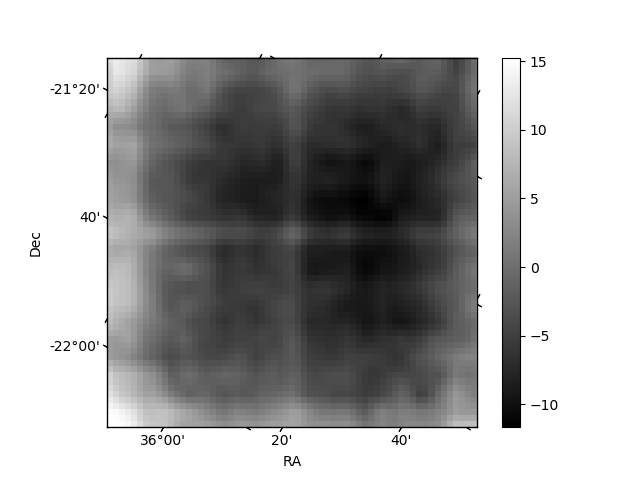
Quadrant B |
|---|---|---|---|
| Quadrant D | 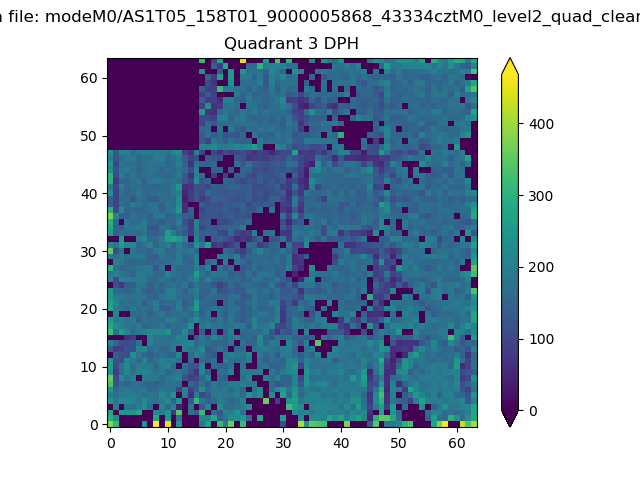 |
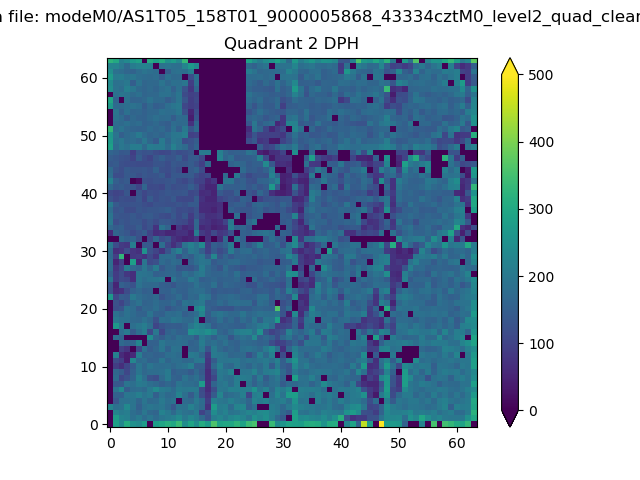 |
Quadrant C |
| Plot type | Count rate plots | Images |
|---|---|---|
| Comparison with Poisson distribution Blue bars denote a histogram of data divided into 1 sec bins. Red curve is a Poisson curve with rate = median count rate of data. |
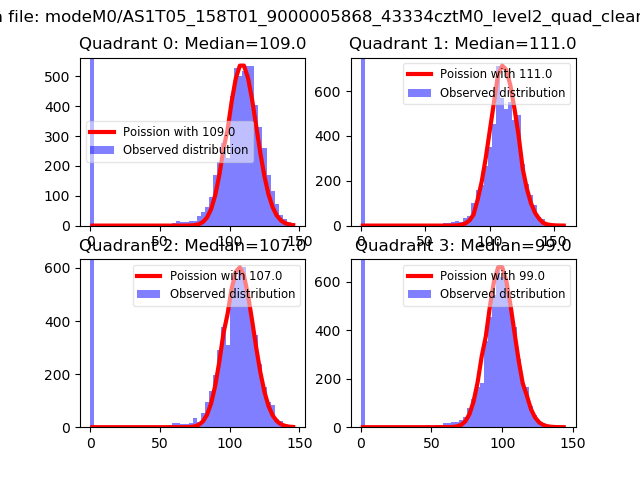 |
 |
| Quadrant-wise count rates Data is divided into 100 sec bins |
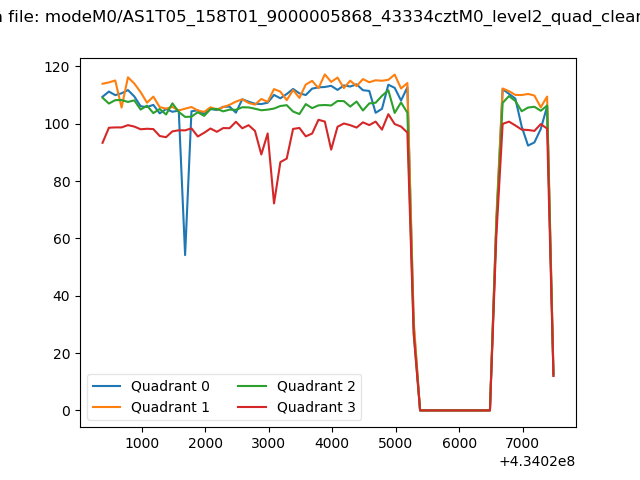 |
|
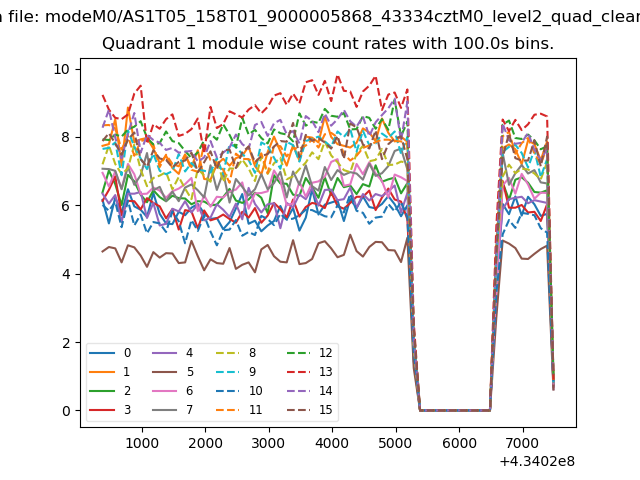
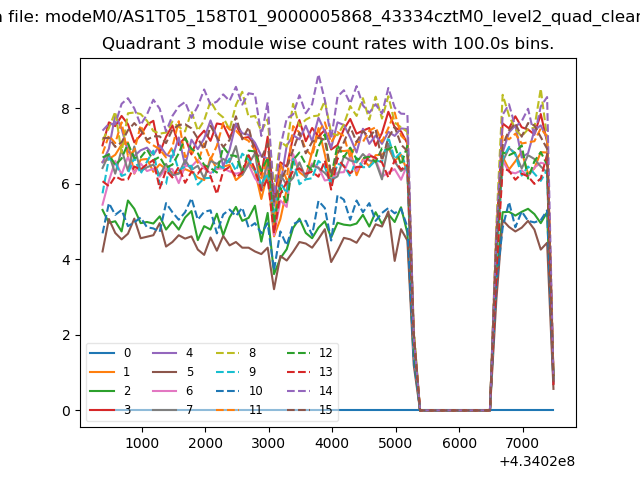
| Module-wise count rates for Quadrant A Data is divided into 100 sec bins |
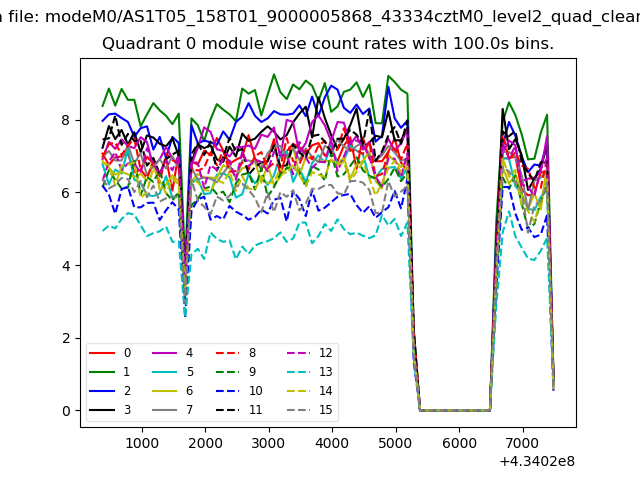 |
 |
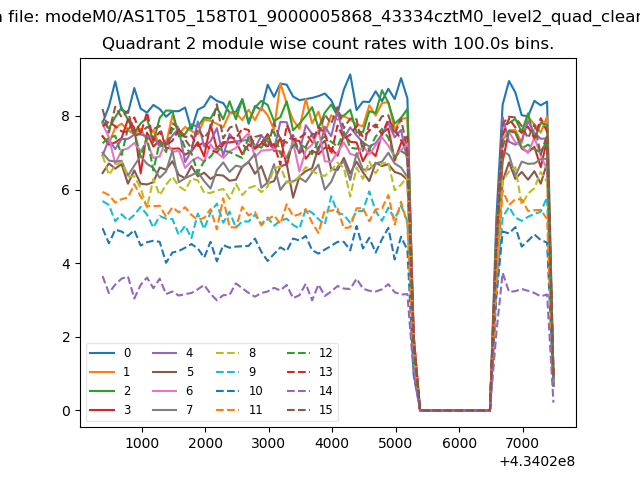
| Module-wise count rates for Quadrant B Data is divided into 100 sec bins |
 |
 |
| Module-wise count rates for Quadrant C Data is divided into 100 sec bins |
 |
 |
| Module-wise count rates for Quadrant D Data is divided into 100 sec bins |
 |
 |
| Parameter | Plot |
|---|---|
| CZT HV Monitor | 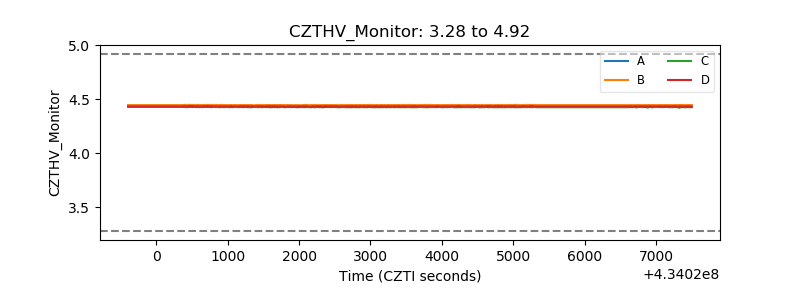 |
| D_VDD | 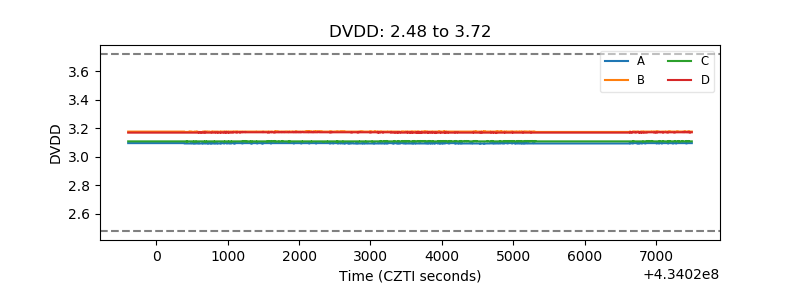 |
| Temperature 1 | 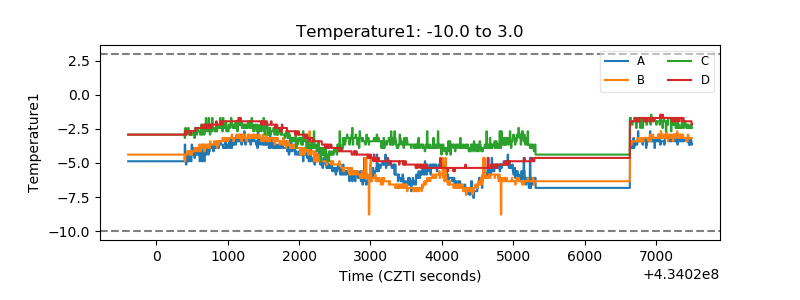 |
| Veto HV Monitor | 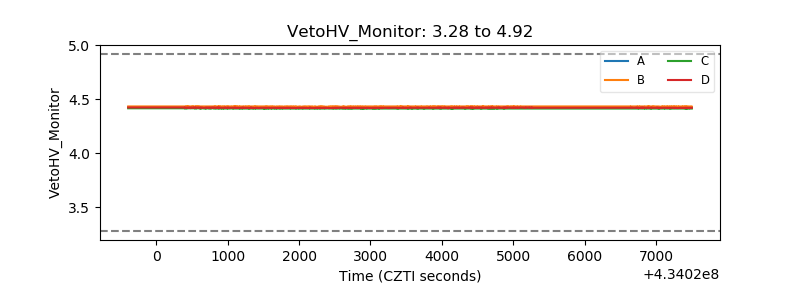 |
| Veto LLD | 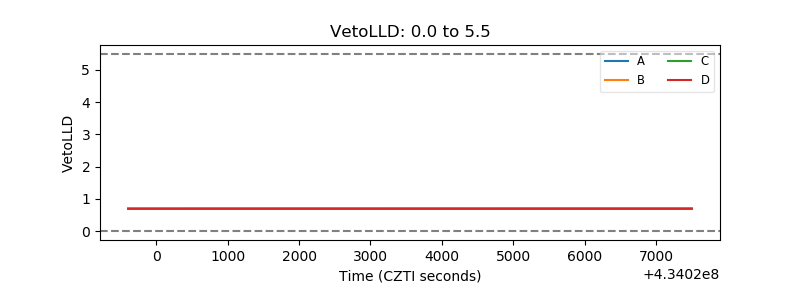 |
| Alpha Counter | 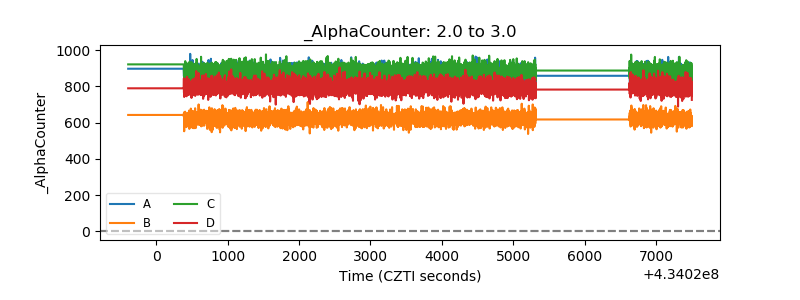 |
| _CPM_Rate | 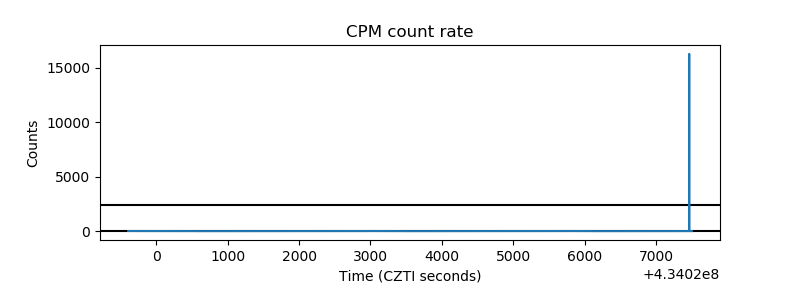 |
| CZT Counter | 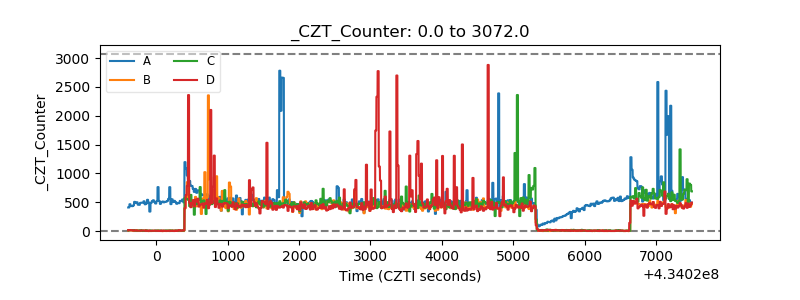 |
| +2.5 Volts monitor | 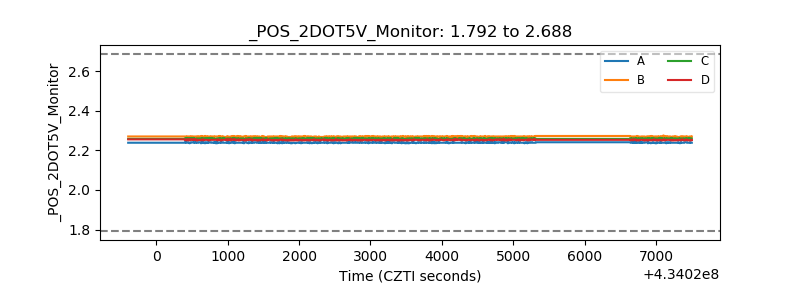 |
| +5 Volts monitor | 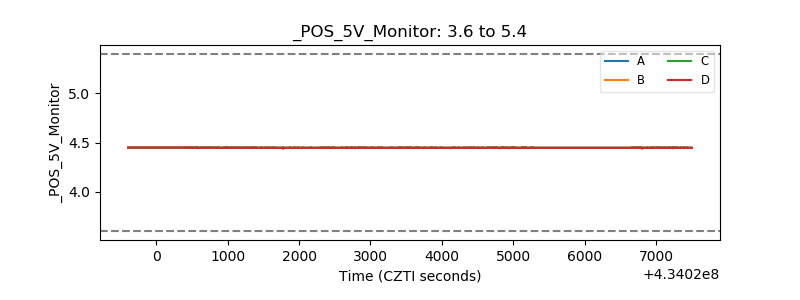 |
| _ROLL_ROT | 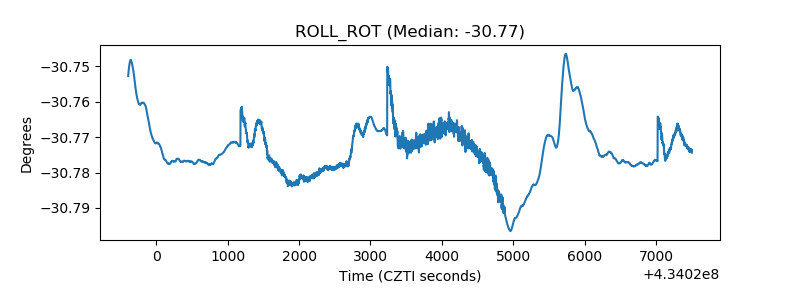 |
| _Roll_DEC |  |
| _Roll_RA | 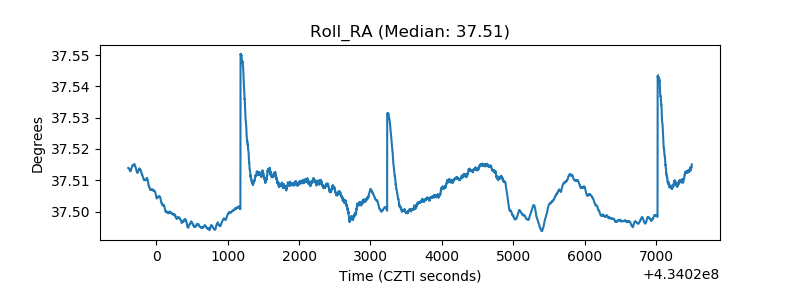 |
| Veto Counter | 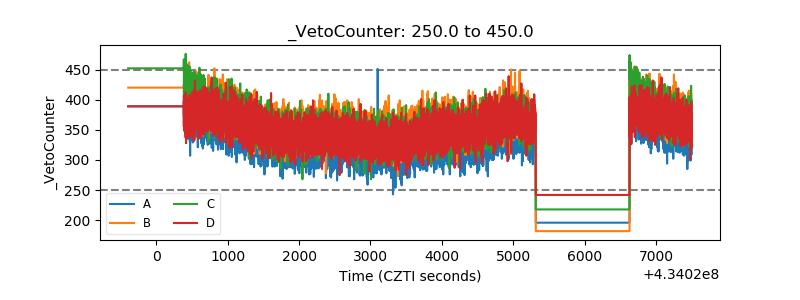 |