| Param | Original file | Final file |
|---|---|---|
| Filename | modeM0/AS1T05_158T01_9000005868_43339cztM0_level2.fits | modeM0/AS1T05_158T01_9000005868_43339cztM0_level2_quad_clean.evt |
| Size (bytes) | 1,132,047,360 | 322,038,720 |
| Size | 1.1 GB | 307.1 MB |
| Events in quadrant A | 11,642,443 | 2,138,437 |
| Events in quadrant B | 9,019,859 | 2,201,071 |
| Events in quadrant C | 9,906,652 | 2,097,677 |
| Events in quadrant D | 9,777,334 | 1,927,614 |
| Mode M0 | |||
|---|---|---|---|
| Quadrant | BADHDUFLAG | Total packets | Discarded packets |
| A | 0 | 46913 | 4 |
| B | 0 | 40928 | 5 |
| C | 0 | 41997 | 4 |
| D | 0 | 44231 | 4 |
| Mode M9 | |||
|---|---|---|---|
| Quadrant | BADHDUFLAG | Total packets | Discarded packets |
| A | 0 | 69 | 0 |
| B | 0 | 69 | 0 |
| C | 0 | 69 | 0 |
| D | 0 | 69 | 0 |
| Mode SS | |||
|---|---|---|---|
| Quadrant | BADHDUFLAG | Total packets | Discarded packets |
| A | 0 | 414 | 0 |
| B | 0 | 414 | 0 |
| C | 0 | 414 | 0 |
| D | 0 | 414 | 0 |
| Quadrant | Total seconds | Saturated seconds | Saturation percentage |
|---|---|---|---|
| A | 20113 | 367 | 1.824690% |
| B | 20113 | 31 | 0.154129% |
| C | 20113 | 33 | 0.164073% |
| D | 20113 | 241 | 1.198230% |
Noise dominated data is calculated using 1-second bins in cleaned event files. If a bin has >2000 counts, and if more than 50% of those come from <1% of pixels, then it is considered to be noise-dominated and hence unusable.
| Quadrant | # 1 sec bins | Bins with >0 counts | Bins with >2000 counts | High rate bins dominated by noise | Noise dominated (total time) | Noise dominated (detector-on time) | Marked lightcurve |
|---|---|---|---|---|---|---|---|
| A | 27038 | 20118 | 264 | 264 | 0.98% | 1.31% | 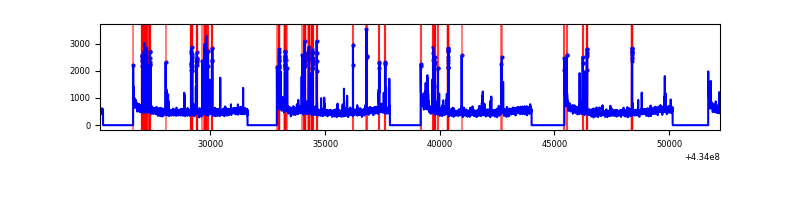 |
| B | 27038 | 20118 | 5 | 5 | 0.02% | 0.02% | 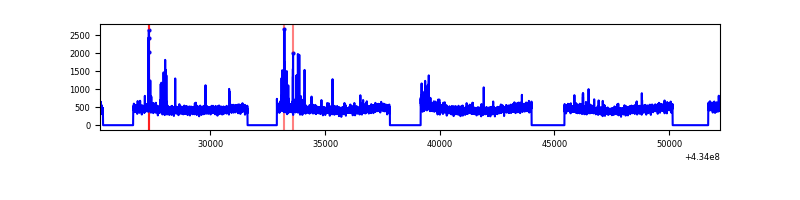 |
| C | 27038 | 20118 | 19 | 19 | 0.07% | 0.09% | 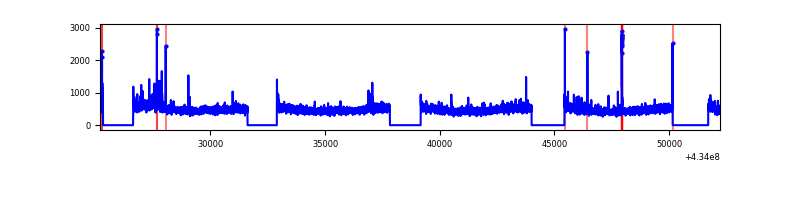 |
| D | 27038 | 20118 | 213 | 213 | 0.79% | 1.06% | 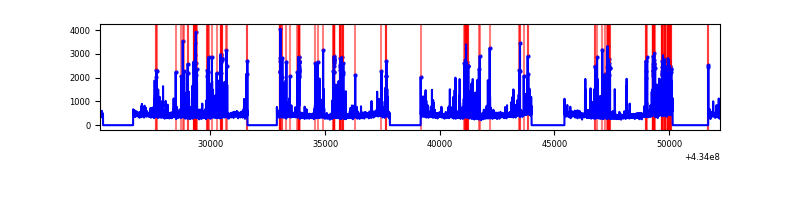 |
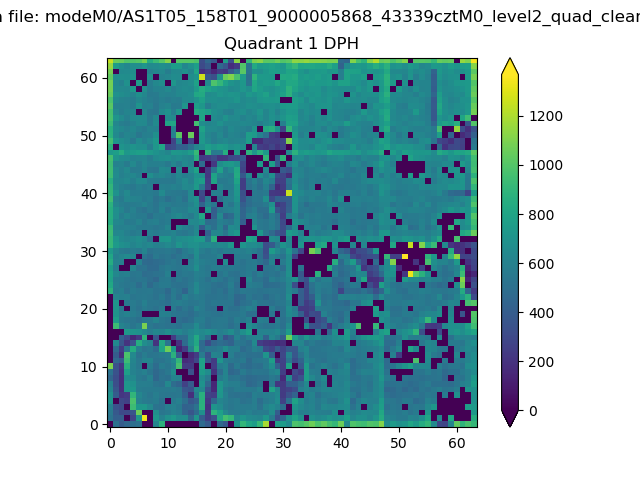
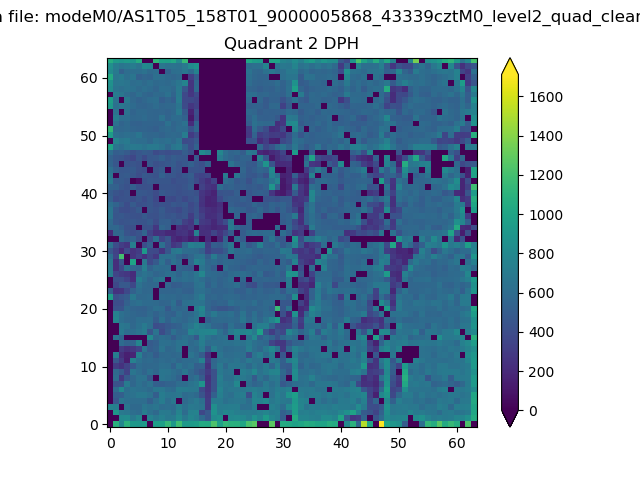
Top three noisy pixels from each quadrant. If the there are fewer than three noisy pixels in the level2.evt file, extra rows are filled as -1
| Pixel properties | Quadrant properties | ||||||
|---|---|---|---|---|---|---|---|
| Quadrant | DetID | PixID | Counts | Sigma | Mean | Median | Sigma |
| A | 10 | 83 | 1819169 | 4013.56 | 2205 | 2158 | 452.7 |
| A | 15 | 237 | 1283595 | 2830.54 | 2205 | 2158 | 452.7 |
| A | 3 | 137 | 25254 | 51.02 | 2205 | 2158 | 452.7 |
| B | 0 | 189 | 177126 | 404.83 | 2202 | 2135 | 432.3 |
| B | 15 | 32 | 131403 | 299.05 | 2202 | 2135 | 432.3 |
| B | 12 | 111 | 56073 | 124.78 | 2202 | 2135 | 432.3 |
| C | 15 | 214 | 823494 | 1619.48 | 2171 | 2185 | 507.1 |
| C | 3 | 233 | 307675 | 602.37 | 2171 | 2185 | 507.1 |
| C | 15 | 159 | 163816 | 318.71 | 2171 | 2185 | 507.1 |
| D | 13 | 249 | 685455 | 1293.9 | 2153 | 2094 | 528.1 |
| D | 2 | 249 | 471307 | 888.43 | 2153 | 2094 | 528.1 |
| D | 12 | 6 | 301506 | 566.92 | 2153 | 2094 | 528.1 |
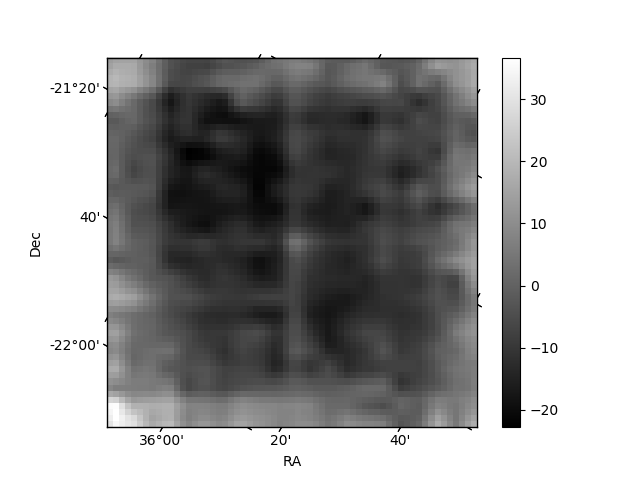
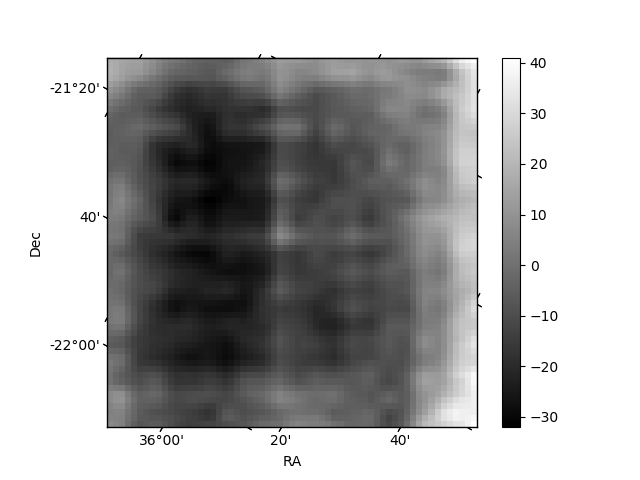
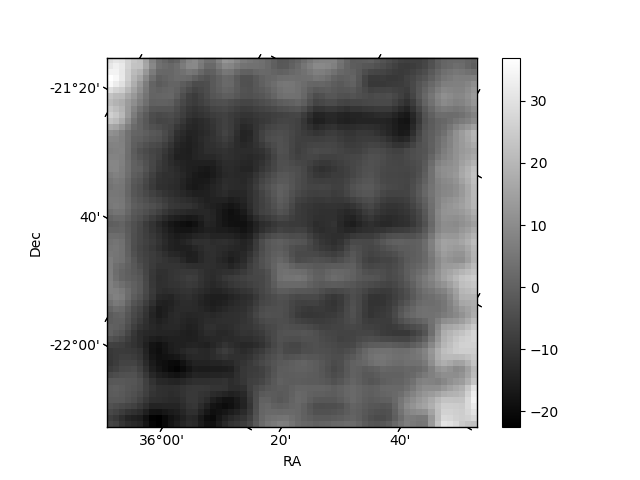
Histogram calculated using DETX and DETY for each event in the final _common_clean file
| Quadrant A | 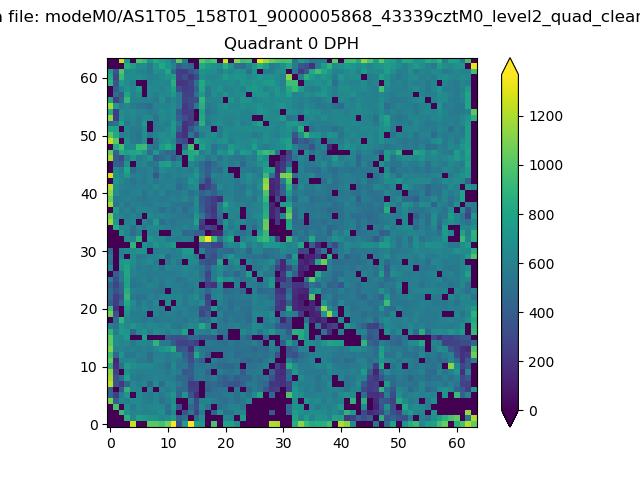 |
 |
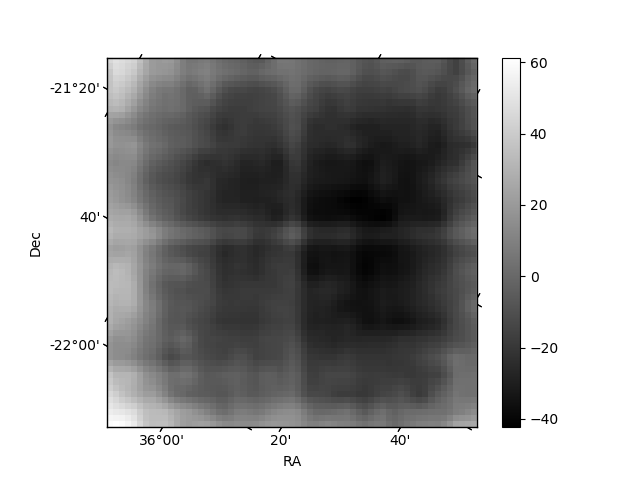
Quadrant B |
|---|---|---|---|
| Quadrant D | 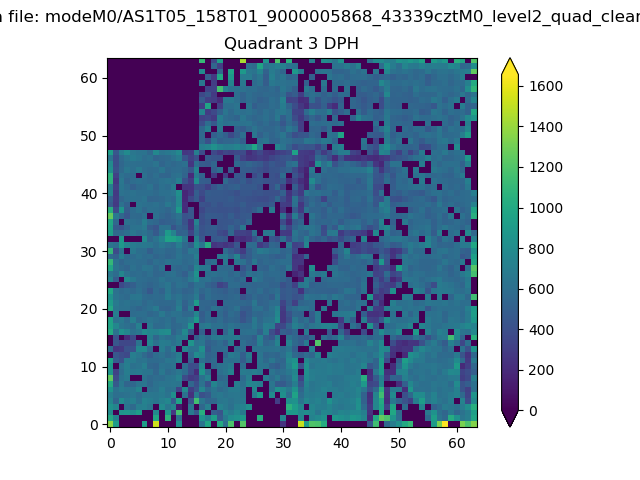 |
 |
Quadrant C |
| Plot type | Count rate plots | Images |
|---|---|---|
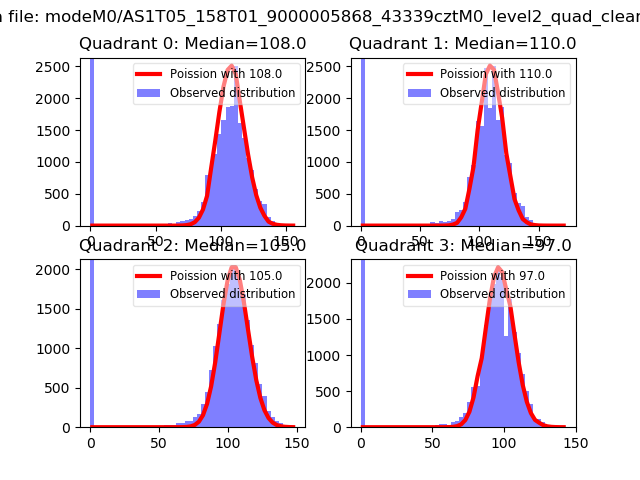
| Comparison with Poisson distribution Blue bars denote a histogram of data divided into 1 sec bins. Red curve is a Poisson curve with rate = median count rate of data. |
 |
 |
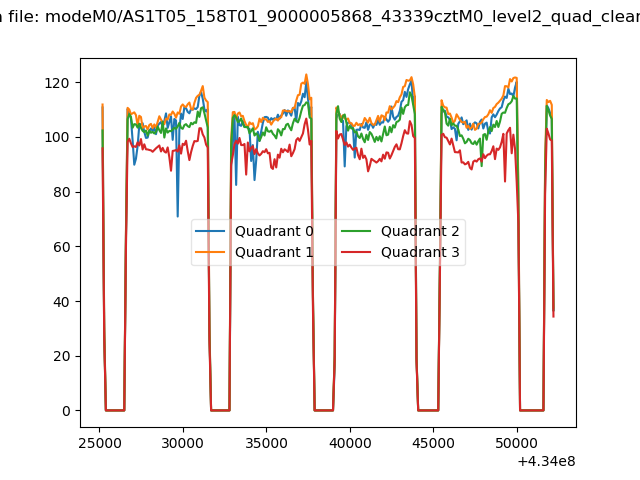
| Quadrant-wise count rates Data is divided into 100 sec bins |
 |
|
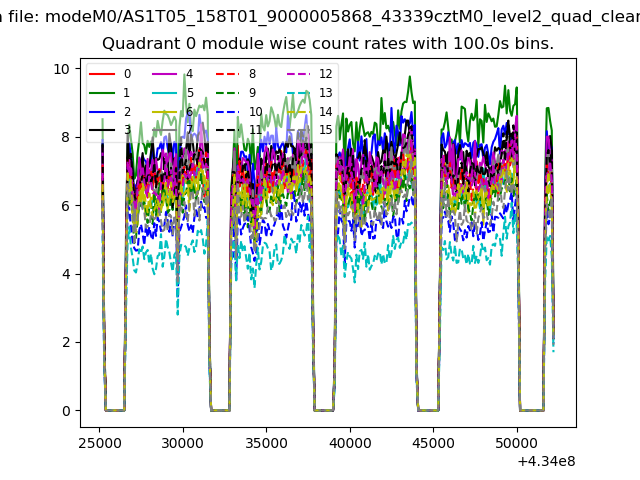
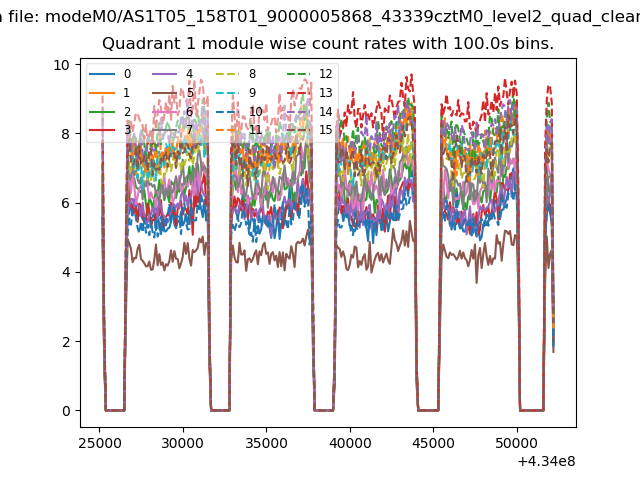
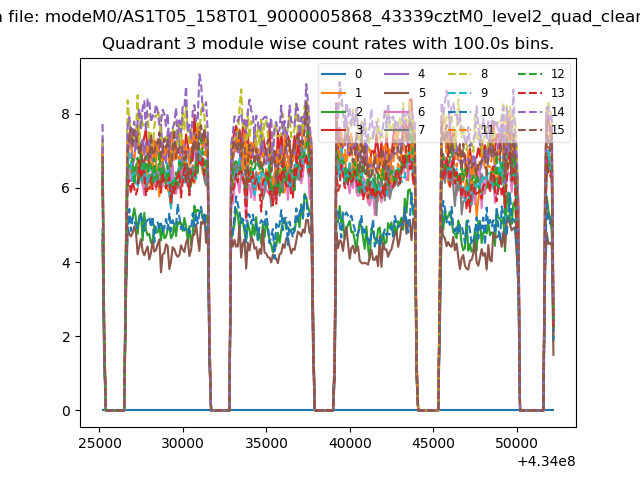
| Module-wise count rates for Quadrant A Data is divided into 100 sec bins |
 |
 |
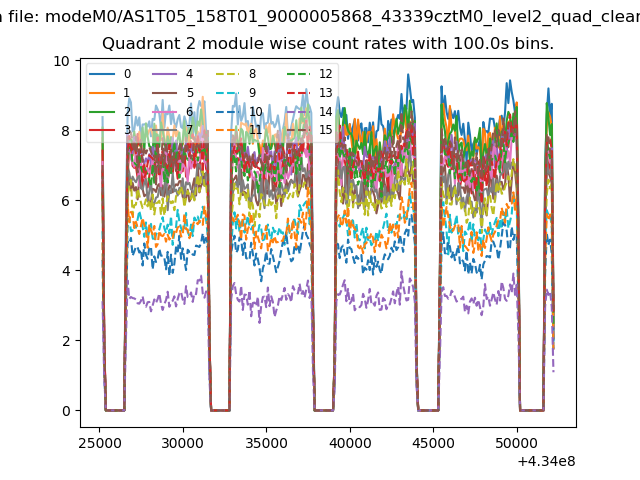
| Module-wise count rates for Quadrant B Data is divided into 100 sec bins |
 |
 |
| Module-wise count rates for Quadrant C Data is divided into 100 sec bins |
 |
 |
| Module-wise count rates for Quadrant D Data is divided into 100 sec bins |
 |
 |
| Parameter | Plot |
|---|---|
| CZT HV Monitor | 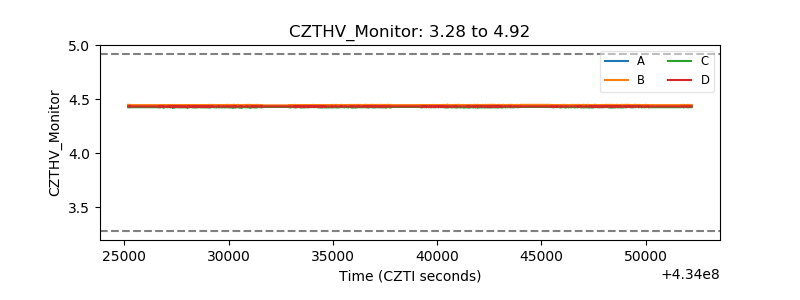 |
| D_VDD | 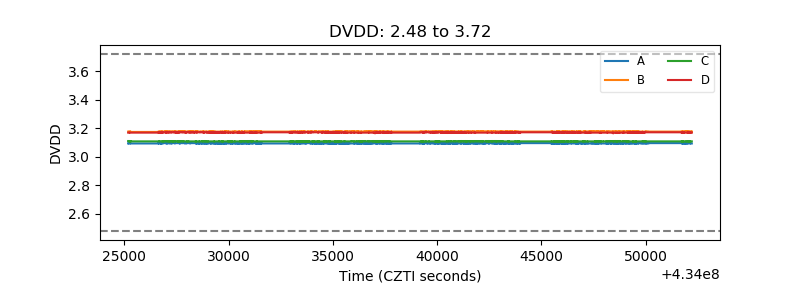 |
| Temperature 1 | 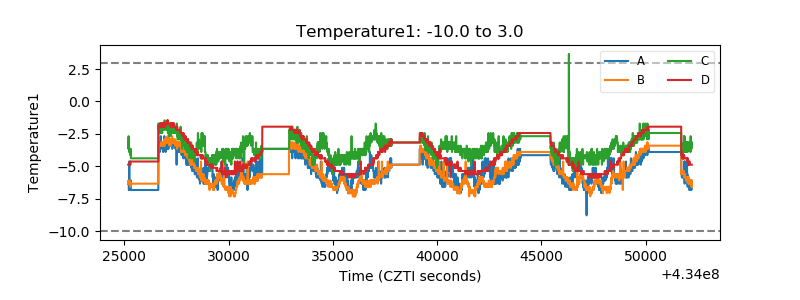 |
| Veto HV Monitor |  |
| Veto LLD | 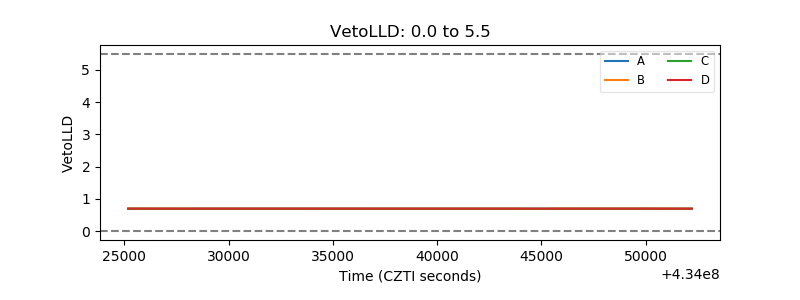 |
| Alpha Counter | 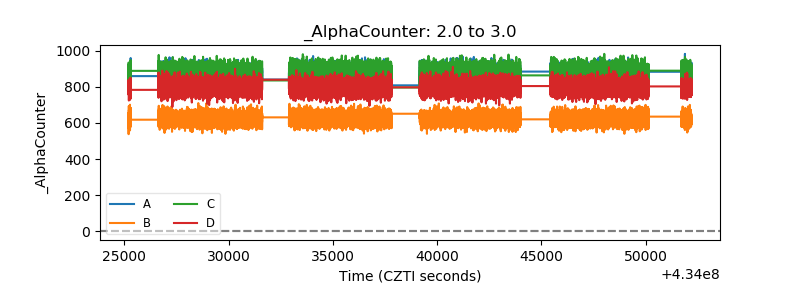 |
| _CPM_Rate | 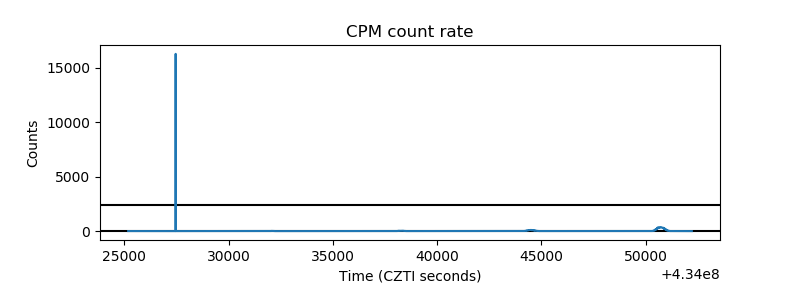 |
| CZT Counter | 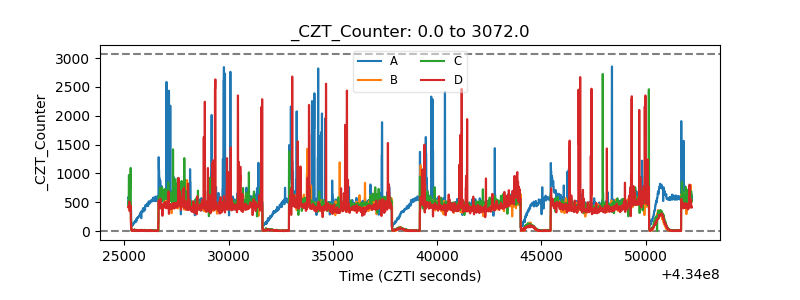 |
| +2.5 Volts monitor | 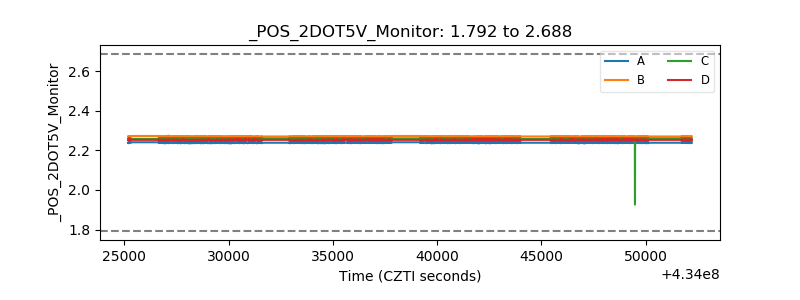 |
| +5 Volts monitor | 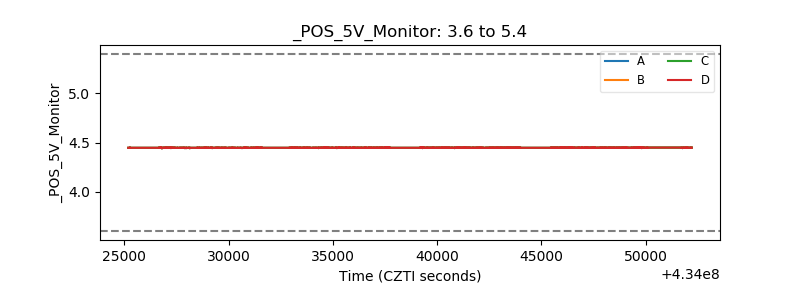 |
| _ROLL_ROT | 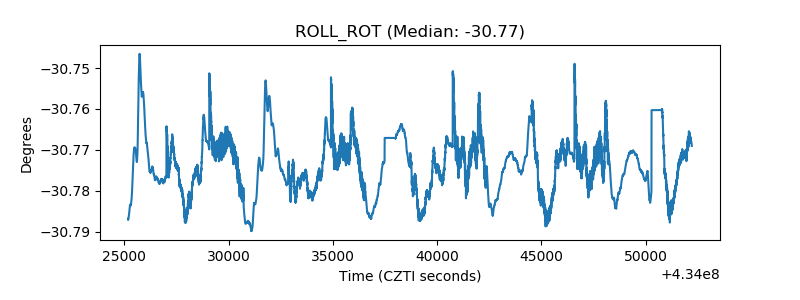 |
| _Roll_DEC | 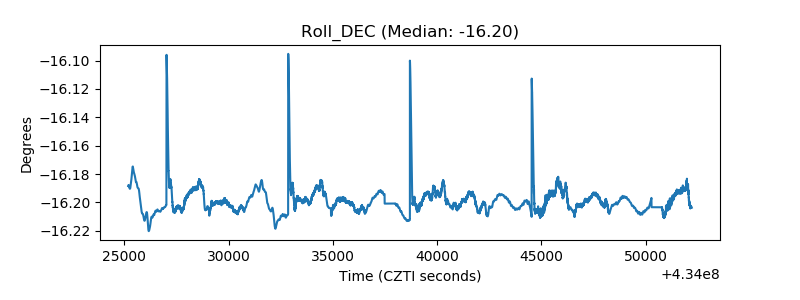 |
| _Roll_RA | 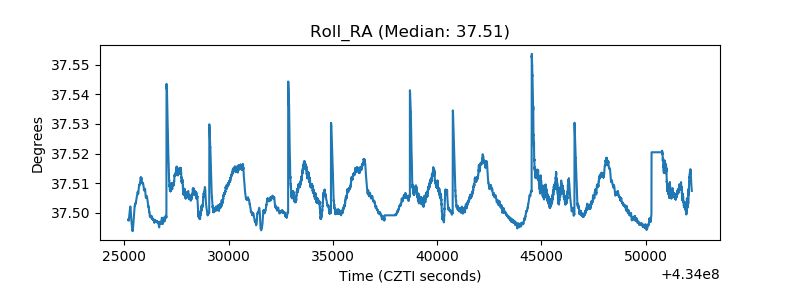 |
| Veto Counter | 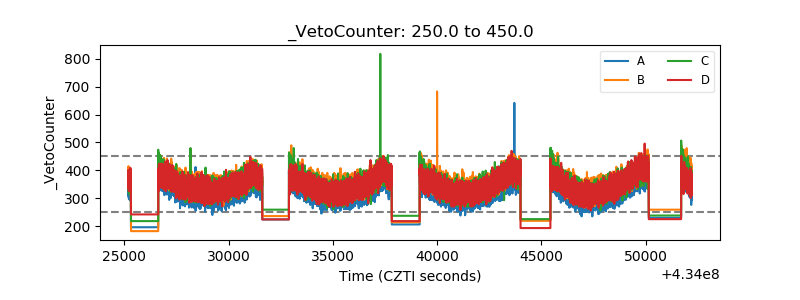 |