| Param | Original file | Final file |
|---|---|---|
| Filename | modeM0/AS1T05_158T01_9000005868_43341cztM0_level2.fits | modeM0/AS1T05_158T01_9000005868_43341cztM0_level2_quad_clean.evt |
| Size (bytes) | 559,802,880 | 170,098,560 |
| Size | 533.9 MB | 162.2 MB |
| Events in quadrant A | 5,682,761 | 1,145,695 |
| Events in quadrant B | 4,528,456 | 1,179,907 |
| Events in quadrant C | 4,829,005 | 1,109,475 |
| Events in quadrant D | 4,889,981 | 1,010,050 |
| Mode M0 | |||
|---|---|---|---|
| Quadrant | BADHDUFLAG | Total packets | Discarded packets |
| A | 0 | 23126 | 2 |
| B | 0 | 20604 | 2 |
| C | 0 | 20703 | 2 |
| D | 0 | 22228 | 2 |
| Mode M9 | |||
|---|---|---|---|
| Quadrant | BADHDUFLAG | Total packets | Discarded packets |
| A | 0 | 48 | 0 |
| B | 0 | 49 | 0 |
| C | 0 | 49 | 0 |
| D | 0 | 49 | 0 |
| Mode SS | |||
|---|---|---|---|
| Quadrant | BADHDUFLAG | Total packets | Discarded packets |
| A | 0 | 204 | 0 |
| B | 0 | 204 | 0 |
| C | 0 | 204 | 0 |
| D | 0 | 204 | 0 |
| Quadrant | Total seconds | Saturated seconds | Saturation percentage |
|---|---|---|---|
| A | 10195 | 90 | 0.882786% |
| B | 10195 | 11 | 0.107896% |
| C | 10195 | 9 | 0.088279% |
| D | 10195 | 137 | 1.343796% |
Noise dominated data is calculated using 1-second bins in cleaned event files. If a bin has >2000 counts, and if more than 50% of those come from <1% of pixels, then it is considered to be noise-dominated and hence unusable.
| Quadrant | # 1 sec bins | Bins with >0 counts | Bins with >2000 counts | High rate bins dominated by noise | Noise dominated (total time) | Noise dominated (detector-on time) | Marked lightcurve |
|---|---|---|---|---|---|---|---|
| A | 13691 | 10197 | 56 | 56 | 0.41% | 0.55% | 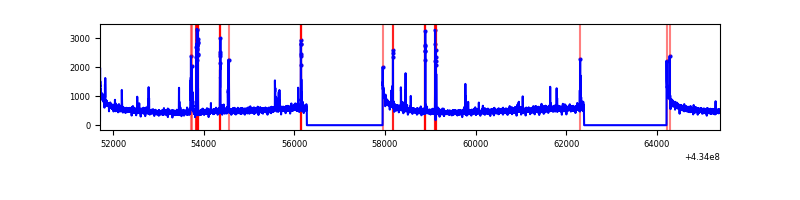 |
| B | 13691 | 10197 | 1 | 1 | 0.01% | 0.01% | 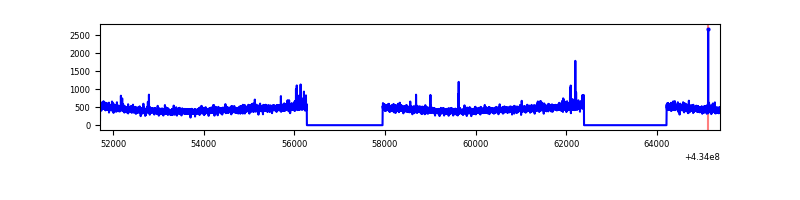 |
| C | 13691 | 10197 | 2 | 2 | 0.01% | 0.02% | 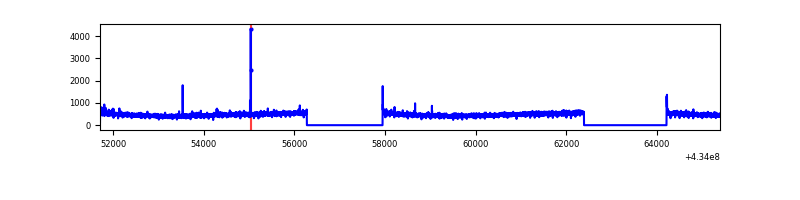 |
| D | 13691 | 10197 | 118 | 118 | 0.86% | 1.16% | 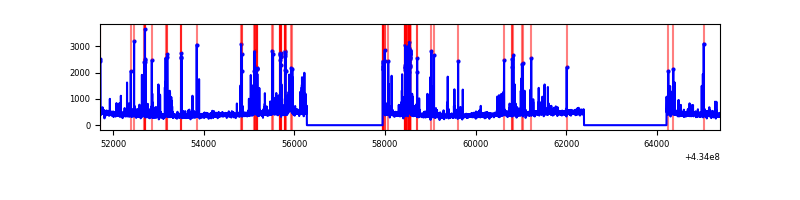 |
Top three noisy pixels from each quadrant. If the there are fewer than three noisy pixels in the level2.evt file, extra rows are filled as -1
| Pixel properties | Quadrant properties | ||||||
|---|---|---|---|---|---|---|---|
| Quadrant | DetID | PixID | Counts | Sigma | Mean | Median | Sigma |
| A | 10 | 83 | 972582 | 4230.48 | 1126 | 1103 | 229.6 |
| A | 15 | 237 | 336128 | 1458.93 | 1126 | 1103 | 229.6 |
| A | 3 | 137 | 12712 | 50.55 | 1126 | 1103 | 229.6 |
| B | 0 | 189 | 55278 | 248.75 | 1123 | 1090 | 217.8 |
| B | 12 | 111 | 28558 | 126.09 | 1123 | 1090 | 217.8 |
| B | 11 | 111 | 26268 | 115.58 | 1123 | 1090 | 217.8 |
| C | 15 | 214 | 420928 | 1611.34 | 1108 | 1116 | 260.5 |
| C | 3 | 233 | 56090 | 211.0 | 1108 | 1116 | 260.5 |
| C | 14 | 254 | 22129 | 80.65 | 1108 | 1116 | 260.5 |
| D | 13 | 249 | 308008 | 1142.4 | 1090 | 1058 | 268.7 |
| D | 2 | 249 | 258198 | 957.02 | 1090 | 1058 | 268.7 |
| D | 12 | 6 | 118106 | 435.63 | 1090 | 1058 | 268.7 |
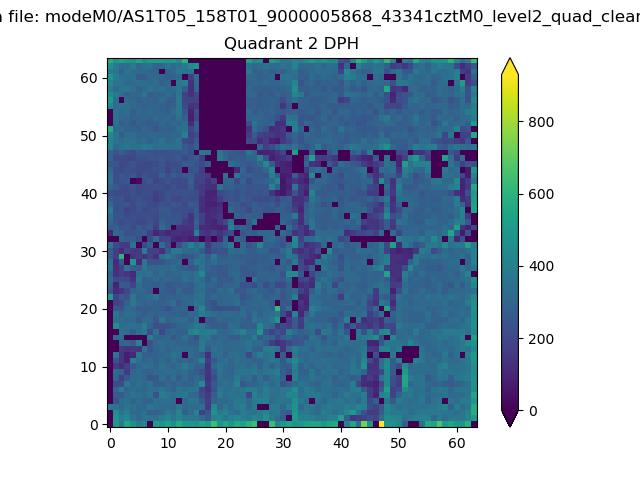
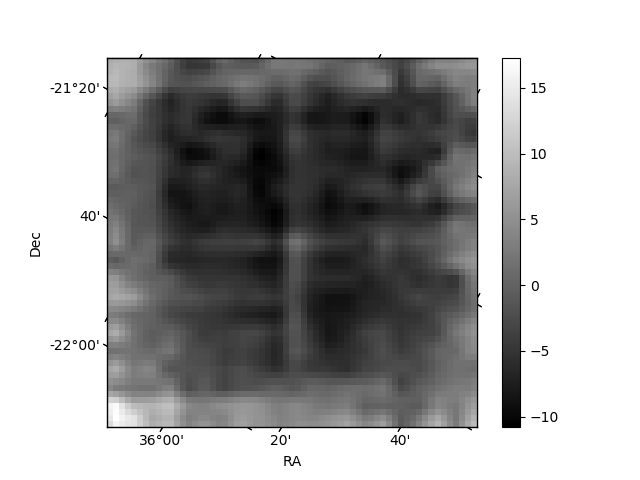
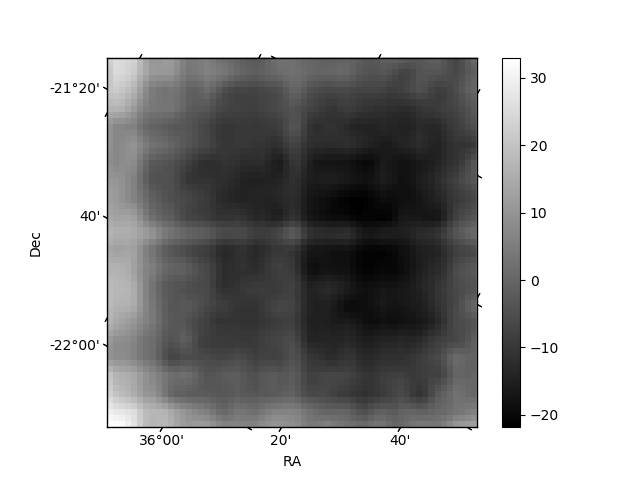
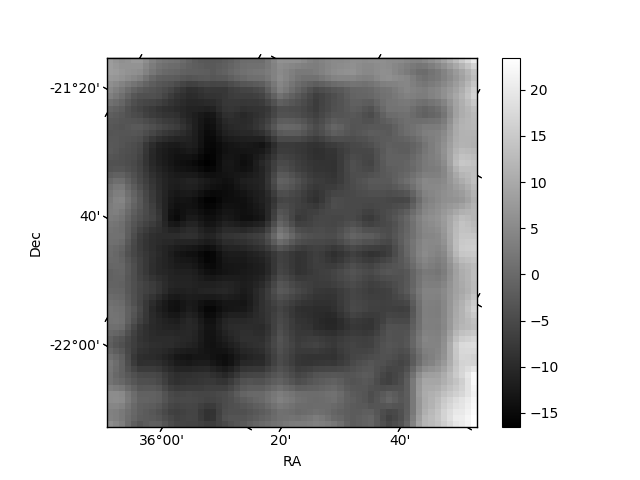
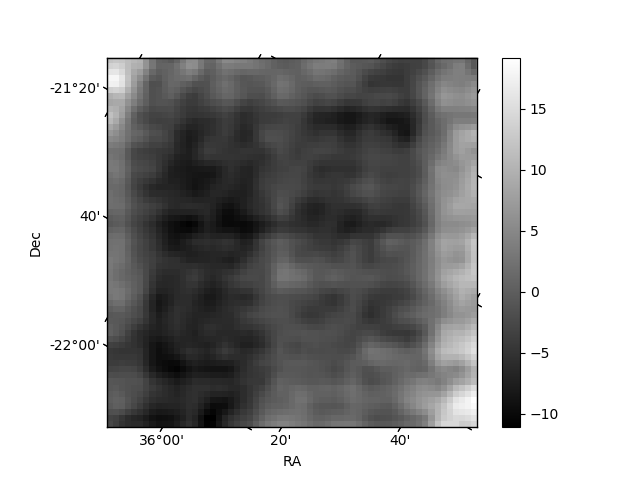
Histogram calculated using DETX and DETY for each event in the final _common_clean file
| Quadrant A | 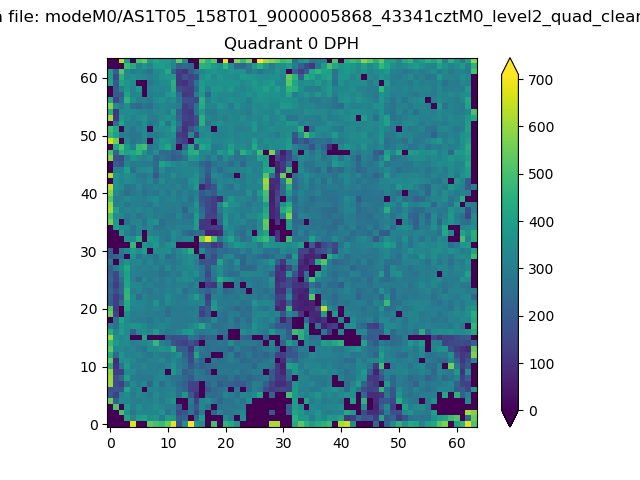 |
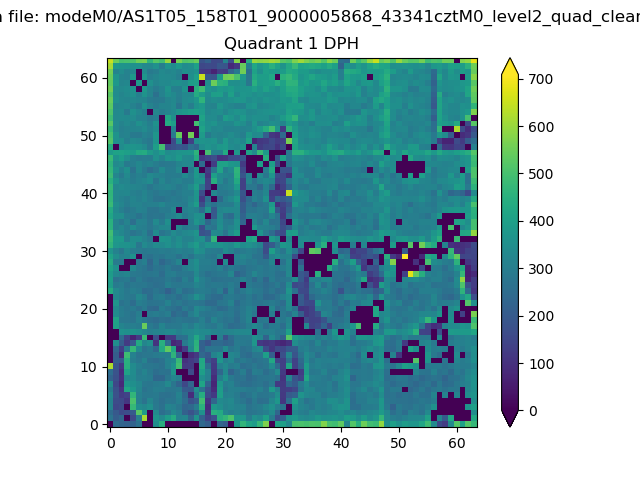 |
Quadrant B |
|---|---|---|---|
| Quadrant D | 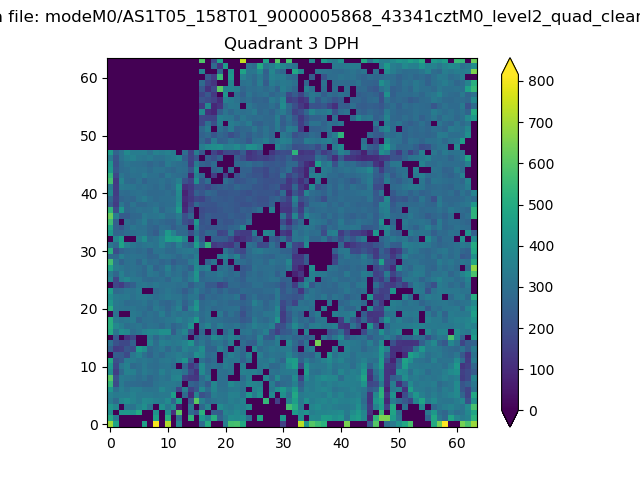 |
 |
Quadrant C |
| Plot type | Count rate plots | Images |
|---|---|---|
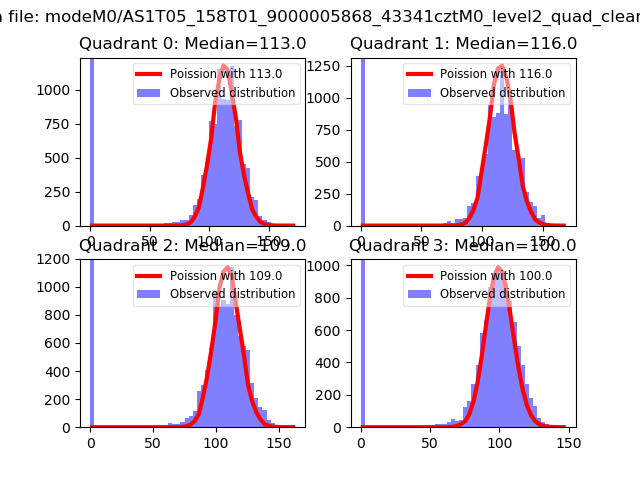
| Comparison with Poisson distribution Blue bars denote a histogram of data divided into 1 sec bins. Red curve is a Poisson curve with rate = median count rate of data. |
 |
 |
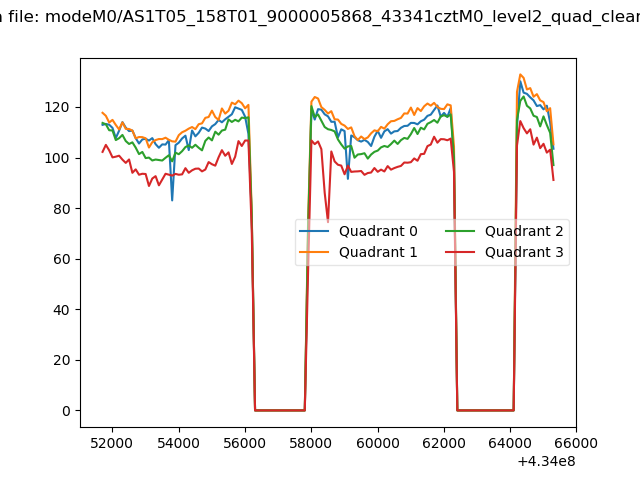
| Quadrant-wise count rates Data is divided into 100 sec bins |
 |
|
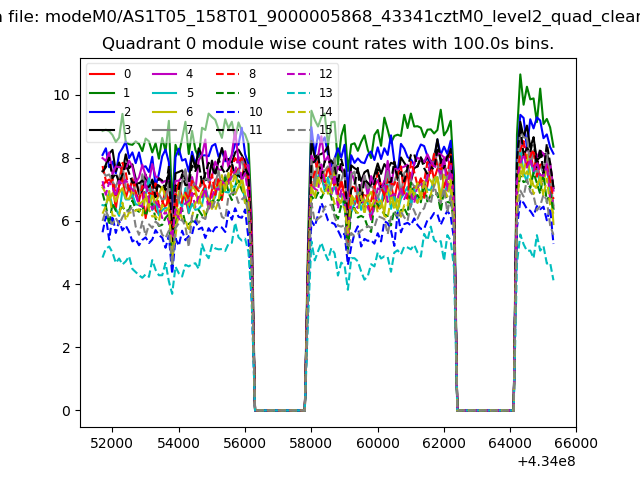
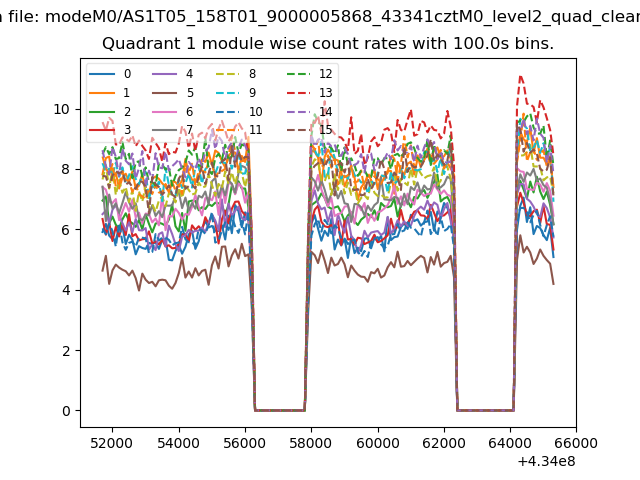
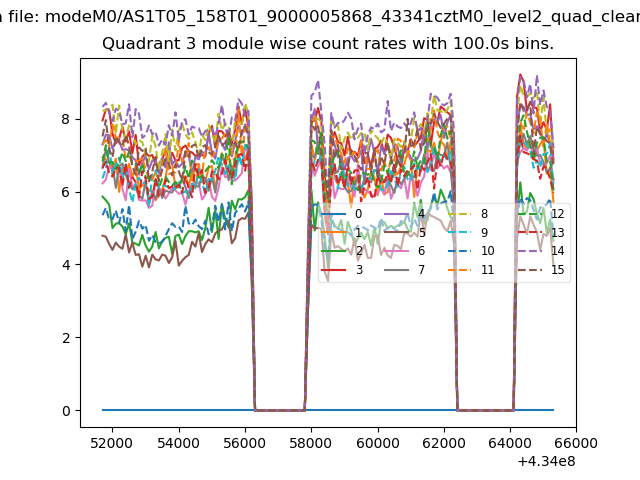
| Module-wise count rates for Quadrant A Data is divided into 100 sec bins |
 |
 |
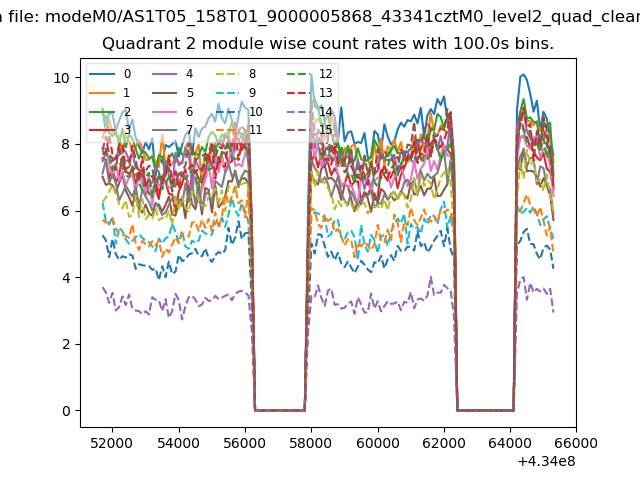
| Module-wise count rates for Quadrant B Data is divided into 100 sec bins |
 |
 |
| Module-wise count rates for Quadrant C Data is divided into 100 sec bins |
 |
 |
| Module-wise count rates for Quadrant D Data is divided into 100 sec bins |
 |
 |
| Parameter | Plot |
|---|---|
| CZT HV Monitor | 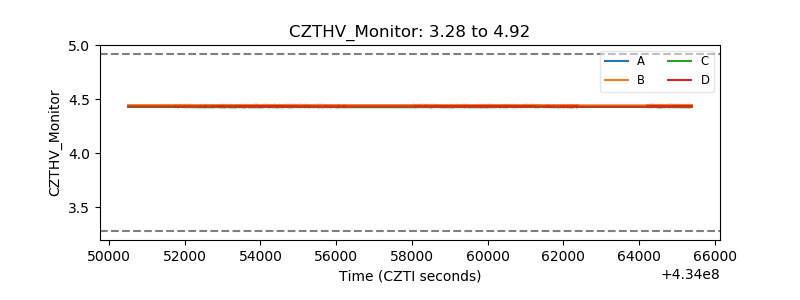 |
| D_VDD | 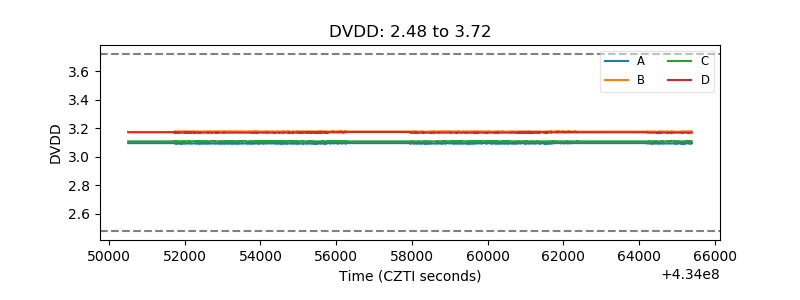 |
| Temperature 1 | 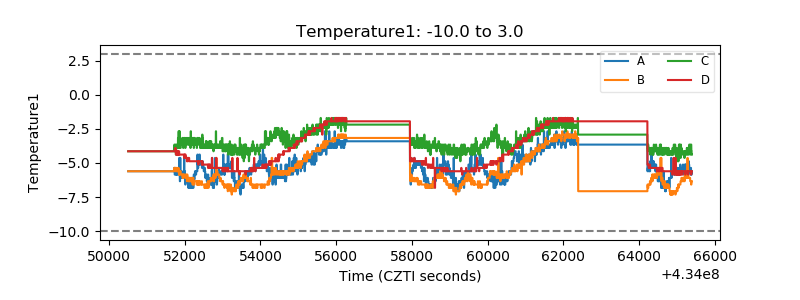 |
| Veto HV Monitor | 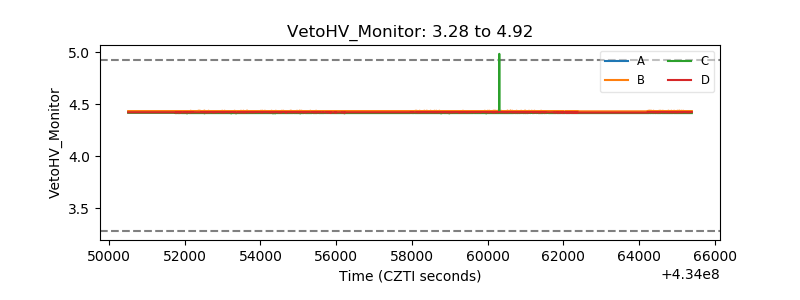 |
| Veto LLD | 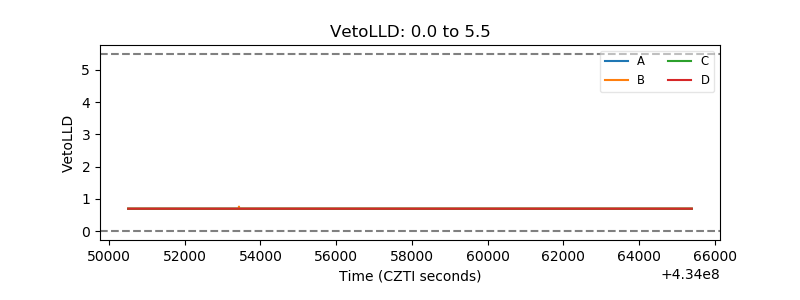 |
| Alpha Counter | 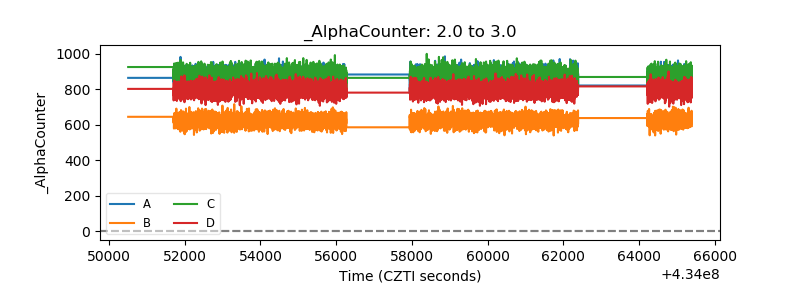 |
| _CPM_Rate | 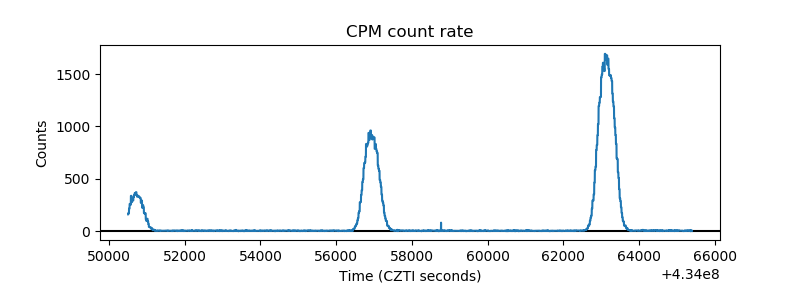 |
| CZT Counter | 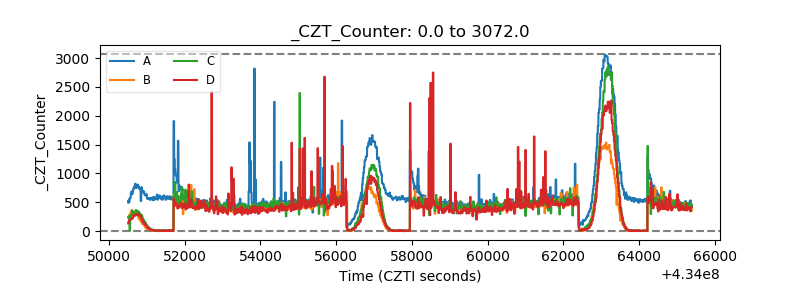 |
| +2.5 Volts monitor | 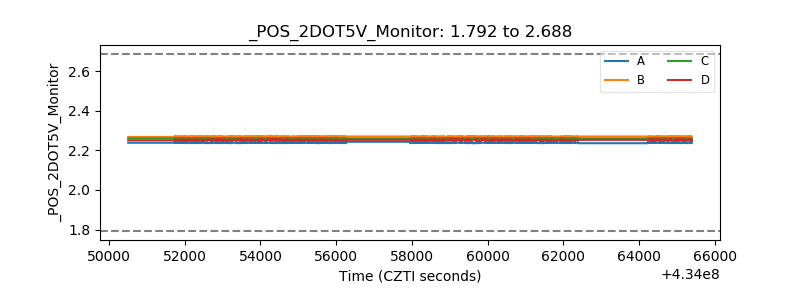 |
| +5 Volts monitor | 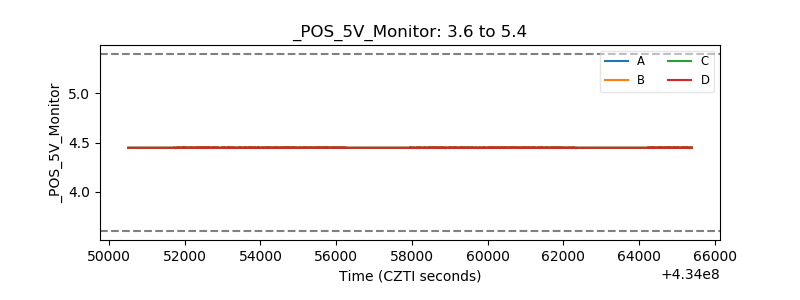 |
| _ROLL_ROT | 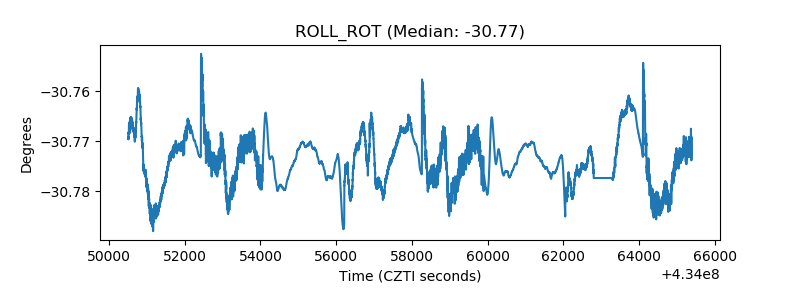 |
| _Roll_DEC | 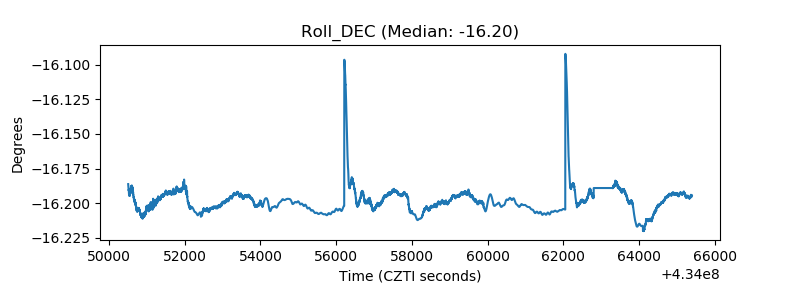 |
| _Roll_RA | 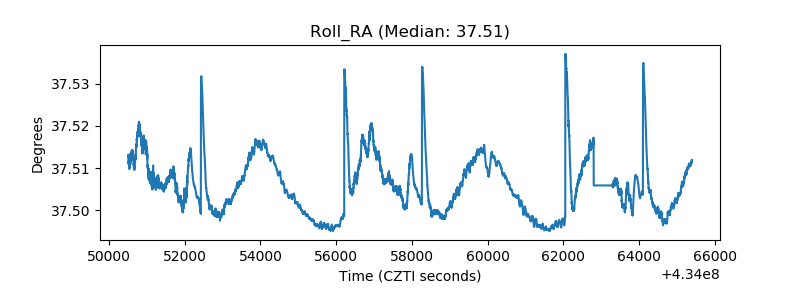 |
| Veto Counter | 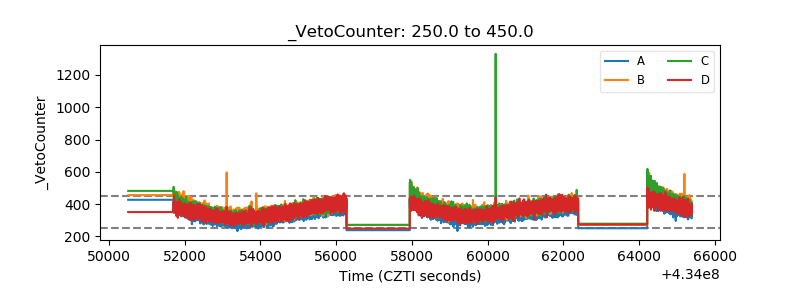 |