| Param | Original file | Final file |
|---|---|---|
| Filename | modeM0/AS1T05_158T01_9000005868_43342cztM0_level2.fits | modeM0/AS1T05_158T01_9000005868_43342cztM0_level2_quad_clean.evt |
| Size (bytes) | 299,793,600 | 92,548,800 |
| Size | 285.9 MB | 88.3 MB |
| Events in quadrant A | 2,979,226 | 626,932 |
| Events in quadrant B | 2,447,931 | 647,333 |
| Events in quadrant C | 2,611,679 | 608,849 |
| Events in quadrant D | 2,647,079 | 549,772 |
| Mode M0 | |||
|---|---|---|---|
| Quadrant | BADHDUFLAG | Total packets | Discarded packets |
| A | 0 | 11985 | 2 |
| B | 0 | 10713 | 2 |
| C | 0 | 10830 | 3 |
| D | 0 | 11625 | 2 |
| Mode M9 | |||
|---|---|---|---|
| Quadrant | BADHDUFLAG | Total packets | Discarded packets |
| A | 0 | 22 | 0 |
| B | 0 | 23 | 0 |
| C | 0 | 23 | 0 |
| D | 0 | 23 | 0 |
| Mode SS | |||
|---|---|---|---|
| Quadrant | BADHDUFLAG | Total packets | Discarded packets |
| A | 0 | 108 | 0 |
| B | 0 | 108 | 0 |
| C | 0 | 108 | 0 |
| D | 0 | 108 | 0 |
| Quadrant | Total seconds | Saturated seconds | Saturation percentage |
|---|---|---|---|
| A | 5277 | 50 | 0.947508% |
| B | 5277 | 8 | 0.151601% |
| C | 5276 | 4 | 0.075815% |
| D | 5276 | 71 | 1.345716% |
Noise dominated data is calculated using 1-second bins in cleaned event files. If a bin has >2000 counts, and if more than 50% of those come from <1% of pixels, then it is considered to be noise-dominated and hence unusable.
| Quadrant | # 1 sec bins | Bins with >0 counts | Bins with >2000 counts | High rate bins dominated by noise | Noise dominated (total time) | Noise dominated (detector-on time) | Marked lightcurve |
|---|---|---|---|---|---|---|---|
| A | 7219 | 5278 | 25 | 25 | 0.35% | 0.47% | 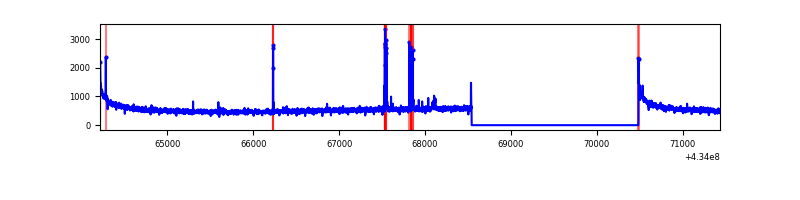 |
| B | 7219 | 5278 | 2 | 2 | 0.03% | 0.04% | 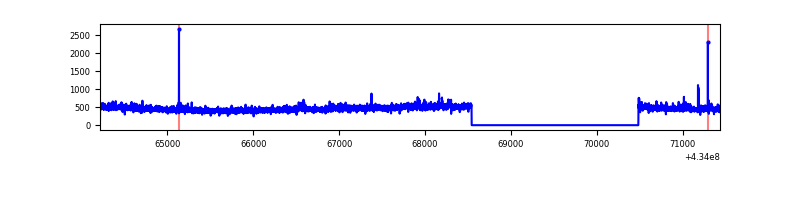 |
| C | 7218 | 5277 | 0 | 0 | 0.00% | 0.00% | 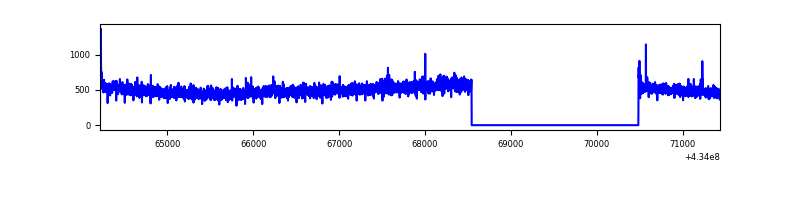 |
| D | 7218 | 5277 | 60 | 60 | 0.83% | 1.14% | 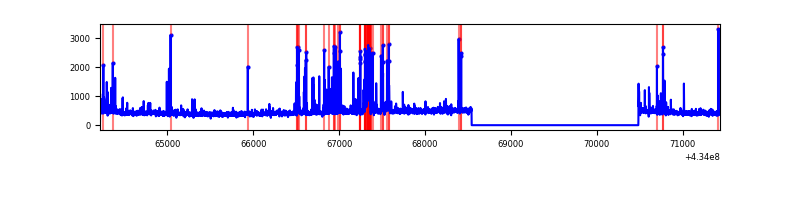 |
Top three noisy pixels from each quadrant. If the there are fewer than three noisy pixels in the level2.evt file, extra rows are filled as -1
| Pixel properties | Quadrant properties | ||||||
|---|---|---|---|---|---|---|---|
| Quadrant | DetID | PixID | Counts | Sigma | Mean | Median | Sigma |
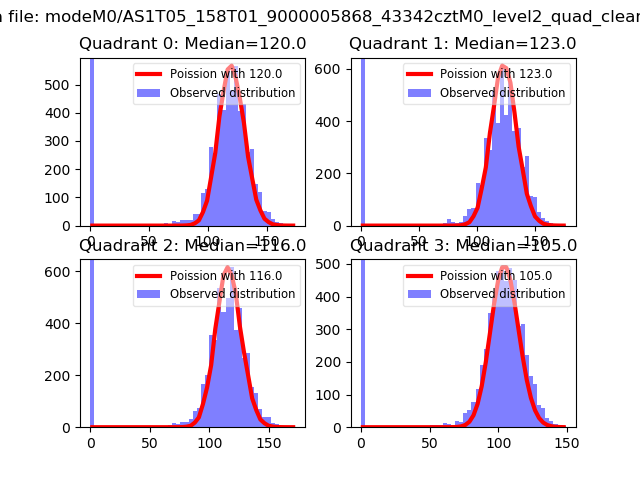
| A | 10 | 83 | 549823 | 4479.42 | 602 | 592 | 122.6 |
| A | 15 | 237 | 93079 | 754.31 | 602 | 592 | 122.6 |
| A | 13 | 248 | 10224 | 78.56 | 602 | 592 | 122.6 |
| B | 0 | 189 | 38779 | 328.71 | 601 | 585 | 116.2 |
| B | 0 | 245 | 22532 | 188.88 | 601 | 585 | 116.2 |
| B | 12 | 111 | 14677 | 121.28 | 601 | 585 | 116.2 |
| C | 15 | 214 | 222106 | 1596.68 | 594 | 599 | 138.7 |
| C | 3 | 233 | 63450 | 453.05 | 594 | 599 | 138.7 |
| C | 15 | 208 | 7367 | 48.79 | 594 | 599 | 138.7 |
| D | 13 | 249 | 143763 | 1004.39 | 584 | 568 | 142.6 |
| D | 2 | 249 | 135185 | 944.22 | 584 | 568 | 142.6 |
| D | 12 | 6 | 76508 | 532.65 | 584 | 568 | 142.6 |
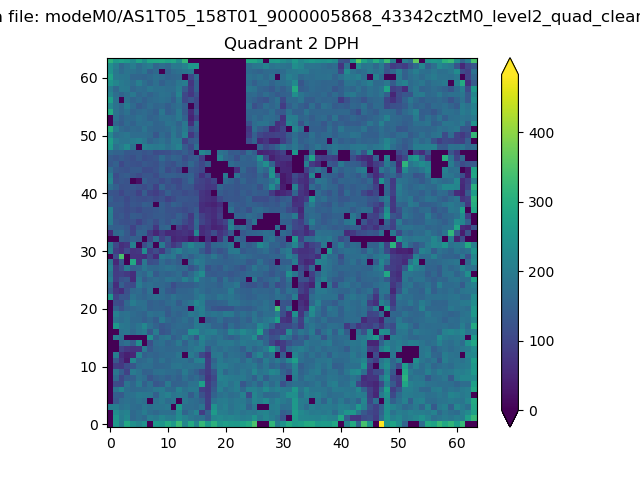
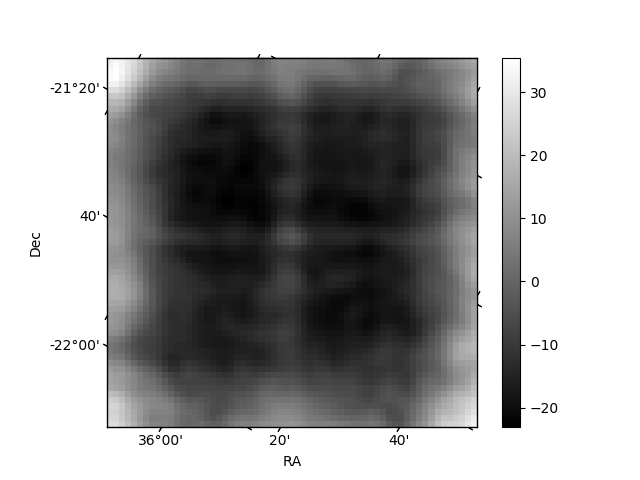
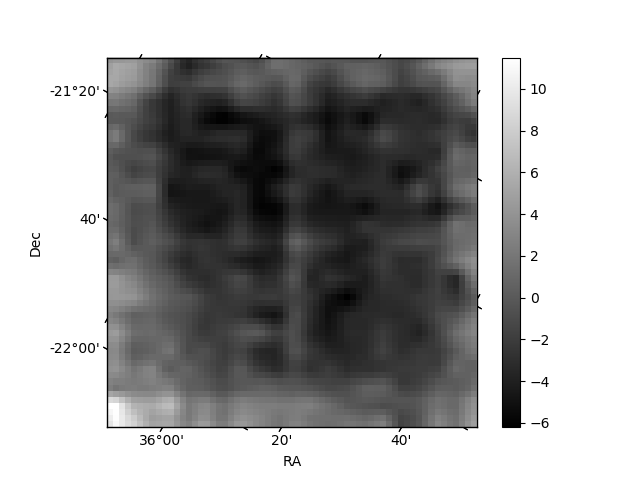
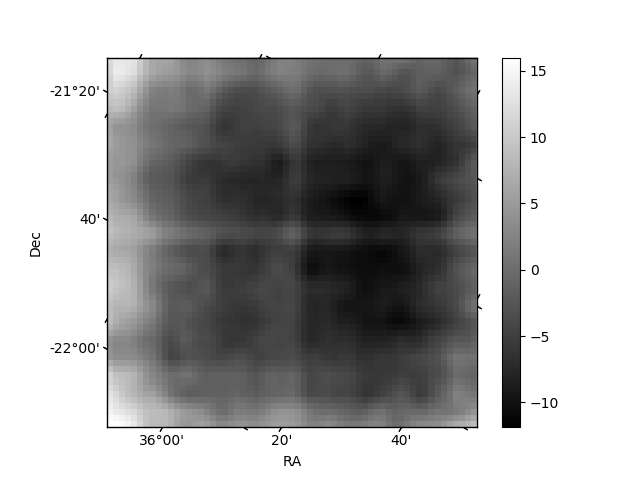
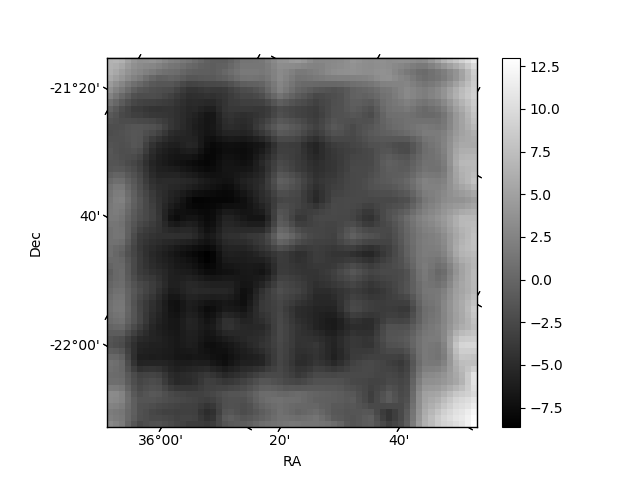
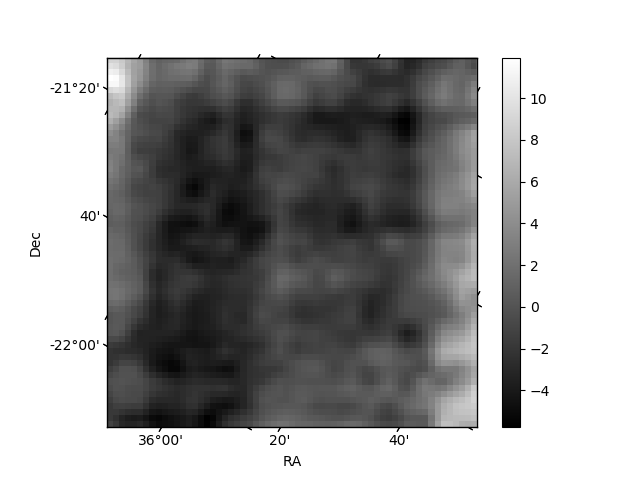
Histogram calculated using DETX and DETY for each event in the final _common_clean file
| Quadrant A | 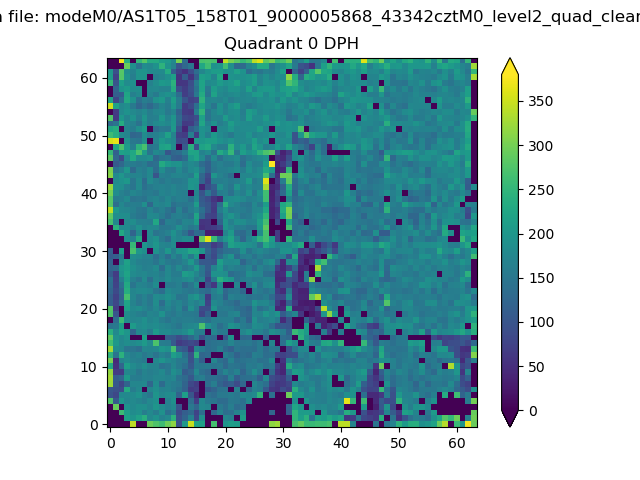 |
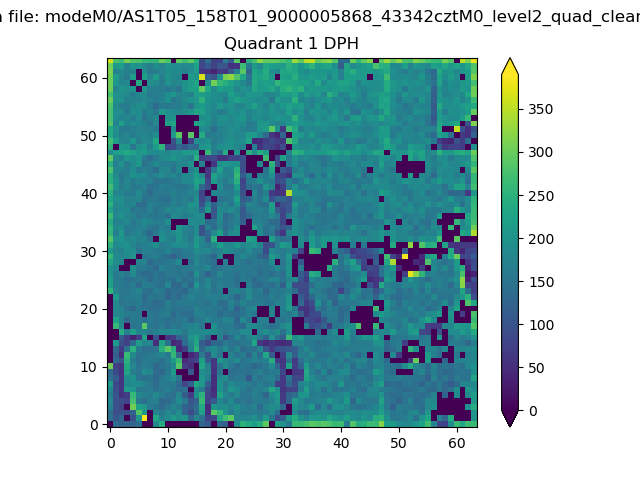 |
Quadrant B |
|---|---|---|---|
| Quadrant D | 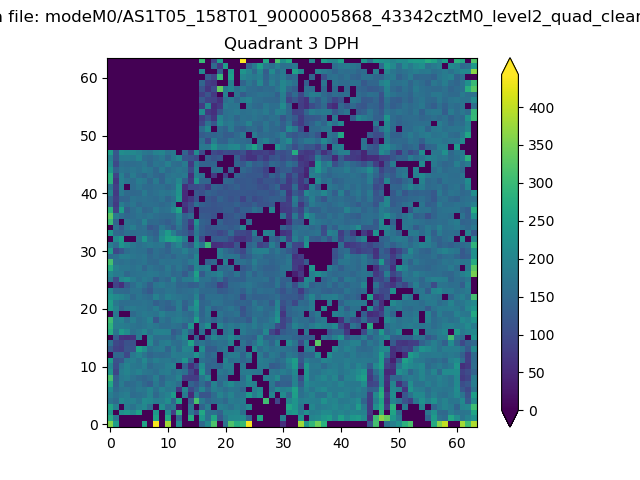 |
 |
Quadrant C |
| Plot type | Count rate plots | Images |
|---|---|---|
| Comparison with Poisson distribution Blue bars denote a histogram of data divided into 1 sec bins. Red curve is a Poisson curve with rate = median count rate of data. |
 |
 |
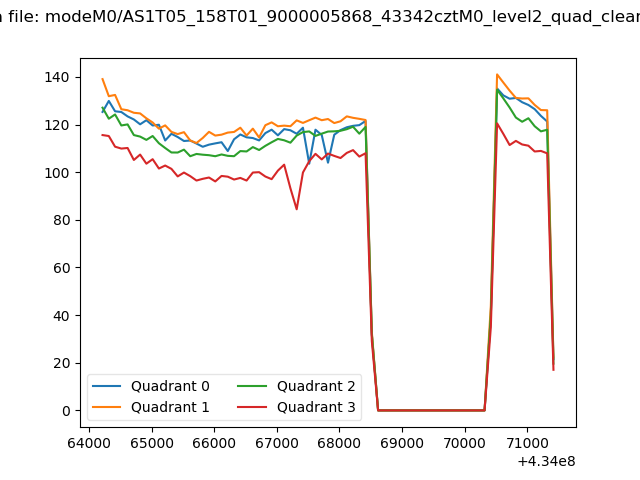
| Quadrant-wise count rates Data is divided into 100 sec bins |
 |
|
| Module-wise count rates for Quadrant A Data is divided into 100 sec bins |
 |
 |
| Module-wise count rates for Quadrant B Data is divided into 100 sec bins |
 |
 |
| Module-wise count rates for Quadrant C Data is divided into 100 sec bins |
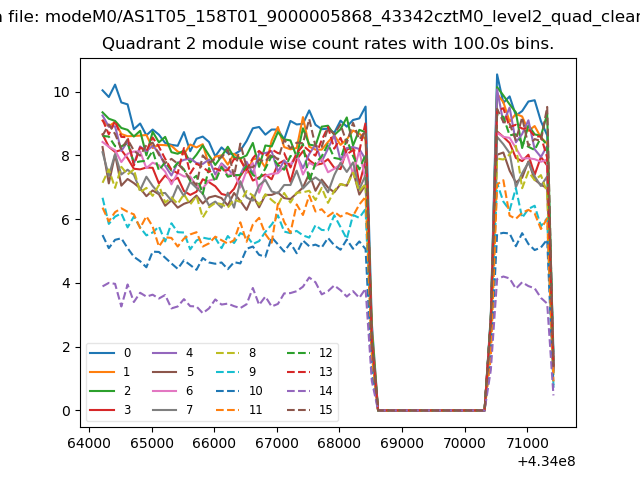 |
 |
| Module-wise count rates for Quadrant D Data is divided into 100 sec bins |
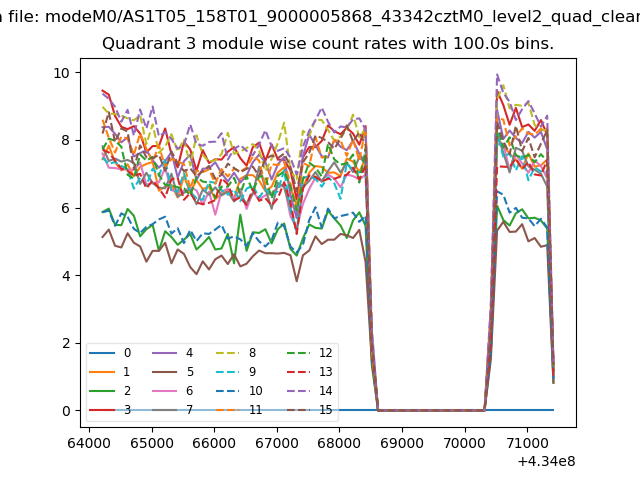 |
 |
| Parameter | Plot |
|---|---|
| CZT HV Monitor | 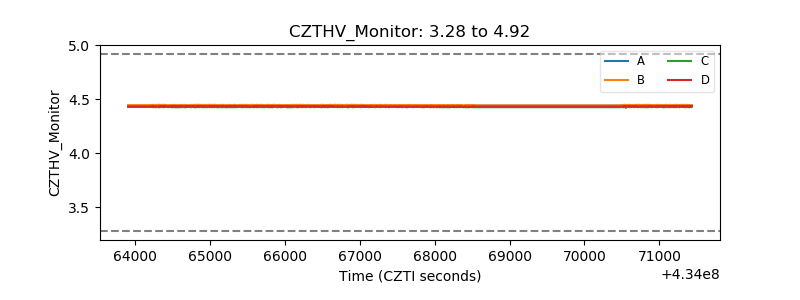 |
| D_VDD | 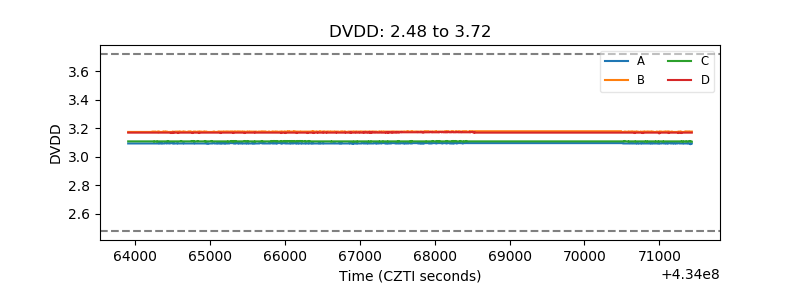 |
| Temperature 1 | 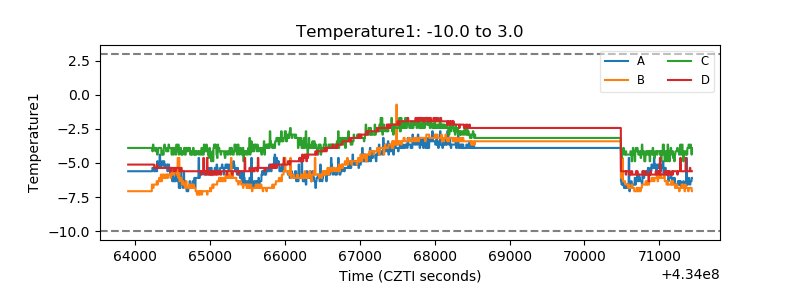 |
| Veto HV Monitor | 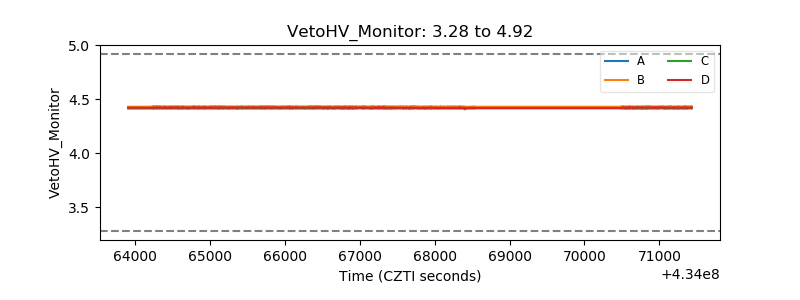 |
| Veto LLD | 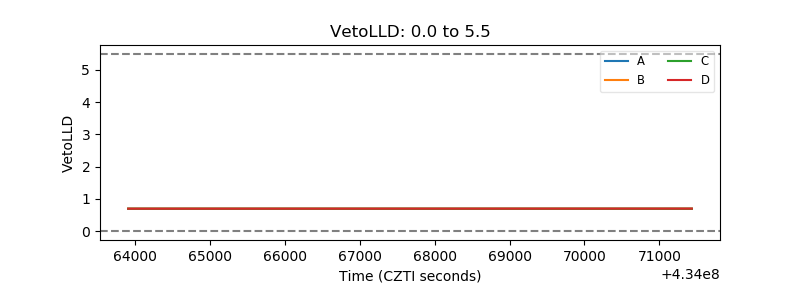 |
| Alpha Counter | 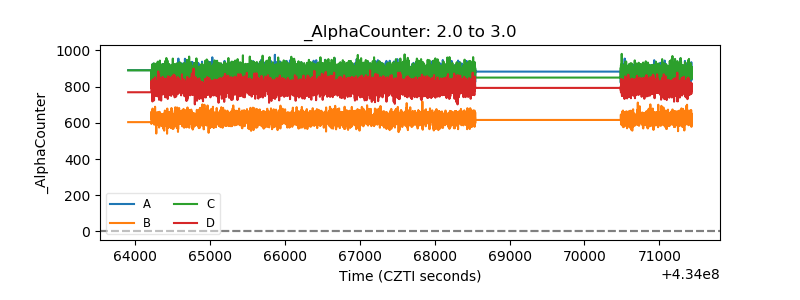 |
| _CPM_Rate | 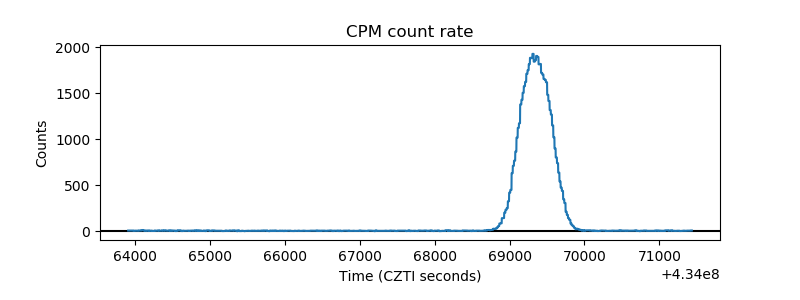 |
| CZT Counter | 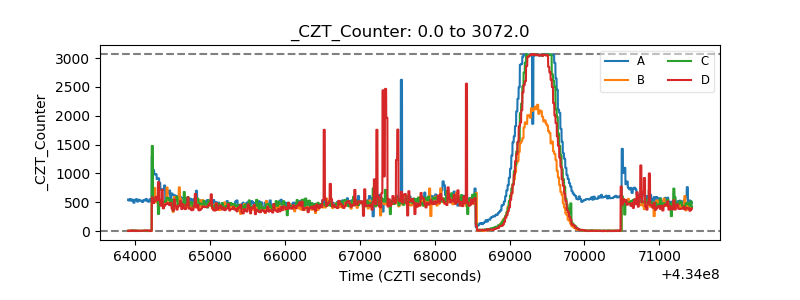 |
| +2.5 Volts monitor | 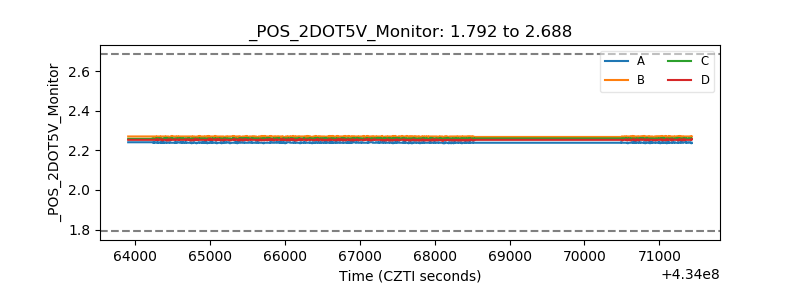 |
| +5 Volts monitor | 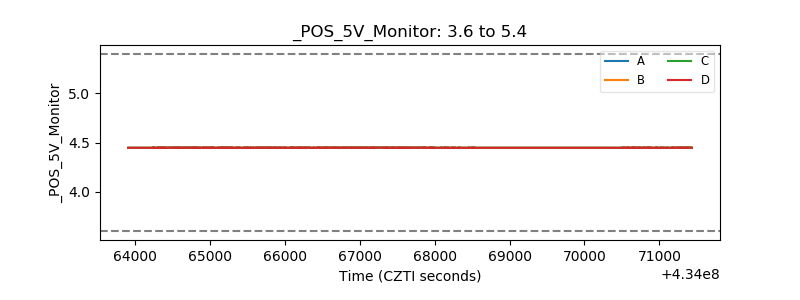 |
| _ROLL_ROT | 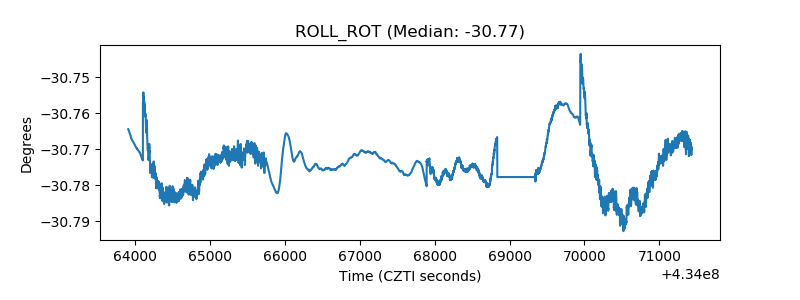 |
| _Roll_DEC | 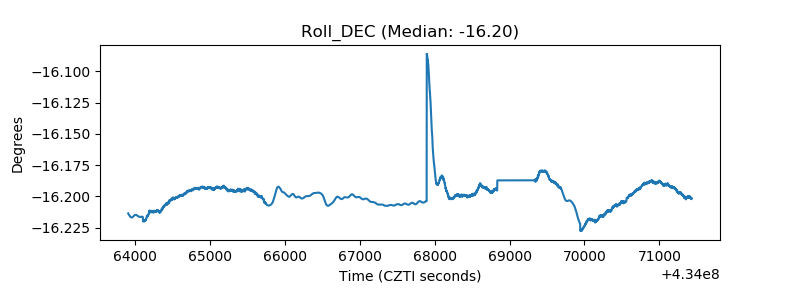 |
| _Roll_RA | 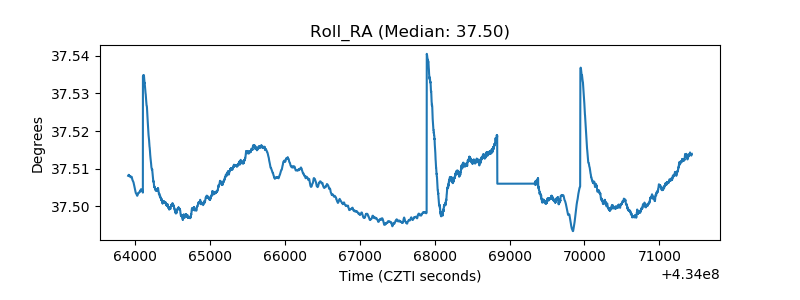 |
| Veto Counter | 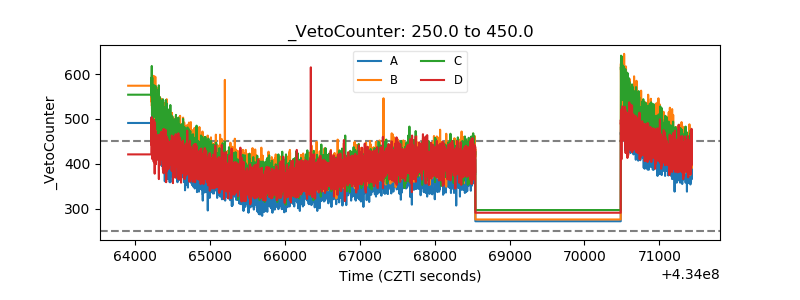 |