| Param | Original file | Final file |
|---|---|---|
| Filename | modeM0/AS1T05_158T01_9000005868_43343cztM0_level2.fits | modeM0/AS1T05_158T01_9000005868_43343cztM0_level2_quad_clean.evt |
| Size (bytes) | 303,845,760 | 93,349,440 |
| Size | 289.8 MB | 89.0 MB |
| Events in quadrant A | 2,932,509 | 634,715 |
| Events in quadrant B | 2,467,104 | 654,473 |
| Events in quadrant C | 2,590,583 | 617,650 |
| Events in quadrant D | 2,851,810 | 555,781 |
| Mode M0 | |||
|---|---|---|---|
| Quadrant | BADHDUFLAG | Total packets | Discarded packets |
| A | 0 | 11714 | 2 |
| B | 0 | 10645 | 2 |
| C | 0 | 10620 | 2 |
| D | 0 | 12053 | 2 |
| Mode M9 | |||
|---|---|---|---|
| Quadrant | BADHDUFLAG | Total packets | Discarded packets |
| A | 0 | 31 | 0 |
| B | 0 | 32 | 0 |
| C | 0 | 32 | 0 |
| D | 0 | 32 | 0 |
| Mode SS | |||
|---|---|---|---|
| Quadrant | BADHDUFLAG | Total packets | Discarded packets |
| A | 0 | 106 | 0 |
| B | 0 | 106 | 0 |
| C | 0 | 106 | 0 |
| D | 0 | 106 | 0 |
| Quadrant | Total seconds | Saturated seconds | Saturation percentage |
|---|---|---|---|
| A | 5200 | 15 | 0.288462% |
| B | 5200 | 11 | 0.211538% |
| C | 5200 | 4 | 0.076923% |
| D | 5200 | 104 | 2.000000% |
Noise dominated data is calculated using 1-second bins in cleaned event files. If a bin has >2000 counts, and if more than 50% of those come from <1% of pixels, then it is considered to be noise-dominated and hence unusable.
| Quadrant | # 1 sec bins | Bins with >0 counts | Bins with >2000 counts | High rate bins dominated by noise | Noise dominated (total time) | Noise dominated (detector-on time) | Marked lightcurve |
|---|---|---|---|---|---|---|---|
| A | 7263 | 5201 | 10 | 10 | 0.14% | 0.19% | 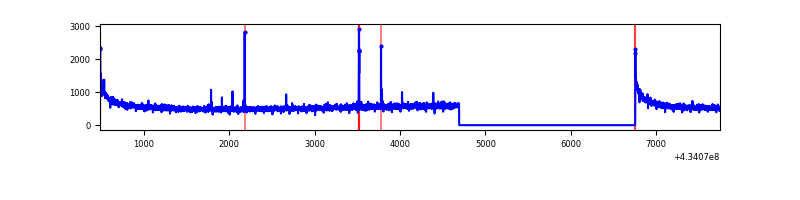 |
| B | 7263 | 5201 | 1 | 1 | 0.01% | 0.02% | 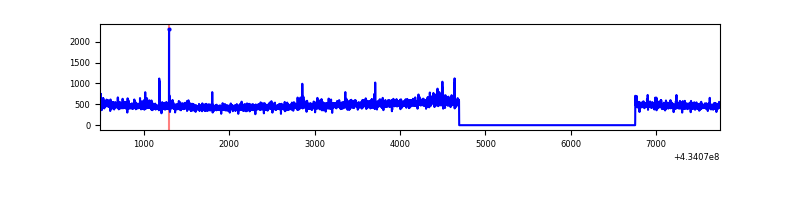 |
| C | 7263 | 5201 | 1 | 1 | 0.01% | 0.02% | 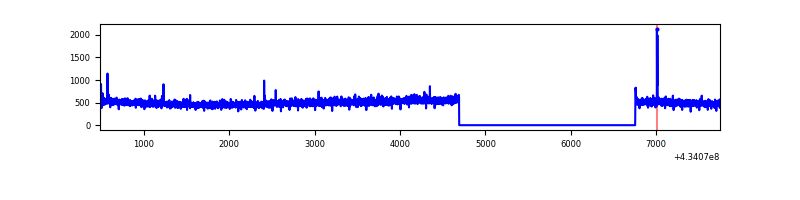 |
| D | 7263 | 5201 | 99 | 99 | 1.36% | 1.90% | 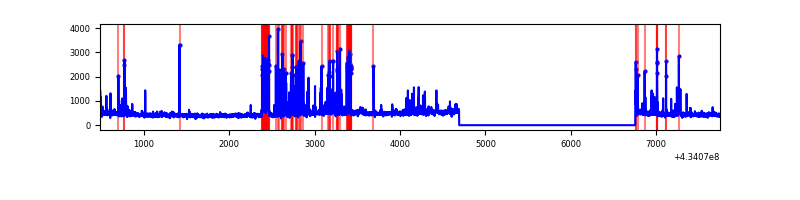 |
Top three noisy pixels from each quadrant. If the there are fewer than three noisy pixels in the level2.evt file, extra rows are filled as -1
| Pixel properties | Quadrant properties | ||||||
|---|---|---|---|---|---|---|---|
| Quadrant | DetID | PixID | Counts | Sigma | Mean | Median | Sigma |
| A | 10 | 83 | 553388 | 4443.11 | 609 | 597 | 124.4 |
| A | 15 | 237 | 27623 | 217.22 | 609 | 597 | 124.4 |
| A | 3 | 137 | 6626 | 48.46 | 609 | 597 | 124.4 |
| B | 0 | 189 | 53133 | 453.5 | 604 | 589 | 115.9 |
| B | 0 | 245 | 25460 | 214.66 | 604 | 589 | 115.9 |
| B | 4 | 173 | 19080 | 159.59 | 604 | 589 | 115.9 |
| C | 15 | 214 | 219611 | 1570.03 | 598 | 602 | 139.5 |
| C | 3 | 233 | 31012 | 218.0 | 598 | 602 | 139.5 |
| C | 15 | 208 | 7904 | 52.35 | 598 | 602 | 139.5 |
| D | 12 | 6 | 250820 | 1735.37 | 588 | 573 | 144.2 |
| D | 13 | 249 | 140977 | 973.65 | 588 | 573 | 144.2 |
| D | 2 | 249 | 112530 | 776.38 | 588 | 573 | 144.2 |
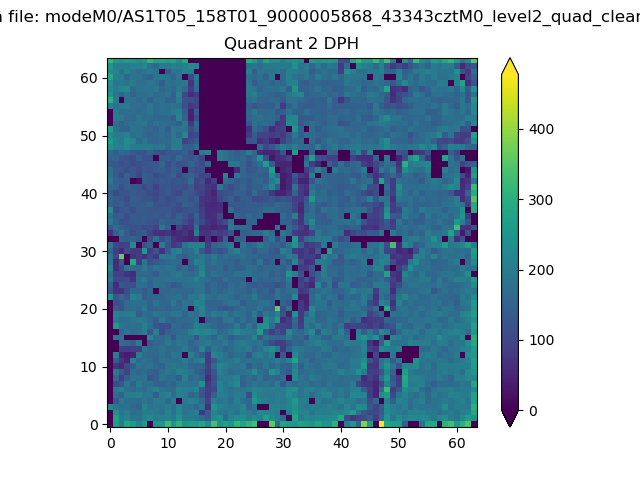
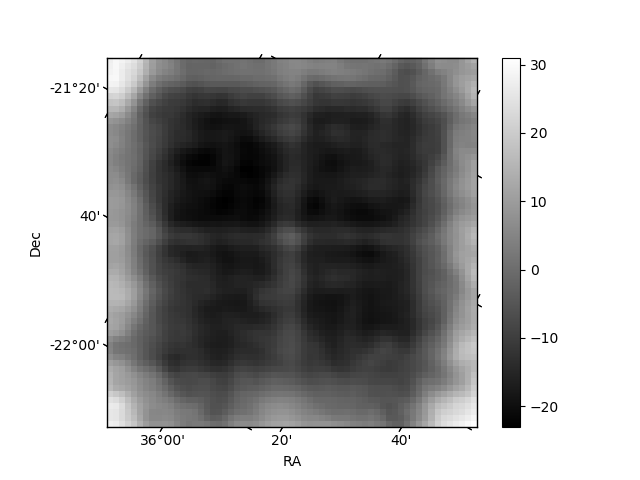
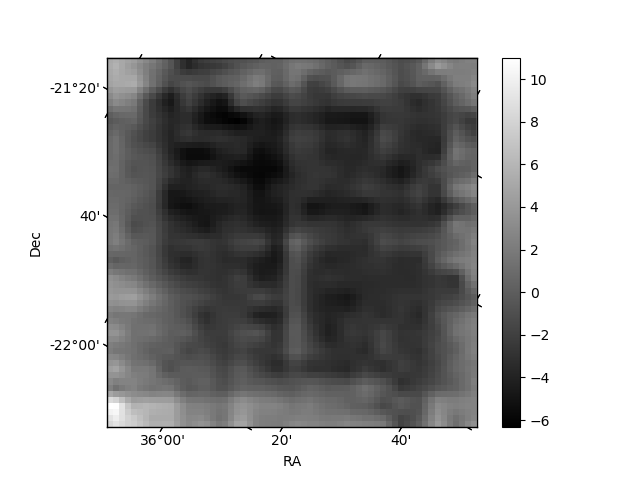
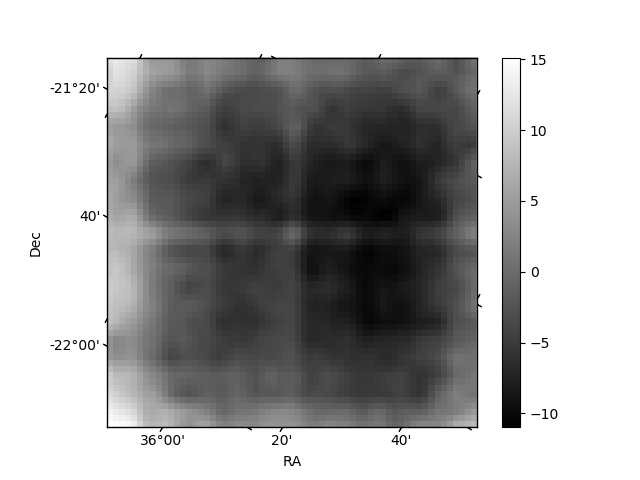
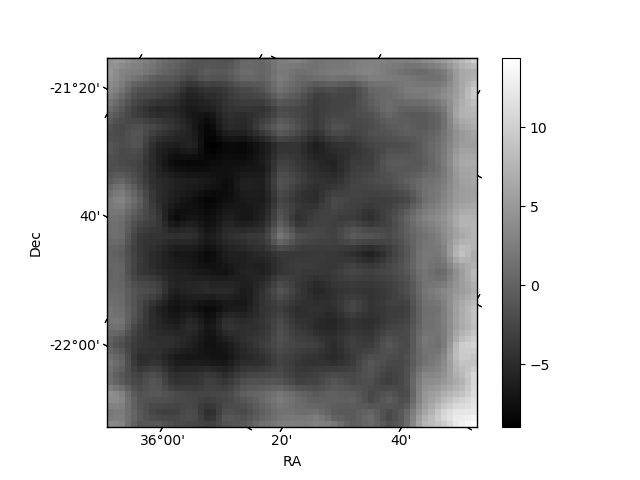
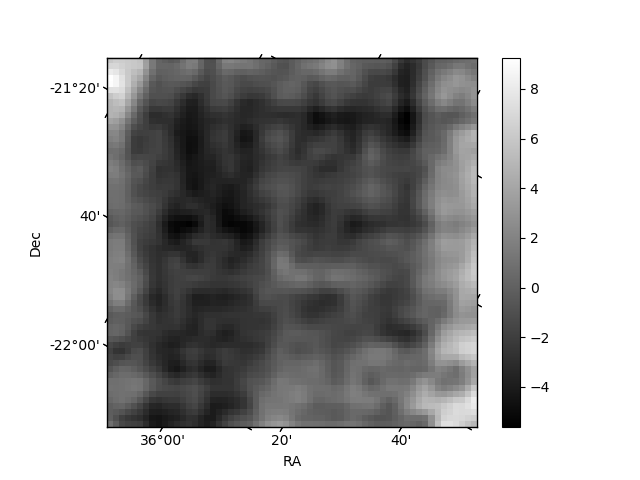
Histogram calculated using DETX and DETY for each event in the final _common_clean file
| Quadrant A | 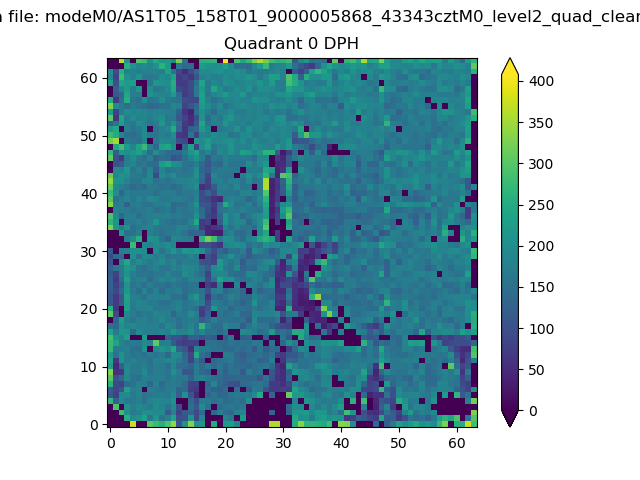 |
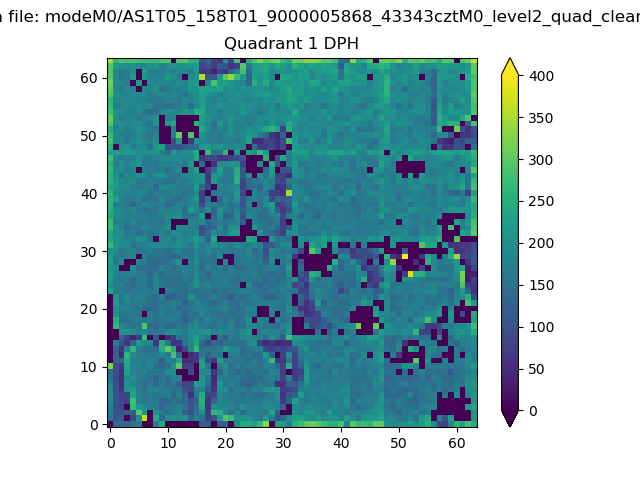 |
Quadrant B |
|---|---|---|---|
| Quadrant D | 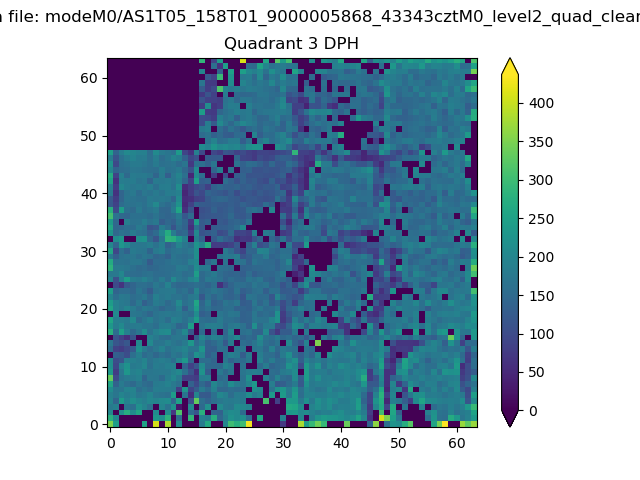 |
 |
Quadrant C |
| Plot type | Count rate plots | Images |
|---|---|---|
| Comparison with Poisson distribution Blue bars denote a histogram of data divided into 1 sec bins. Red curve is a Poisson curve with rate = median count rate of data. |
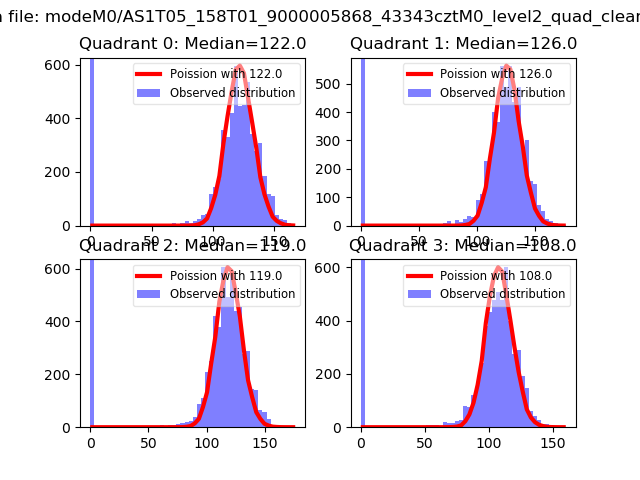 |
 |
| Quadrant-wise count rates Data is divided into 100 sec bins |
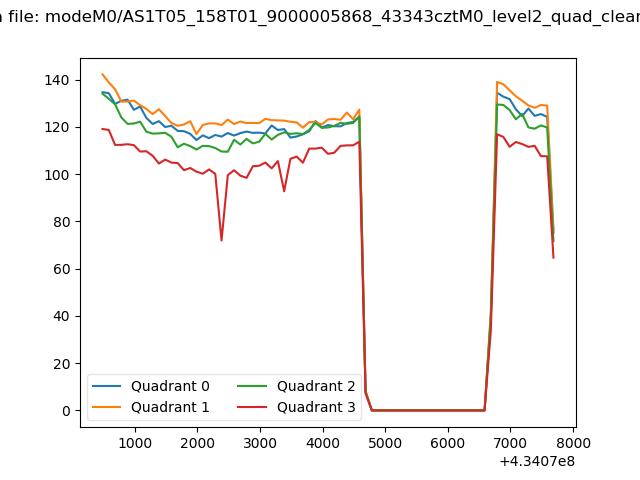 |
|
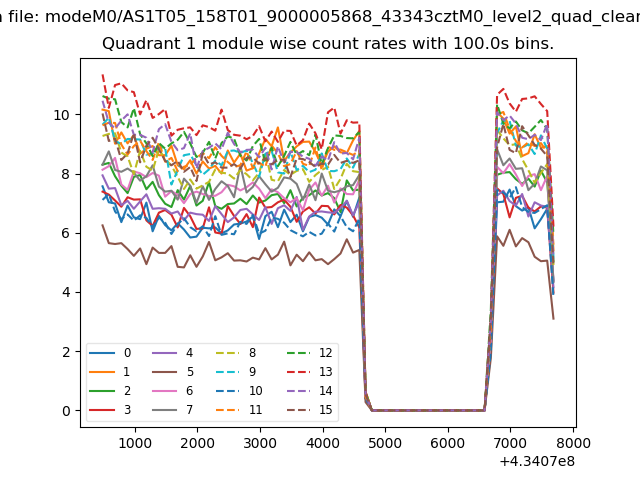
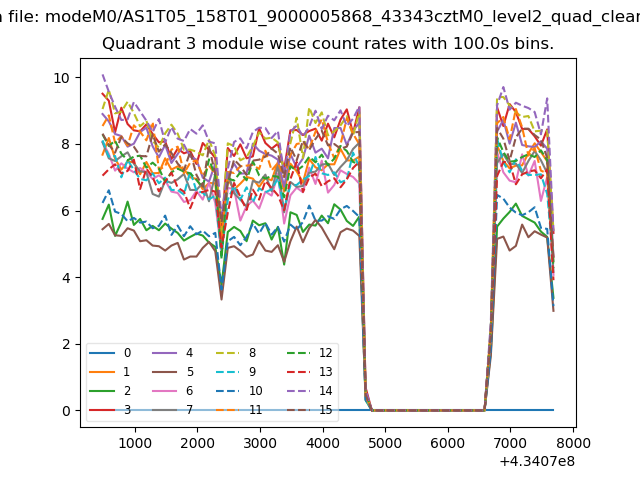
| Module-wise count rates for Quadrant A Data is divided into 100 sec bins |
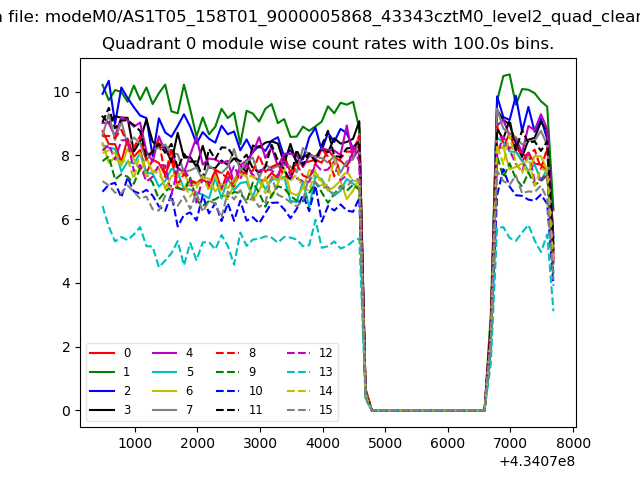 |
 |
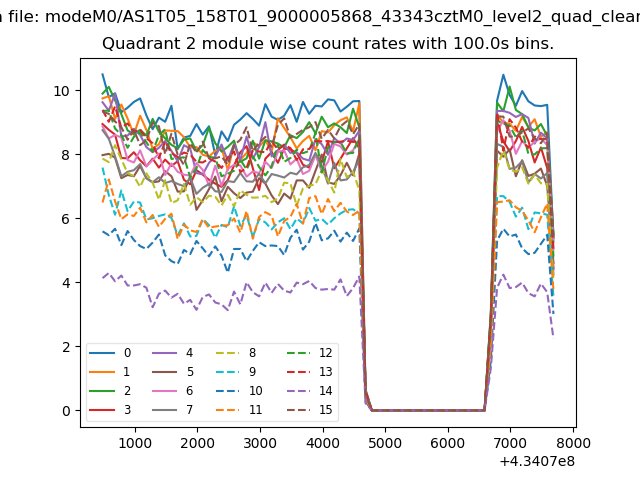
| Module-wise count rates for Quadrant B Data is divided into 100 sec bins |
 |
 |
| Module-wise count rates for Quadrant C Data is divided into 100 sec bins |
 |
 |
| Module-wise count rates for Quadrant D Data is divided into 100 sec bins |
 |
 |
| Parameter | Plot |
|---|---|
| CZT HV Monitor | 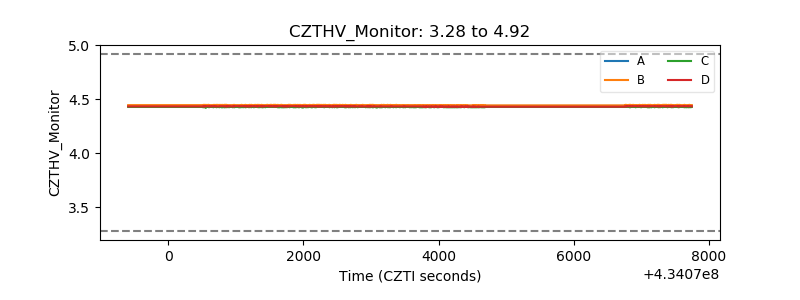 |
| D_VDD | 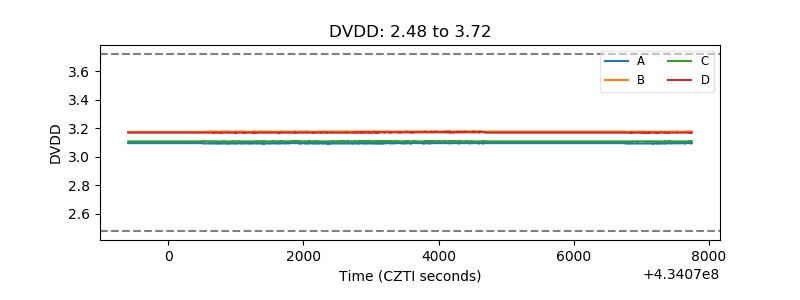 |
| Temperature 1 | 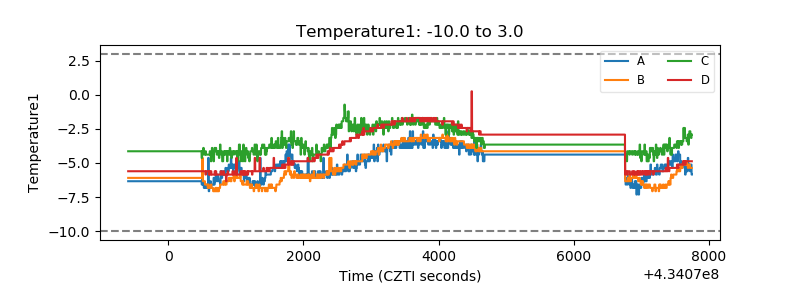 |
| Veto HV Monitor | 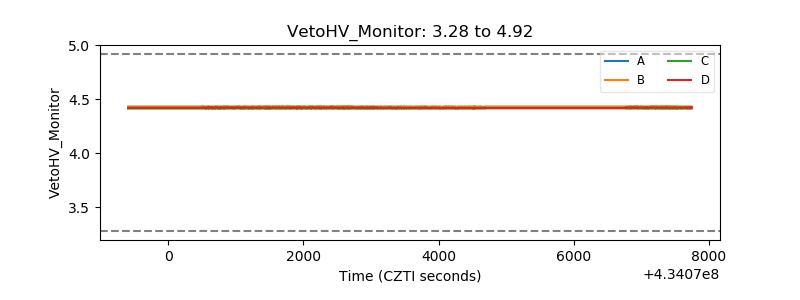 |
| Veto LLD | 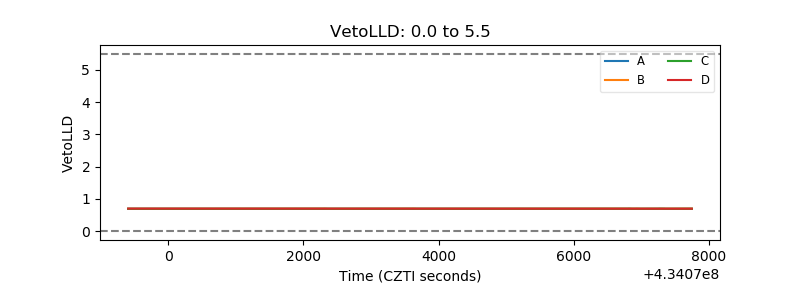 |
| Alpha Counter | 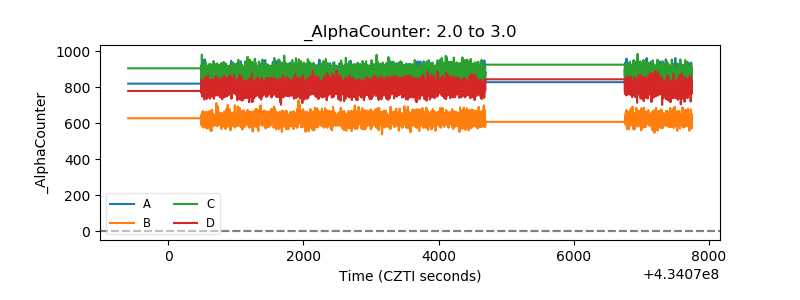 |
| _CPM_Rate | 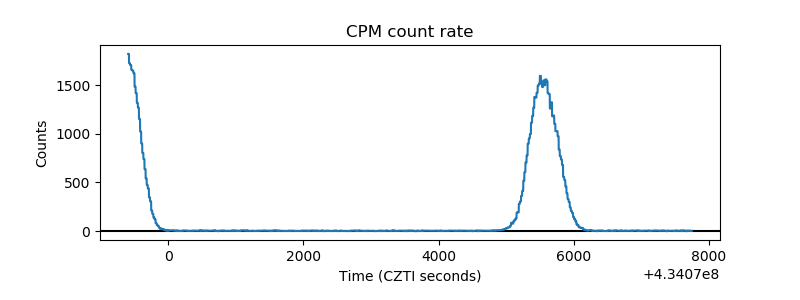 |
| CZT Counter | 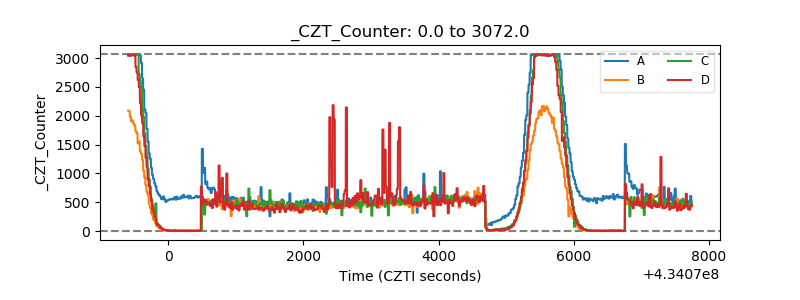 |
| +2.5 Volts monitor | 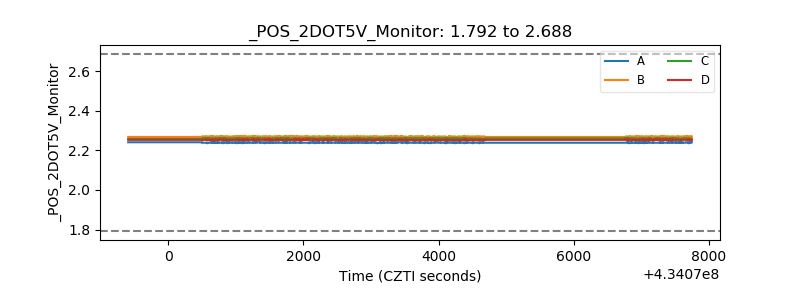 |
| +5 Volts monitor | 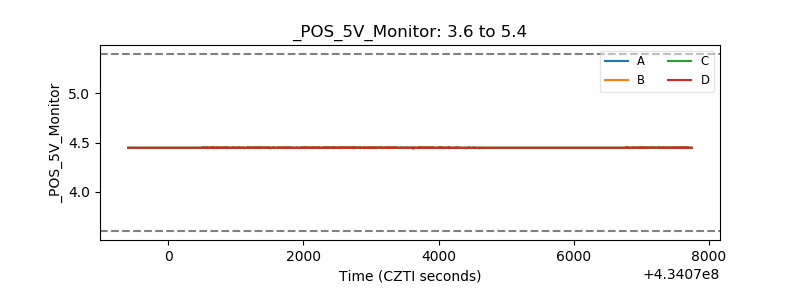 |
| _ROLL_ROT | 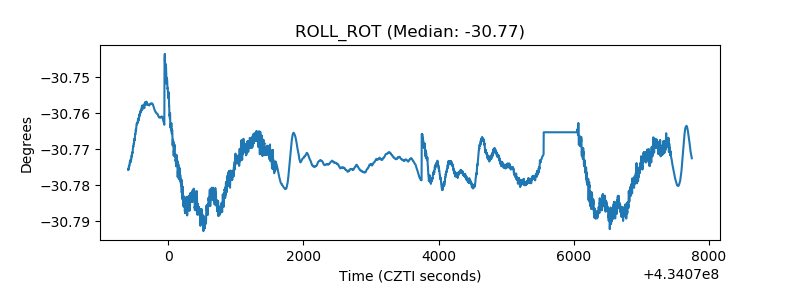 |
| _Roll_DEC | 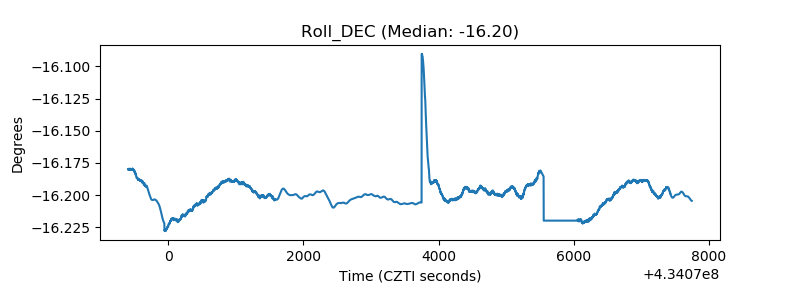 |
| _Roll_RA | 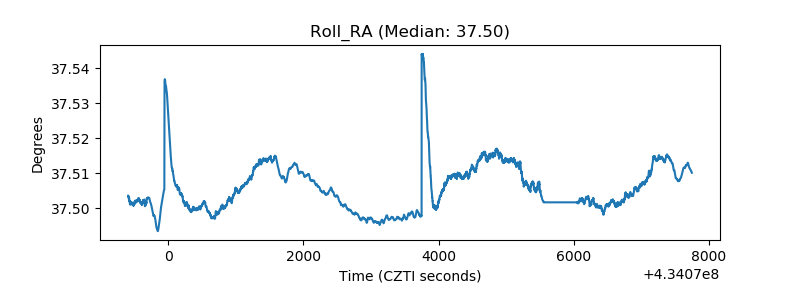 |
| Veto Counter | 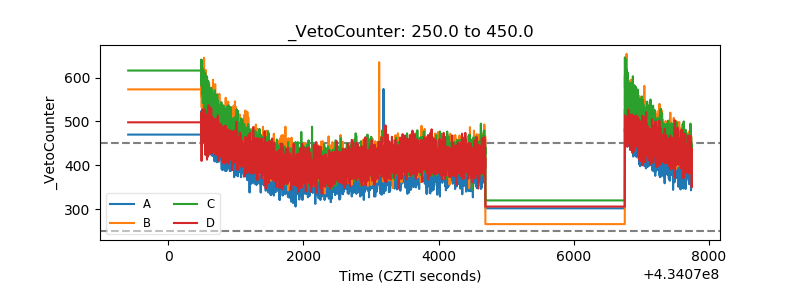 |