| Param | Original file | Final file |
|---|---|---|
| Filename | modeM0/AS1T05_158T01_9000005868_43344cztM0_level2.fits | modeM0/AS1T05_158T01_9000005868_43344cztM0_level2_quad_clean.evt |
| Size (bytes) | 294,816,960 | 88,047,360 |
| Size | 281.2 MB | 84.0 MB |
| Events in quadrant A | 2,853,792 | 594,158 |
| Events in quadrant B | 2,367,785 | 617,465 |
| Events in quadrant C | 2,471,500 | 583,677 |
| Events in quadrant D | 2,835,138 | 524,772 |
| Mode M0 | |||
|---|---|---|---|
| Quadrant | BADHDUFLAG | Total packets | Discarded packets |
| A | 0 | 11269 | 2 |
| B | 0 | 10094 | 2 |
| C | 0 | 10061 | 2 |
| D | 0 | 11715 | 2 |
| Mode M9 | |||
|---|---|---|---|
| Quadrant | BADHDUFLAG | Total packets | Discarded packets |
| A | 0 | 28 | 0 |
| B | 0 | 29 | 0 |
| C | 0 | 29 | 0 |
| D | 0 | 29 | 0 |
| Mode SS | |||
|---|---|---|---|
| Quadrant | BADHDUFLAG | Total packets | Discarded packets |
| A | 0 | 100 | 0 |
| B | 0 | 100 | 0 |
| C | 0 | 100 | 0 |
| D | 0 | 100 | 0 |
| Quadrant | Total seconds | Saturated seconds | Saturation percentage |
|---|---|---|---|
| A | 4936 | 38 | 0.769854% |
| B | 4936 | 10 | 0.202593% |
| C | 4936 | 7 | 0.141815% |
| D | 4936 | 116 | 2.350081% |
Noise dominated data is calculated using 1-second bins in cleaned event files. If a bin has >2000 counts, and if more than 50% of those come from <1% of pixels, then it is considered to be noise-dominated and hence unusable.
| Quadrant | # 1 sec bins | Bins with >0 counts | Bins with >2000 counts | High rate bins dominated by noise | Noise dominated (total time) | Noise dominated (detector-on time) | Marked lightcurve |
|---|---|---|---|---|---|---|---|
| A | 7058 | 4937 | 33 | 33 | 0.47% | 0.67% | 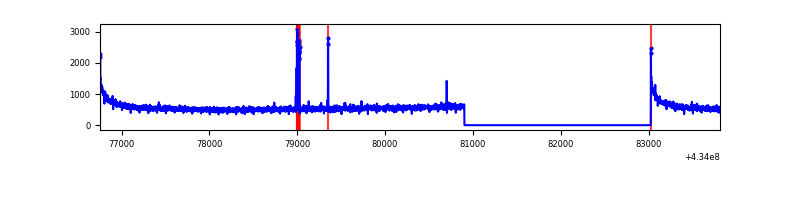 |
| B | 7058 | 4937 | 0 | 0 | 0.00% | 0.00% | 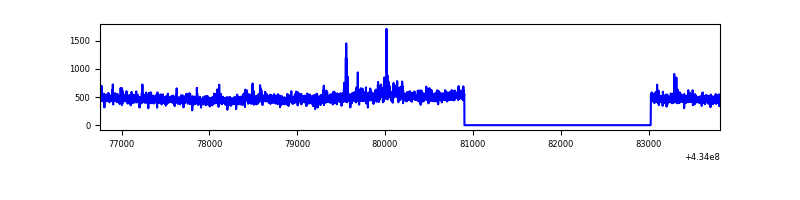 |
| C | 7058 | 4937 | 1 | 1 | 0.01% | 0.02% | 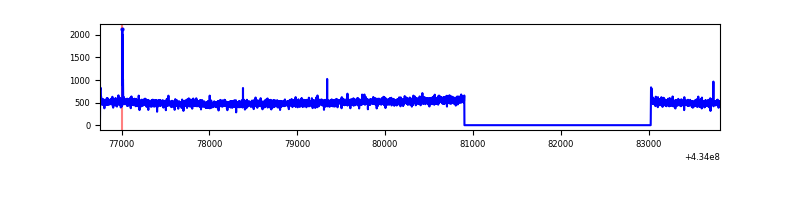 |
| D | 7058 | 4937 | 103 | 103 | 1.46% | 2.09% | 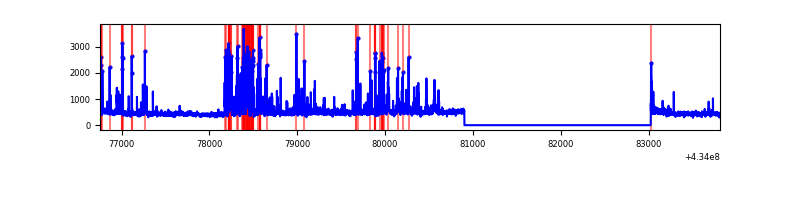 |
Top three noisy pixels from each quadrant. If the there are fewer than three noisy pixels in the level2.evt file, extra rows are filled as -1
| Pixel properties | Quadrant properties | ||||||
|---|---|---|---|---|---|---|---|
| Quadrant | DetID | PixID | Counts | Sigma | Mean | Median | Sigma |
| A | 10 | 83 | 534571 | 4505.5 | 578 | 567 | 118.5 |
| A | 15 | 237 | 85606 | 717.49 | 578 | 567 | 118.5 |
| A | 3 | 137 | 6277 | 48.18 | 578 | 567 | 118.5 |
| B | 0 | 189 | 72596 | 650.76 | 575 | 558 | 110.7 |
| B | 4 | 173 | 19404 | 170.25 | 575 | 558 | 110.7 |
| B | 0 | 245 | 16980 | 148.35 | 575 | 558 | 110.7 |
| C | 15 | 214 | 210025 | 1568.49 | 571 | 576 | 133.5 |
| C | 3 | 233 | 25311 | 185.23 | 571 | 576 | 133.5 |
| C | 15 | 208 | 8698 | 60.82 | 571 | 576 | 133.5 |
| D | 12 | 6 | 356252 | 2623.11 | 562 | 547 | 135.6 |
| D | 13 | 249 | 96592 | 708.27 | 562 | 547 | 135.6 |
| D | 2 | 249 | 93711 | 687.02 | 562 | 547 | 135.6 |
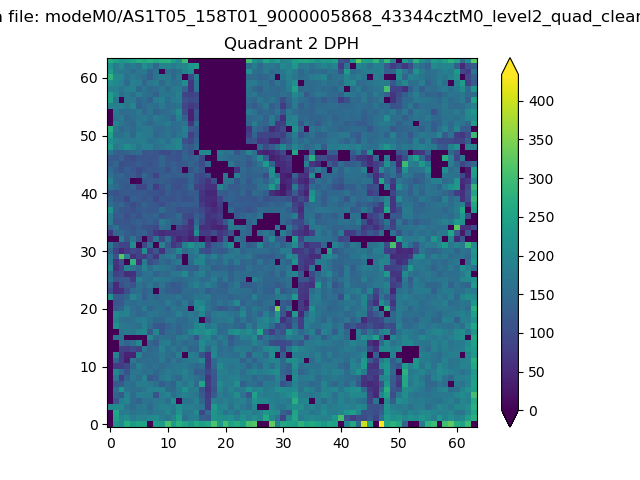
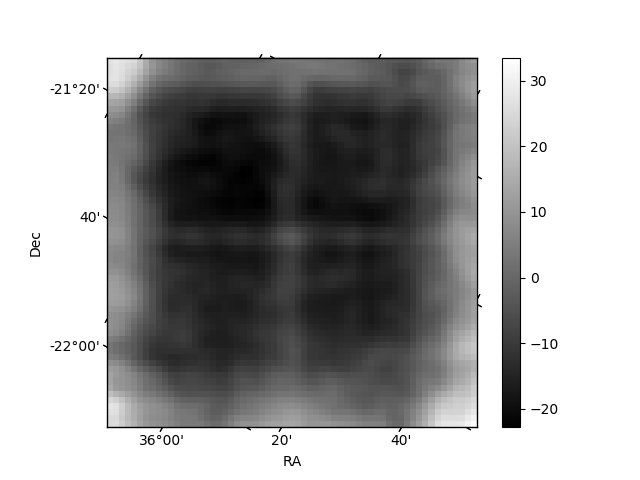
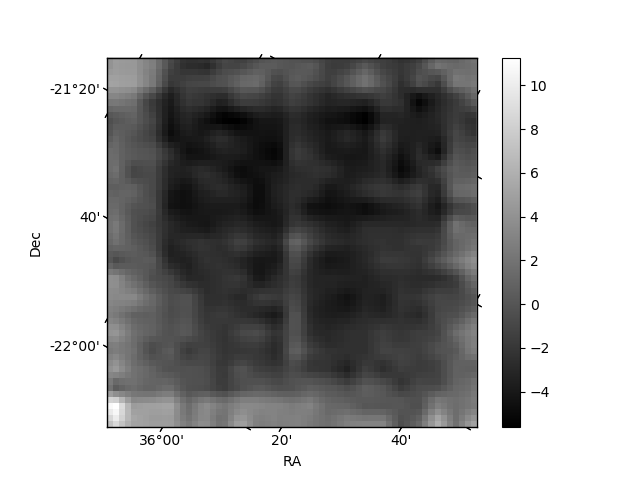
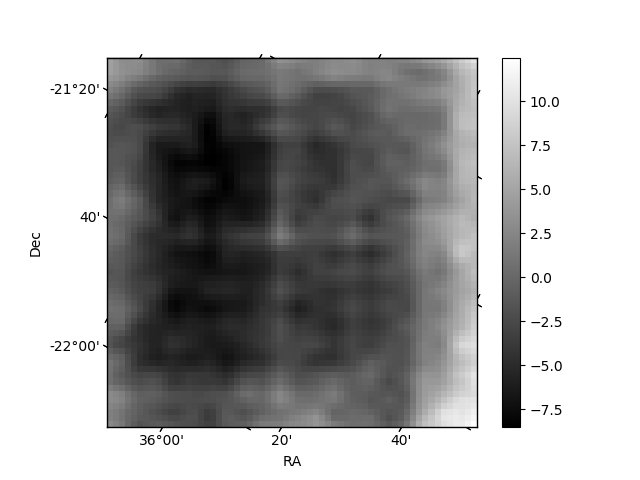
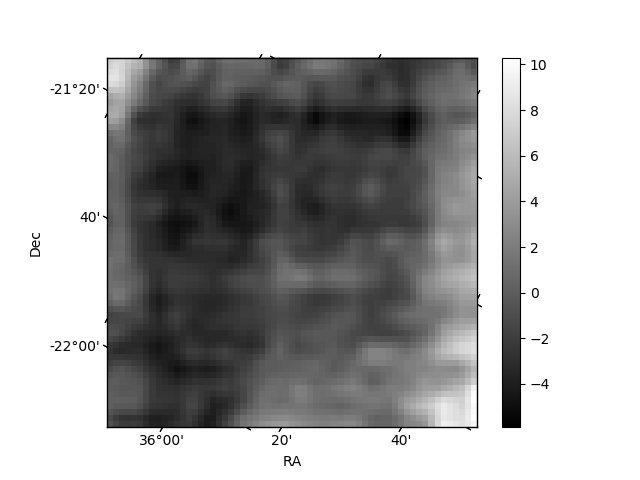
Histogram calculated using DETX and DETY for each event in the final _common_clean file
| Quadrant A | 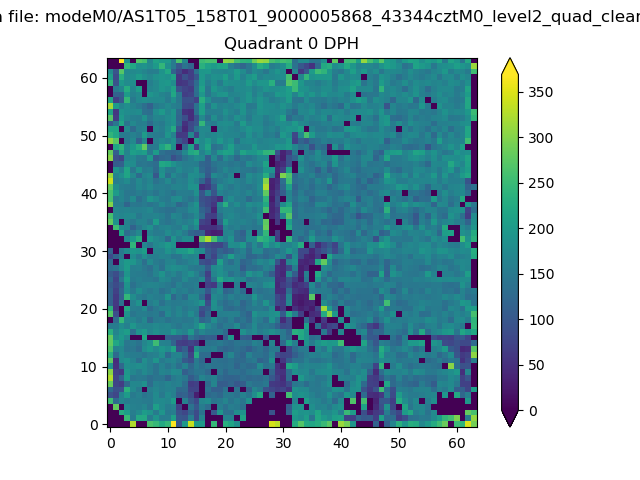 |
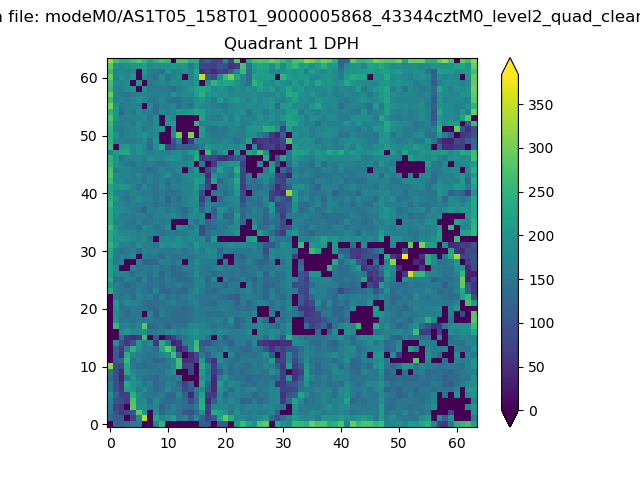 |
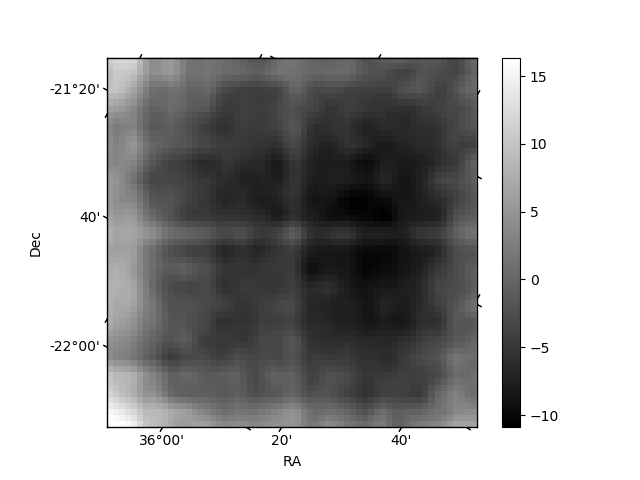
Quadrant B |
|---|---|---|---|
| Quadrant D | 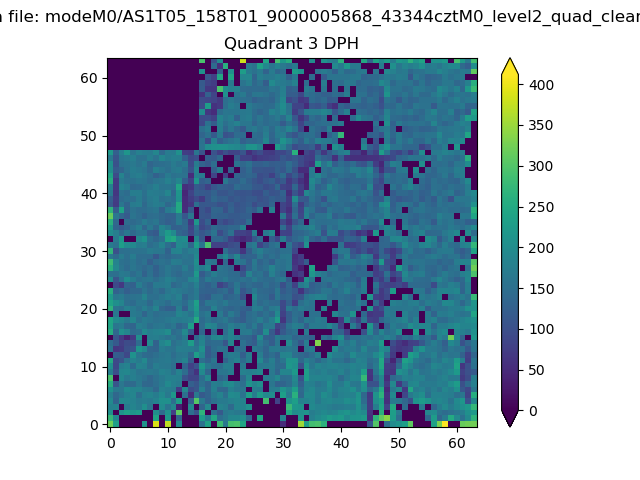 |
 |
Quadrant C |
| Plot type | Count rate plots | Images |
|---|---|---|
| Comparison with Poisson distribution Blue bars denote a histogram of data divided into 1 sec bins. Red curve is a Poisson curve with rate = median count rate of data. |
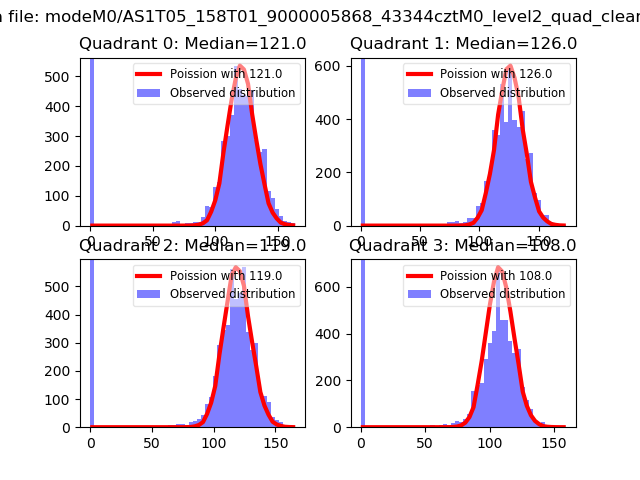 |
 |
| Quadrant-wise count rates Data is divided into 100 sec bins |
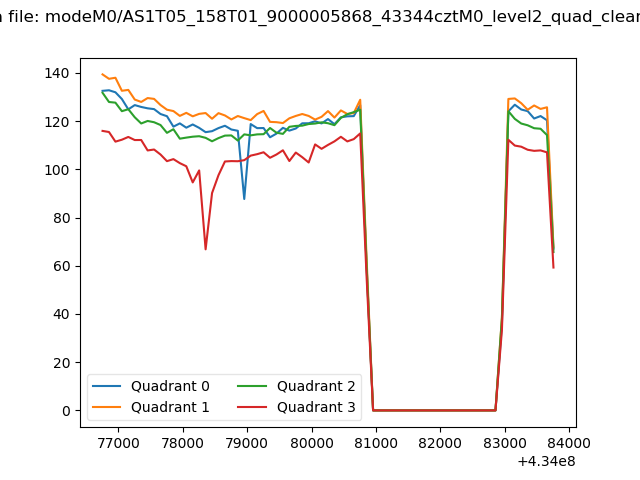 |
|
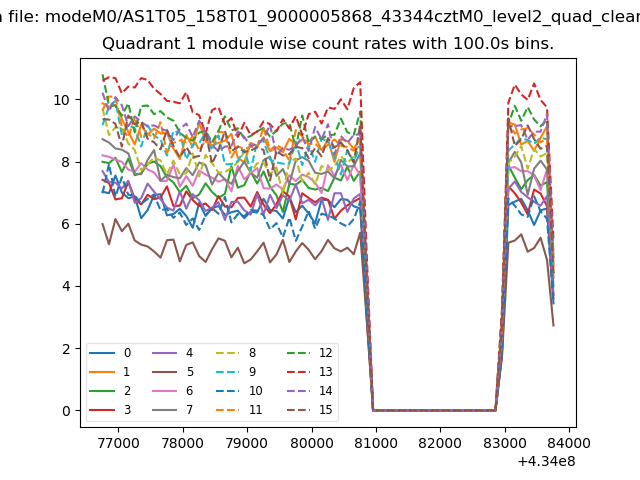
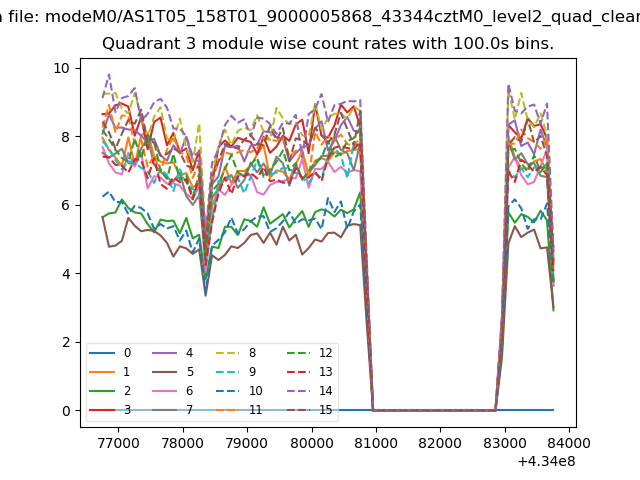
| Module-wise count rates for Quadrant A Data is divided into 100 sec bins |
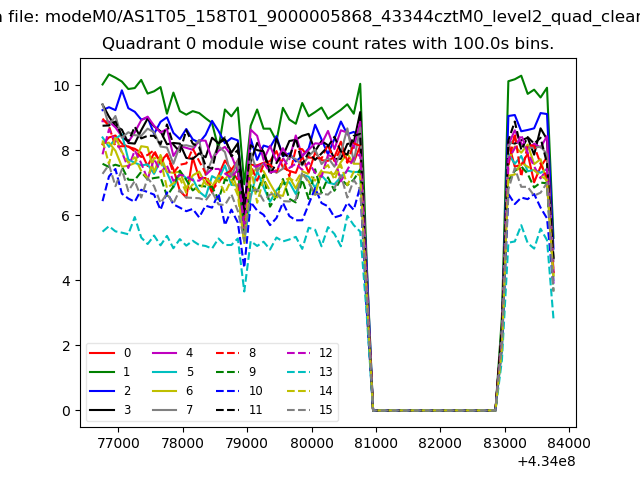 |
 |
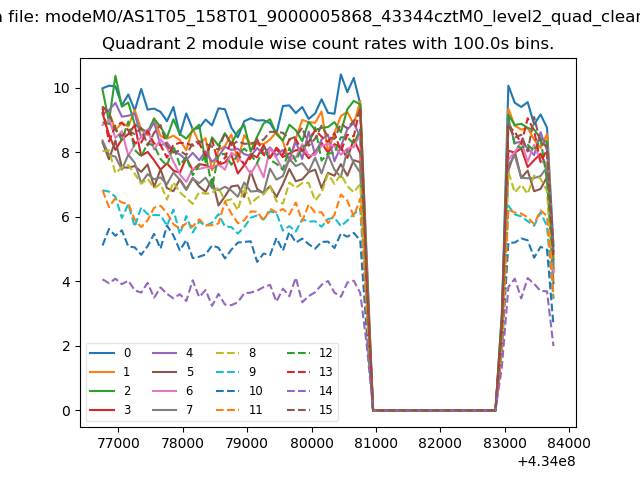
| Module-wise count rates for Quadrant B Data is divided into 100 sec bins |
 |
 |
| Module-wise count rates for Quadrant C Data is divided into 100 sec bins |
 |
 |
| Module-wise count rates for Quadrant D Data is divided into 100 sec bins |
 |
 |
| Parameter | Plot |
|---|---|
| CZT HV Monitor | 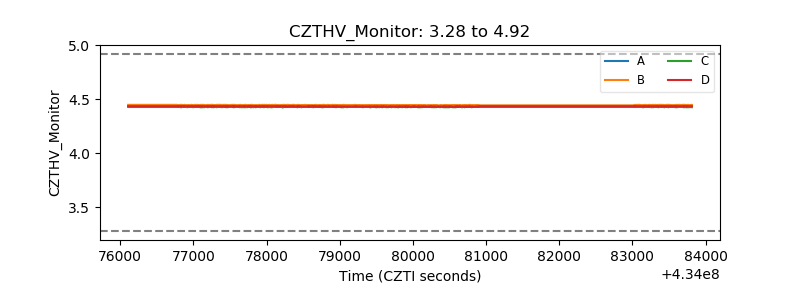 |
| D_VDD | 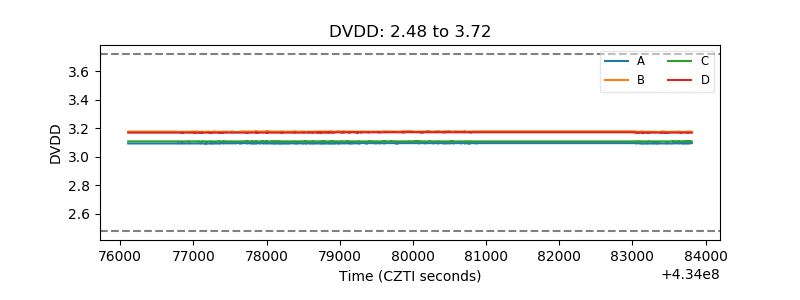 |
| Temperature 1 | 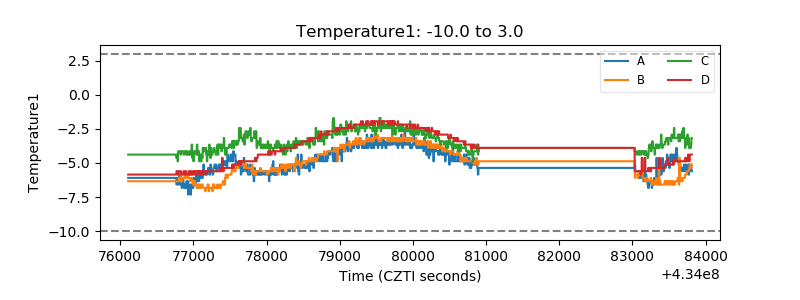 |
| Veto HV Monitor | 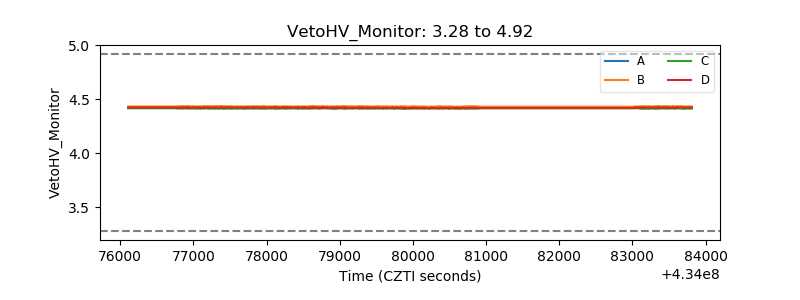 |
| Veto LLD | 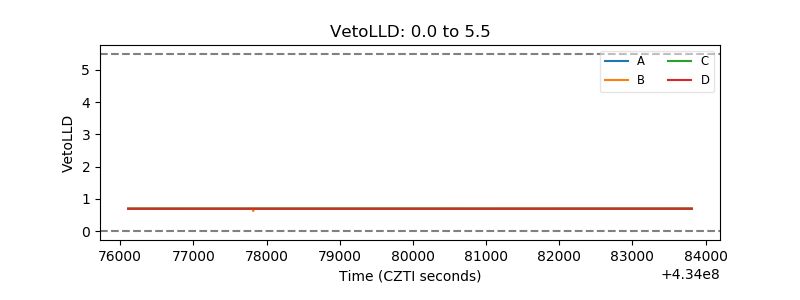 |
| Alpha Counter | 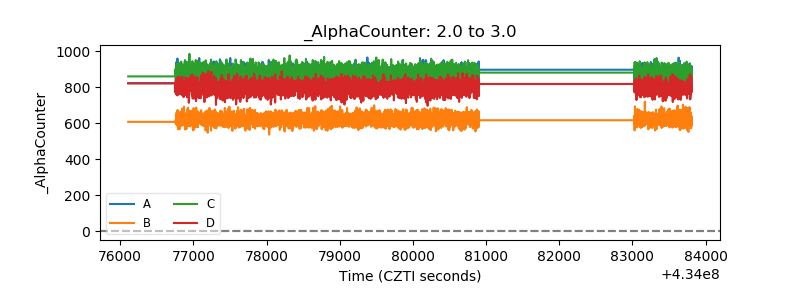 |
| _CPM_Rate | 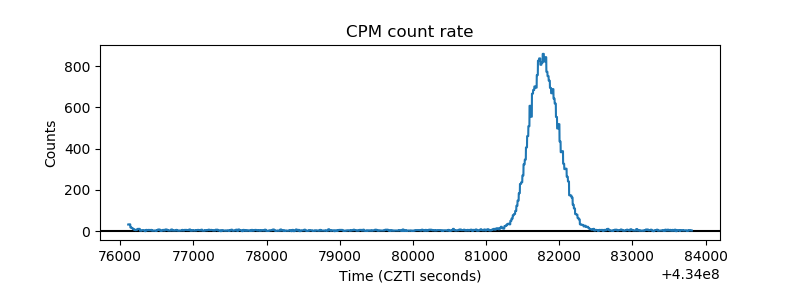 |
| CZT Counter | 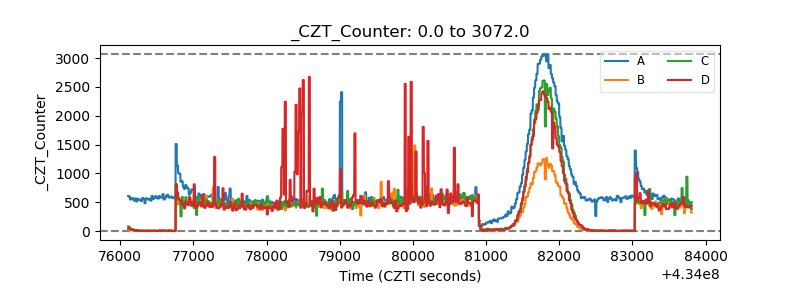 |
| +2.5 Volts monitor | 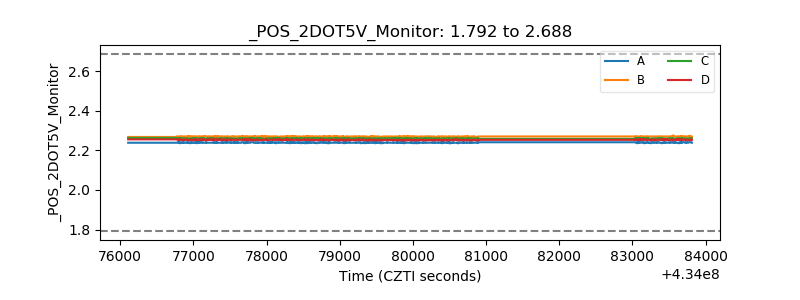 |
| +5 Volts monitor | 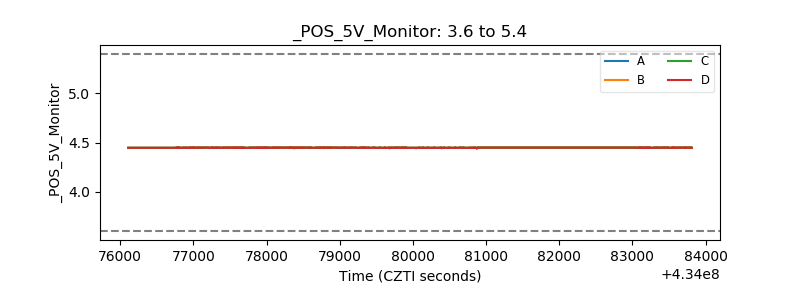 |
| _ROLL_ROT | 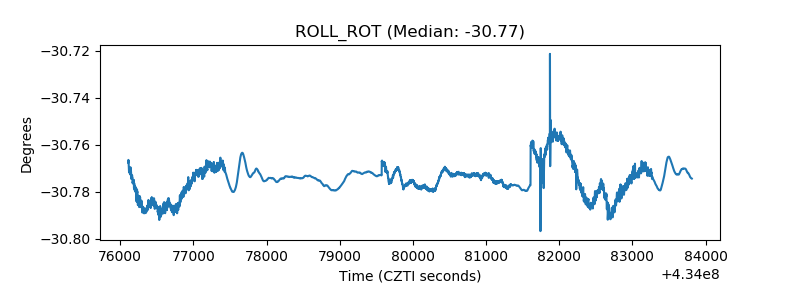 |
| _Roll_DEC | 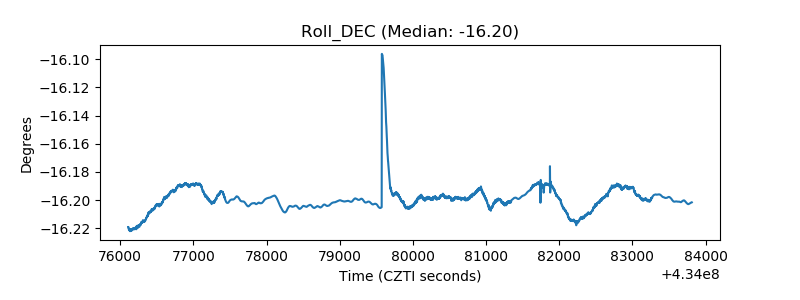 |
| _Roll_RA | 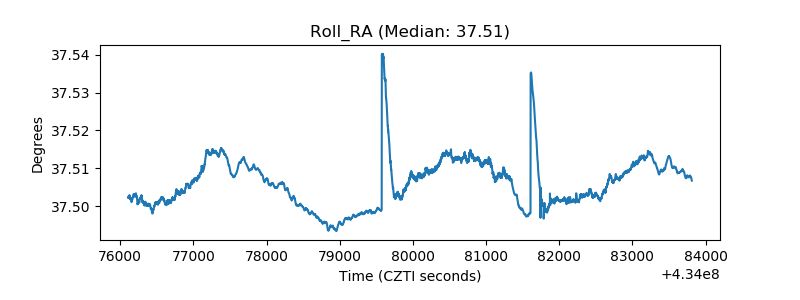 |
| Veto Counter | 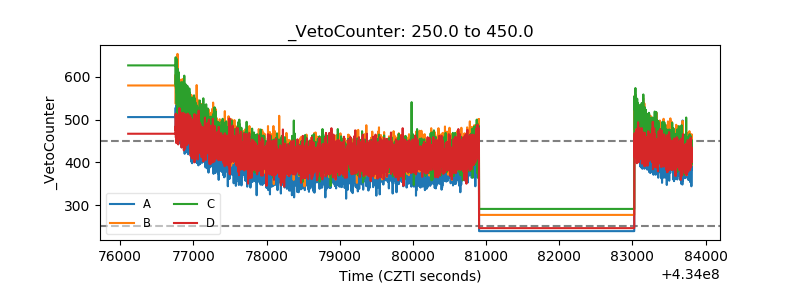 |