| Param | Original file | Final file |
|---|---|---|
| Filename | modeM0/AS1T05_158T01_9000005868_43346cztM0_level2.fits | modeM0/AS1T05_158T01_9000005868_43346cztM0_level2_quad_clean.evt |
| Size (bytes) | 287,982,720 | 83,721,600 |
| Size | 274.6 MB | 79.8 MB |
| Events in quadrant A | 2,907,955 | 558,178 |
| Events in quadrant B | 2,424,109 | 574,645 |
| Events in quadrant C | 2,385,839 | 550,030 |
| Events in quadrant D | 2,554,725 | 503,880 |
| Mode M0 | |||
|---|---|---|---|
| Quadrant | BADHDUFLAG | Total packets | Discarded packets |
| A | 0 | 11482 | 2 |
| B | 0 | 10318 | 2 |
| C | 0 | 10001 | 2 |
| D | 0 | 10995 | 2 |
| Mode M9 | |||
|---|---|---|---|
| Quadrant | BADHDUFLAG | Total packets | Discarded packets |
| A | 0 | 21 | 0 |
| B | 0 | 22 | 0 |
| C | 0 | 22 | 0 |
| D | 0 | 22 | 0 |
| Mode SS | |||
|---|---|---|---|
| Quadrant | BADHDUFLAG | Total packets | Discarded packets |
| A | 0 | 102 | 0 |
| B | 0 | 102 | 0 |
| C | 0 | 102 | 0 |
| D | 0 | 102 | 0 |
| Quadrant | Total seconds | Saturated seconds | Saturation percentage |
|---|---|---|---|
| A | 4967 | 51 | 1.026777% |
| B | 4967 | 10 | 0.201329% |
| C | 4967 | 4 | 0.080532% |
| D | 4966 | 48 | 0.966573% |
Noise dominated data is calculated using 1-second bins in cleaned event files. If a bin has >2000 counts, and if more than 50% of those come from <1% of pixels, then it is considered to be noise-dominated and hence unusable.
| Quadrant | # 1 sec bins | Bins with >0 counts | Bins with >2000 counts | High rate bins dominated by noise | Noise dominated (total time) | Noise dominated (detector-on time) | Marked lightcurve |
|---|---|---|---|---|---|---|---|
| A | 6969 | 4968 | 29 | 29 | 0.42% | 0.58% | 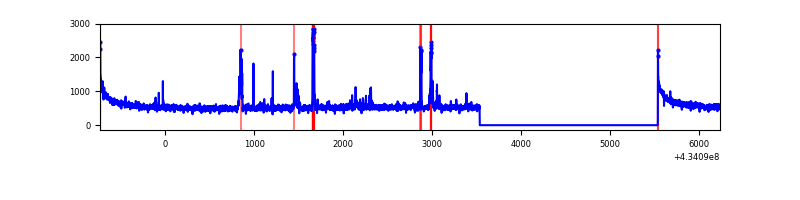 |
| B | 6969 | 4968 | 0 | 0 | 0.00% | 0.00% | 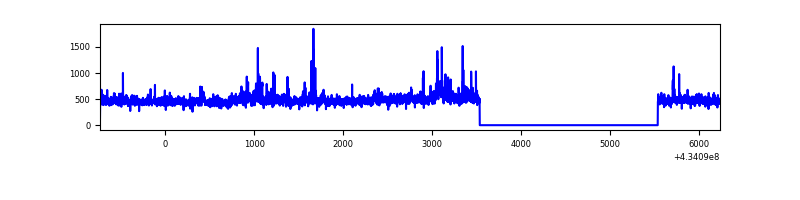 |
| C | 6969 | 4968 | 0 | 0 | 0.00% | 0.00% | 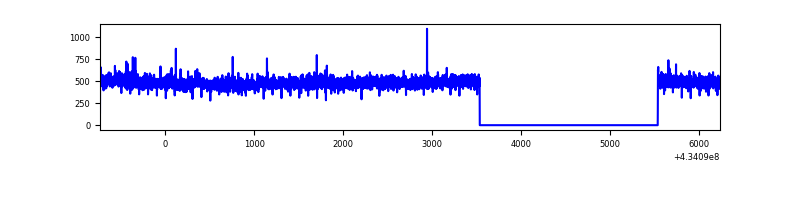 |
| D | 6968 | 4967 | 43 | 43 | 0.62% | 0.87% | 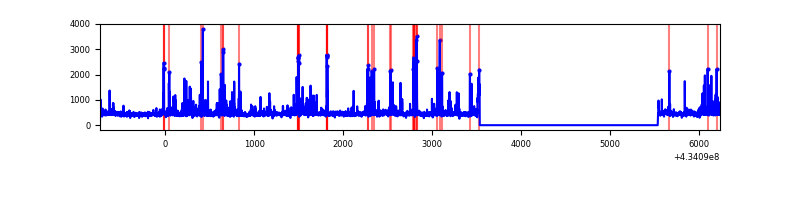 |
Top three noisy pixels from each quadrant. If the there are fewer than three noisy pixels in the level2.evt file, extra rows are filled as -1
| Pixel properties | Quadrant properties | ||||||
|---|---|---|---|---|---|---|---|
| Quadrant | DetID | PixID | Counts | Sigma | Mean | Median | Sigma |
| A | 10 | 83 | 528133 | 4517.04 | 564 | 553 | 116.8 |
| A | 15 | 237 | 191303 | 1633.17 | 564 | 553 | 116.8 |
| A | 3 | 137 | 6434 | 50.35 | 564 | 553 | 116.8 |
| B | 0 | 189 | 159586 | 1446.28 | 558 | 541 | 110.0 |
| B | 3 | 112 | 30492 | 272.36 | 558 | 541 | 110.0 |
| B | 0 | 245 | 19653 | 173.8 | 558 | 541 | 110.0 |
| C | 15 | 214 | 211298 | 1610.7 | 553 | 558 | 130.8 |
| C | 15 | 111 | 6961 | 48.94 | 553 | 558 | 130.8 |
| C | 3 | 233 | 5749 | 39.68 | 553 | 558 | 130.8 |
| D | 13 | 249 | 177310 | 1294.21 | 553 | 536 | 136.6 |
| D | 12 | 6 | 78157 | 568.28 | 553 | 536 | 136.6 |
| D | 2 | 249 | 70181 | 509.89 | 553 | 536 | 136.6 |
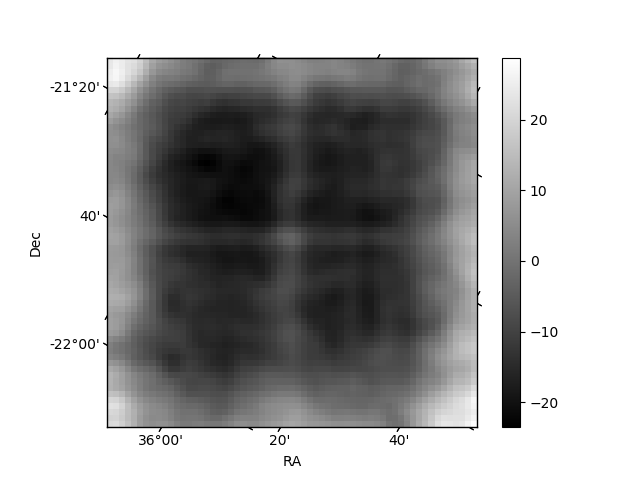
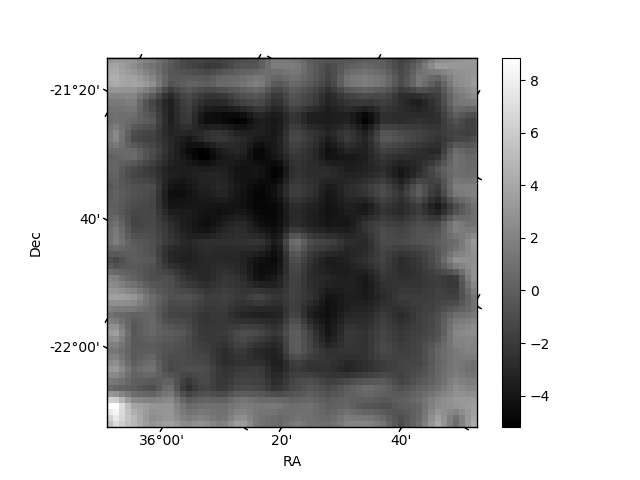
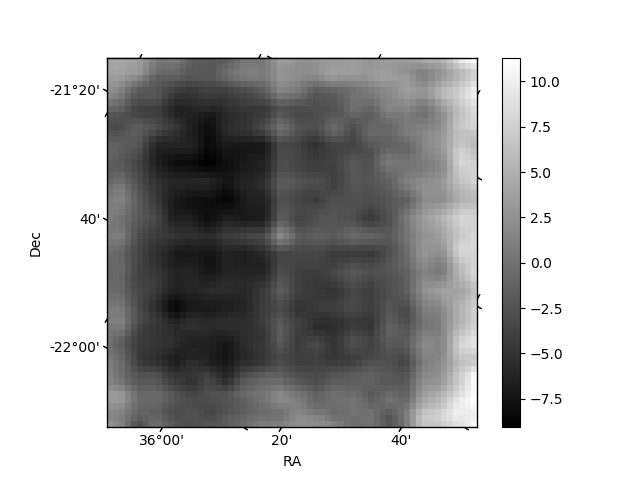
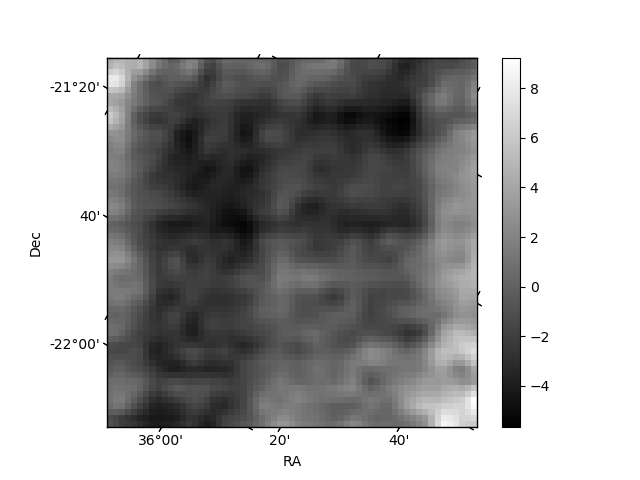
Histogram calculated using DETX and DETY for each event in the final _common_clean file
| Quadrant A | 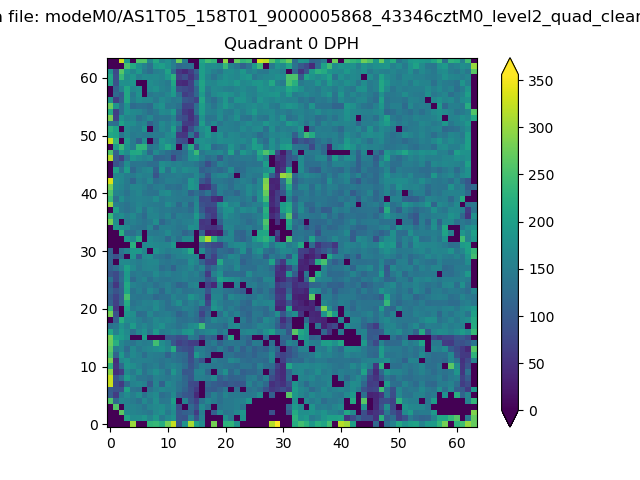 |
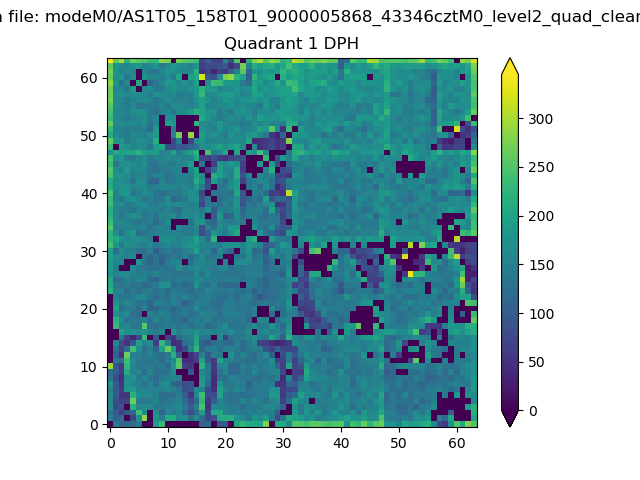 |
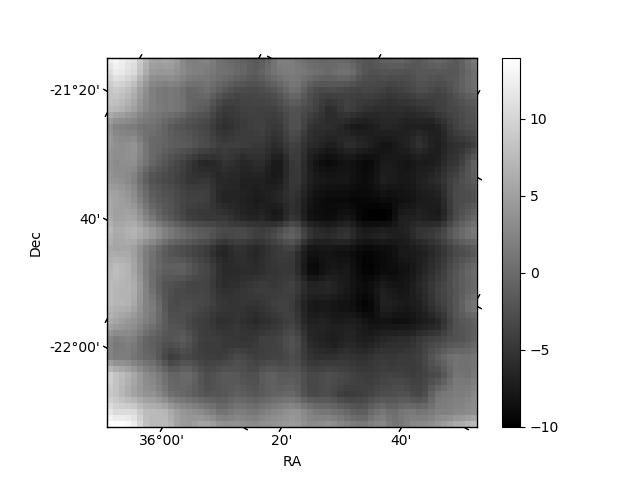
Quadrant B |
|---|---|---|---|
| Quadrant D | 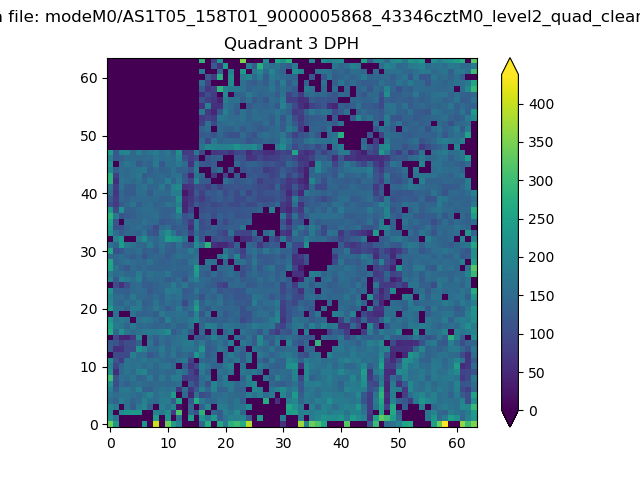 |
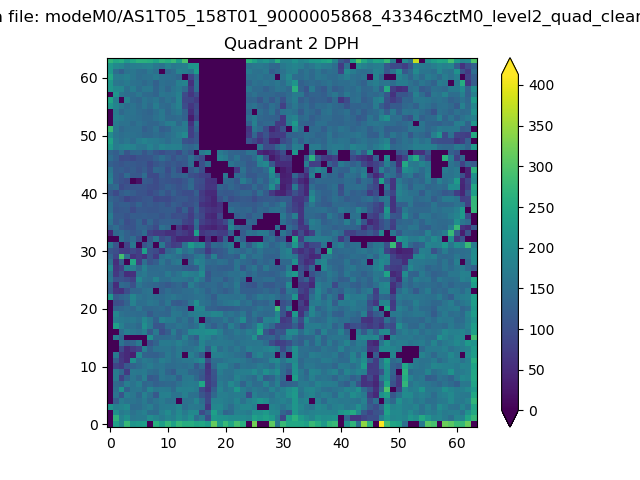 |
Quadrant C |
| Plot type | Count rate plots | Images |
|---|---|---|
| Comparison with Poisson distribution Blue bars denote a histogram of data divided into 1 sec bins. Red curve is a Poisson curve with rate = median count rate of data. |
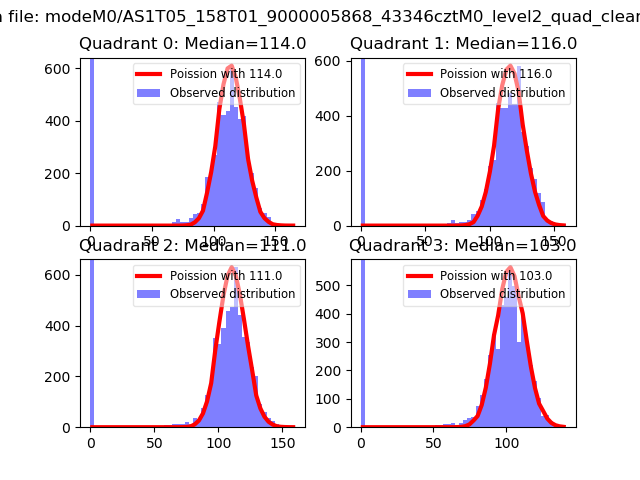 |
 |
| Quadrant-wise count rates Data is divided into 100 sec bins |
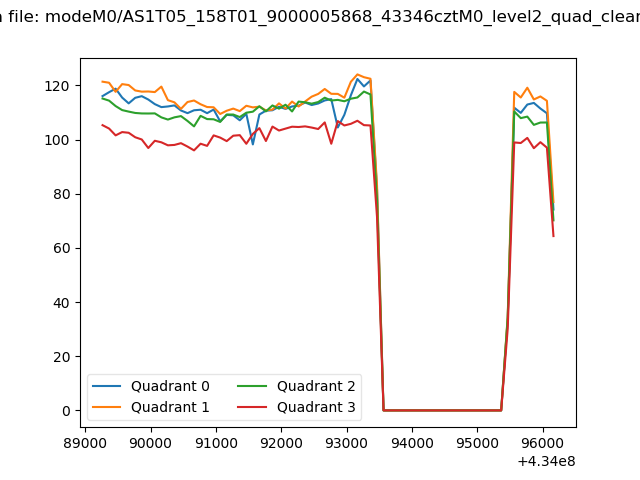 |
|
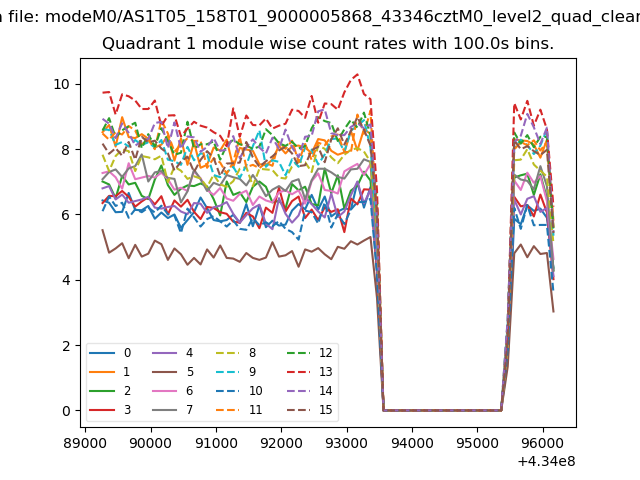
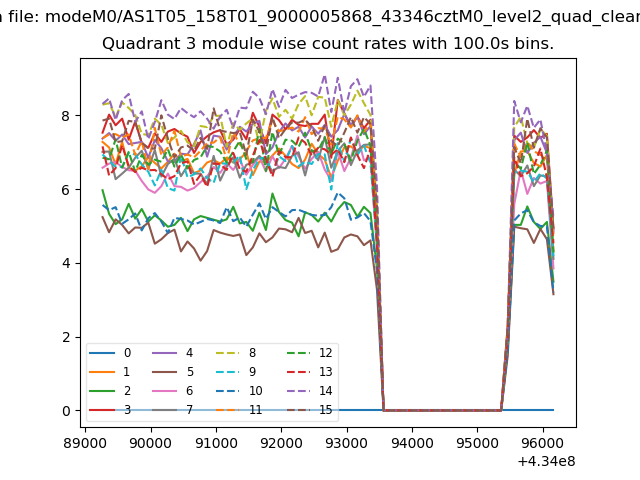
| Module-wise count rates for Quadrant A Data is divided into 100 sec bins |
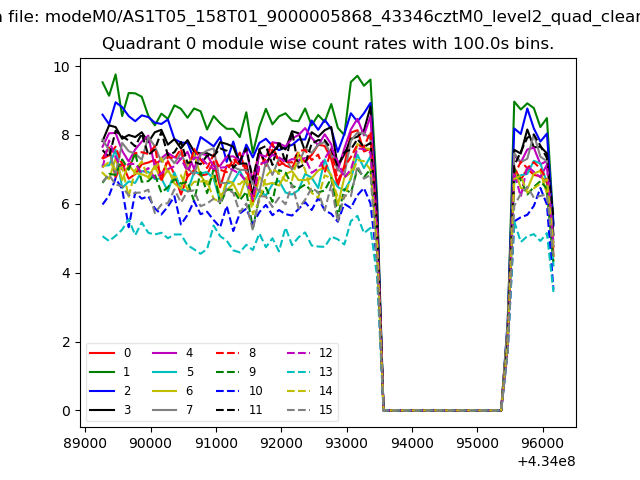 |
 |
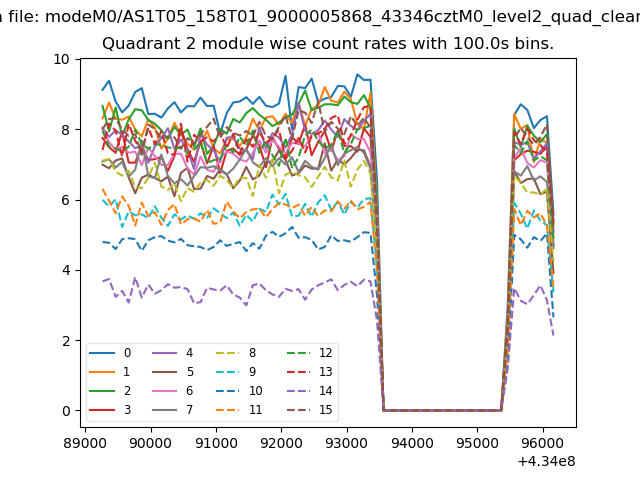
| Module-wise count rates for Quadrant B Data is divided into 100 sec bins |
 |
 |
| Module-wise count rates for Quadrant C Data is divided into 100 sec bins |
 |
 |
| Module-wise count rates for Quadrant D Data is divided into 100 sec bins |
 |
 |
| Parameter | Plot |
|---|---|
| CZT HV Monitor | 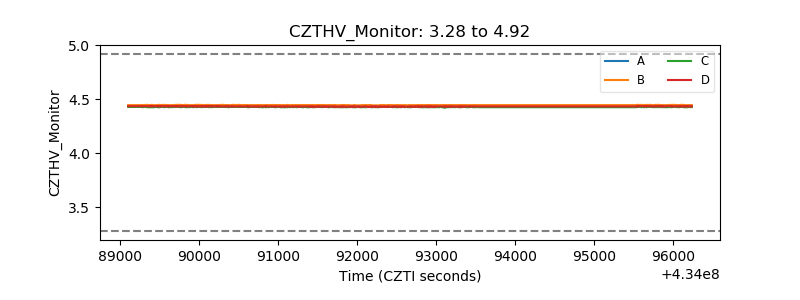 |
| D_VDD | 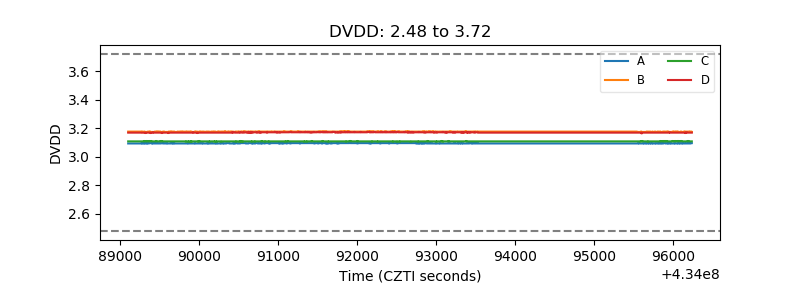 |
| Temperature 1 | 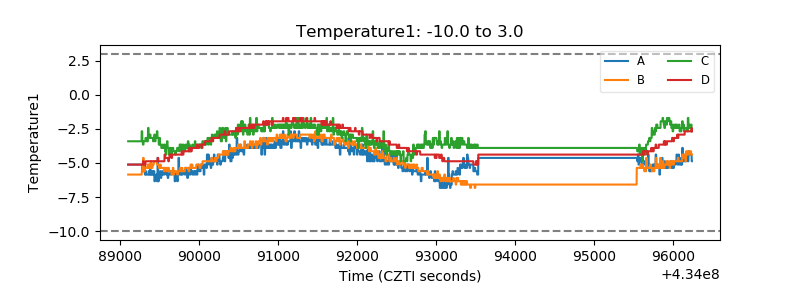 |
| Veto HV Monitor | 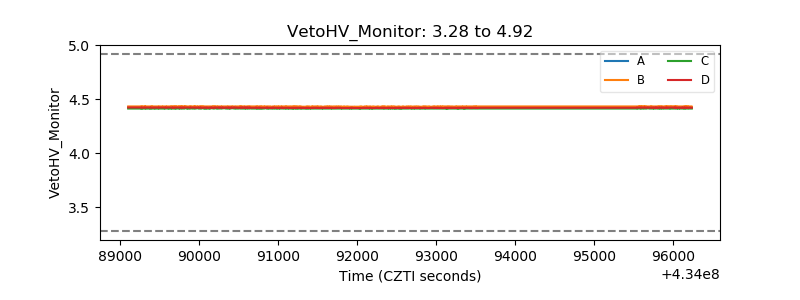 |
| Veto LLD | 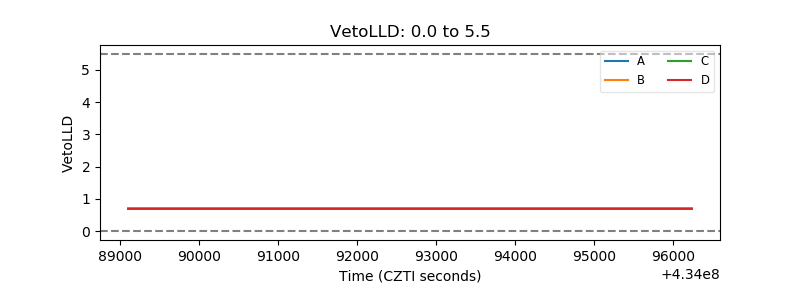 |
| Alpha Counter | 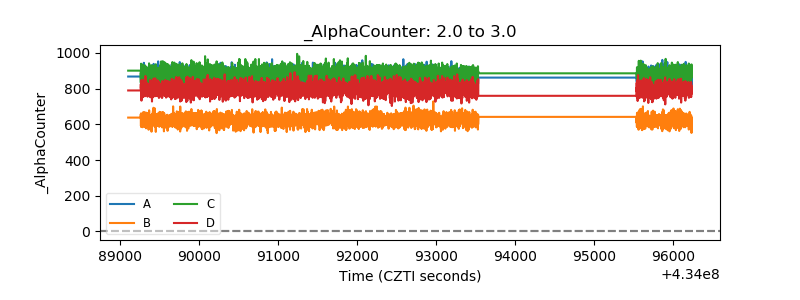 |
| _CPM_Rate | 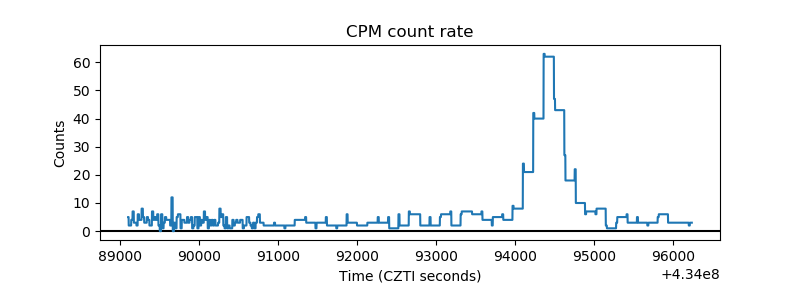 |
| CZT Counter | 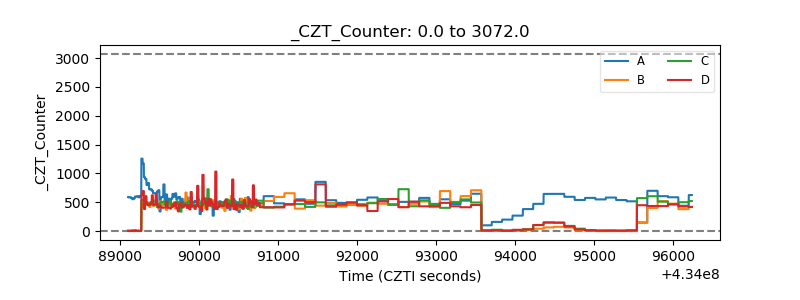 |
| +2.5 Volts monitor | 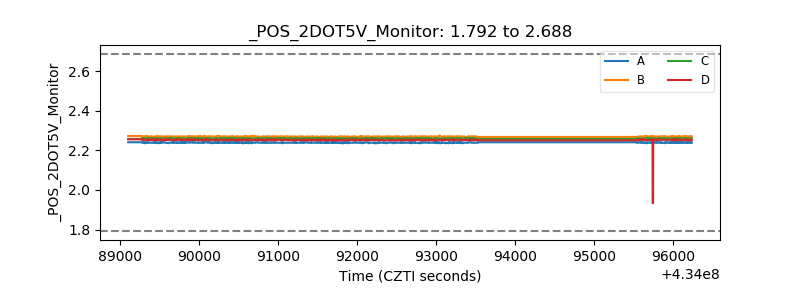 |
| +5 Volts monitor | 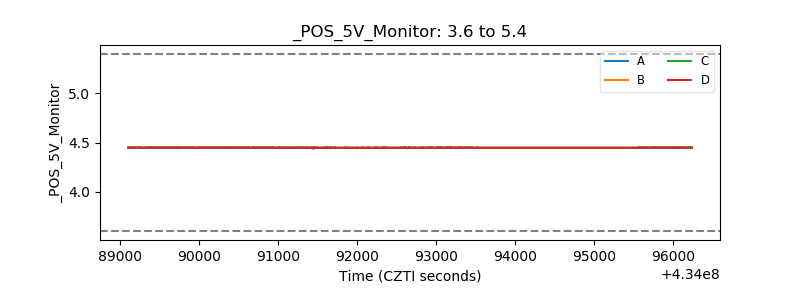 |
| _ROLL_ROT | 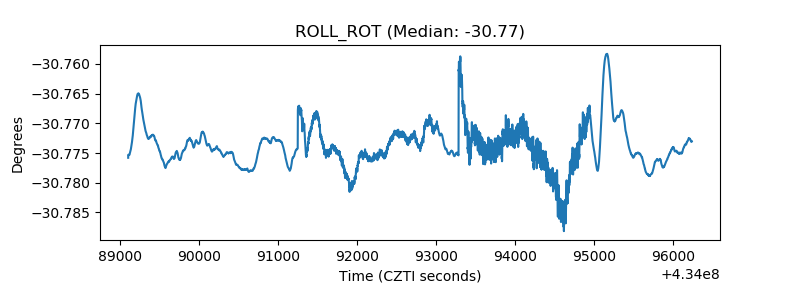 |
| _Roll_DEC | 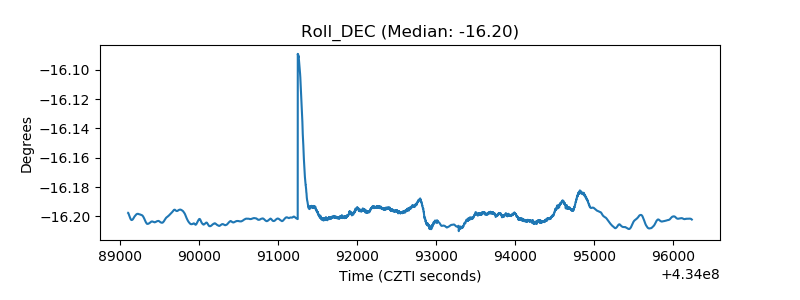 |
| _Roll_RA | 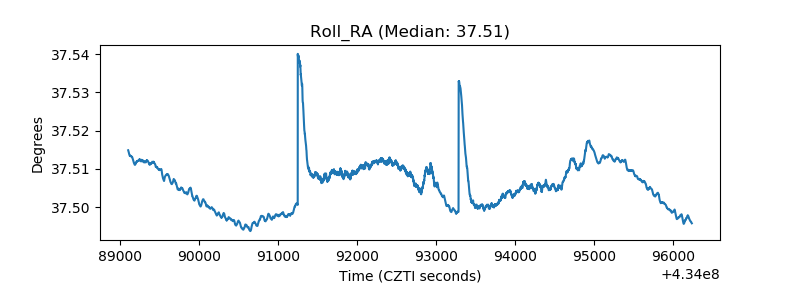 |
| Veto Counter | 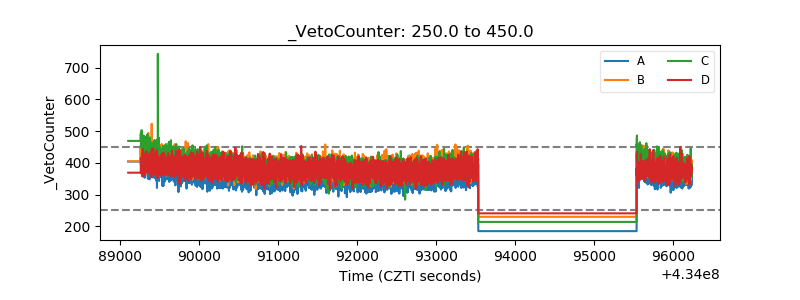 |