| Param | Original file | Final file |
|---|---|---|
| Filename | modeM0/AS1T05_158T01_9000005868_43347cztM0_level2.fits | modeM0/AS1T05_158T01_9000005868_43347cztM0_level2_quad_clean.evt |
| Size (bytes) | 322,511,040 | 88,274,880 |
| Size | 307.6 MB | 84.2 MB |
| Events in quadrant A | 3,342,456 | 579,163 |
| Events in quadrant B | 2,689,823 | 604,722 |
| Events in quadrant C | 2,664,210 | 580,515 |
| Events in quadrant D | 2,822,614 | 531,911 |
| Mode M0 | |||
|---|---|---|---|
| Quadrant | BADHDUFLAG | Total packets | Discarded packets |
| A | 0 | 13030 | 2 |
| B | 0 | 11475 | 2 |
| C | 0 | 11156 | 2 |
| D | 0 | 12141 | 2 |
| Mode M9 | |||
|---|---|---|---|
| Quadrant | BADHDUFLAG | Total packets | Discarded packets |
| A | 0 | 24 | 0 |
| B | 0 | 25 | 0 |
| C | 0 | 25 | 0 |
| D | 0 | 25 | 0 |
| Mode SS | |||
|---|---|---|---|
| Quadrant | BADHDUFLAG | Total packets | Discarded packets |
| A | 0 | 110 | 0 |
| B | 0 | 110 | 0 |
| C | 0 | 110 | 0 |
| D | 0 | 110 | 0 |
| Quadrant | Total seconds | Saturated seconds | Saturation percentage |
|---|---|---|---|
| A | 5378 | 161 | 2.993678% |
| B | 5378 | 37 | 0.687988% |
| C | 5378 | 9 | 0.167348% |
| D | 5378 | 70 | 1.301599% |
Noise dominated data is calculated using 1-second bins in cleaned event files. If a bin has >2000 counts, and if more than 50% of those come from <1% of pixels, then it is considered to be noise-dominated and hence unusable.
| Quadrant | # 1 sec bins | Bins with >0 counts | Bins with >2000 counts | High rate bins dominated by noise | Noise dominated (total time) | Noise dominated (detector-on time) | Marked lightcurve |
|---|---|---|---|---|---|---|---|
| A | 7111 | 5379 | 138 | 138 | 1.94% | 2.57% | 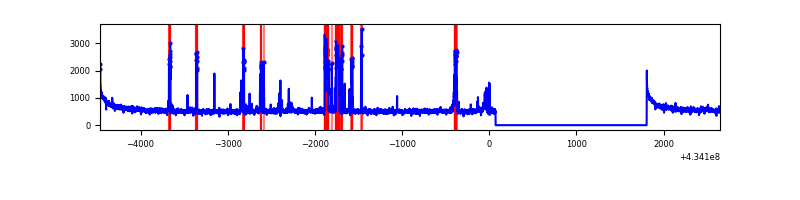 |
| B | 7111 | 5379 | 22 | 22 | 0.31% | 0.41% | 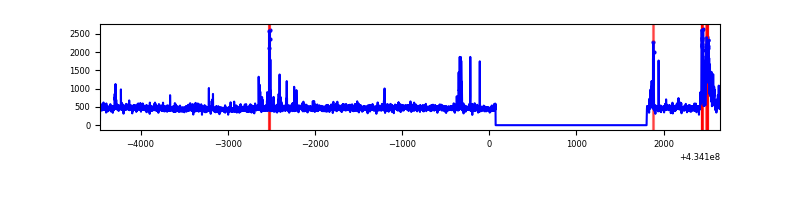 |
| C | 7111 | 5379 | 5 | 5 | 0.07% | 0.09% | 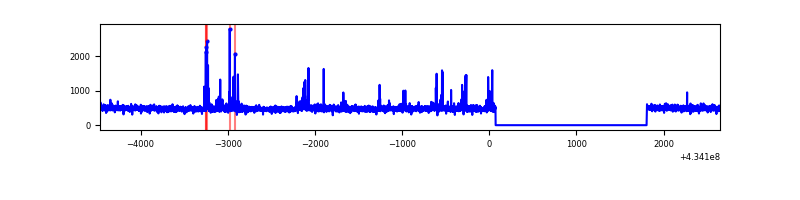 |
| D | 7111 | 5379 | 67 | 67 | 0.94% | 1.25% | 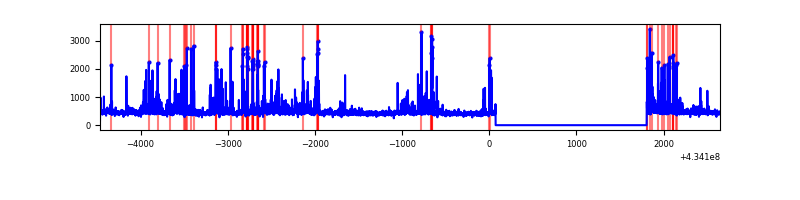 |
Top three noisy pixels from each quadrant. If the there are fewer than three noisy pixels in the level2.evt file, extra rows are filled as -1
| Pixel properties | Quadrant properties | ||||||
|---|---|---|---|---|---|---|---|
| Quadrant | DetID | PixID | Counts | Sigma | Mean | Median | Sigma |
| A | 10 | 83 | 553523 | 4476.3 | 594 | 582 | 123.5 |
| A | 15 | 237 | 484848 | 3920.35 | 594 | 582 | 123.5 |
| A | 3 | 137 | 6685 | 49.41 | 594 | 582 | 123.5 |
| B | 0 | 189 | 177815 | 1507.31 | 598 | 581 | 117.6 |
| B | 0 | 245 | 55180 | 464.34 | 598 | 581 | 117.6 |
| B | 3 | 112 | 51051 | 429.23 | 598 | 581 | 117.6 |
| C | 15 | 214 | 224466 | 1613.58 | 591 | 595 | 138.7 |
| C | 14 | 254 | 119295 | 855.55 | 591 | 595 | 138.7 |
| C | 15 | 111 | 8209 | 54.88 | 591 | 595 | 138.7 |
| D | 13 | 249 | 146343 | 999.29 | 590 | 572 | 145.9 |
| D | 12 | 6 | 107912 | 735.84 | 590 | 572 | 145.9 |
| D | 2 | 249 | 101414 | 691.29 | 590 | 572 | 145.9 |
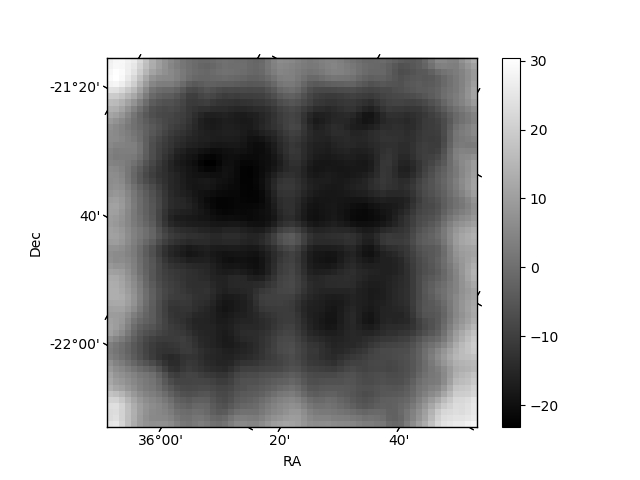
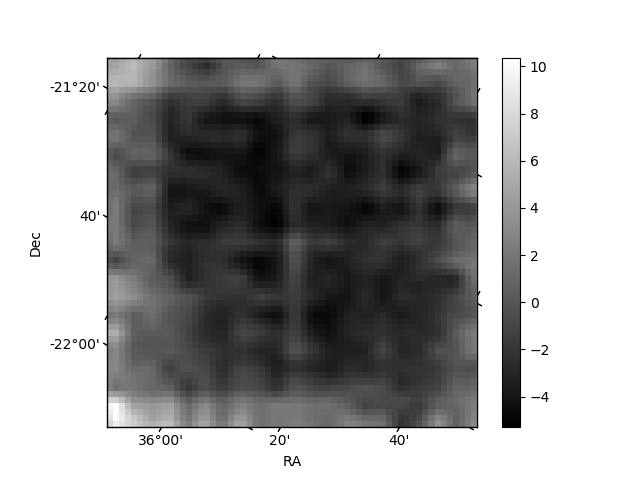
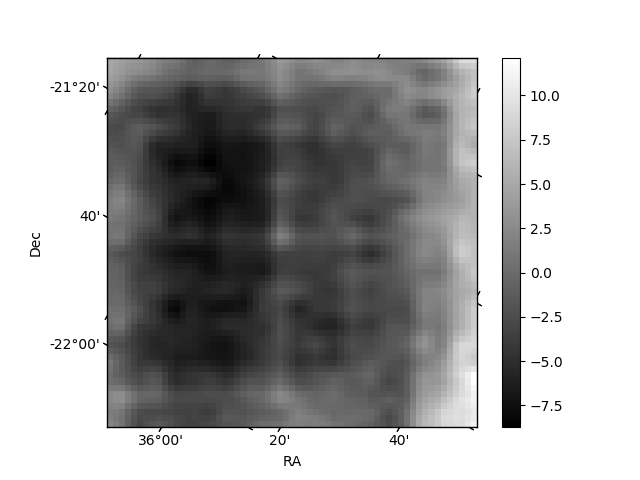
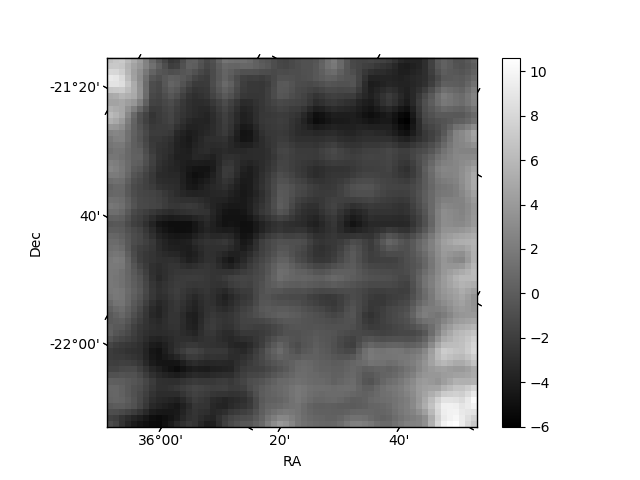
Histogram calculated using DETX and DETY for each event in the final _common_clean file
| Quadrant A | 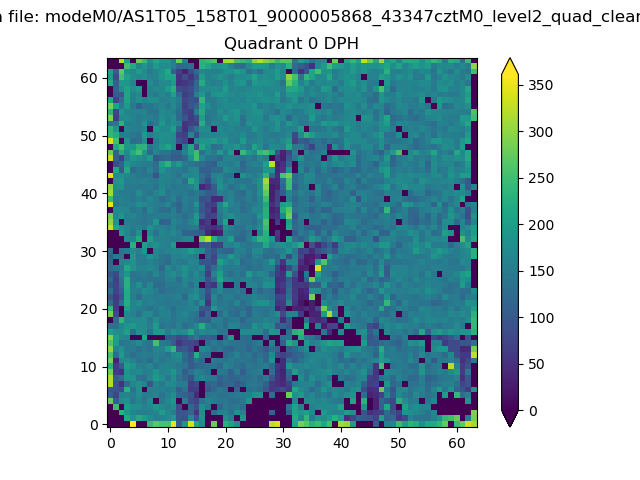 |
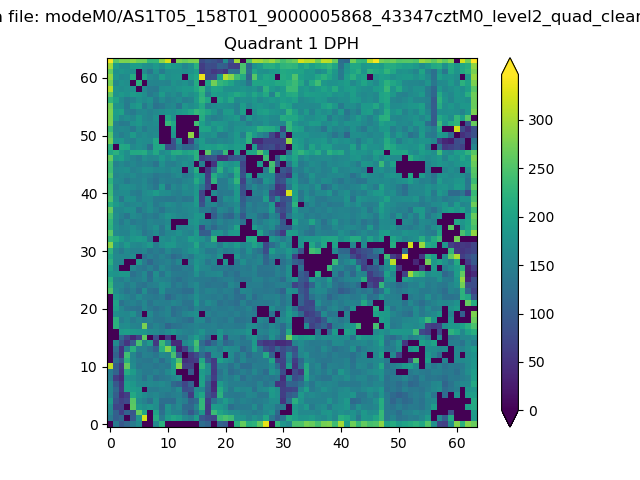 |
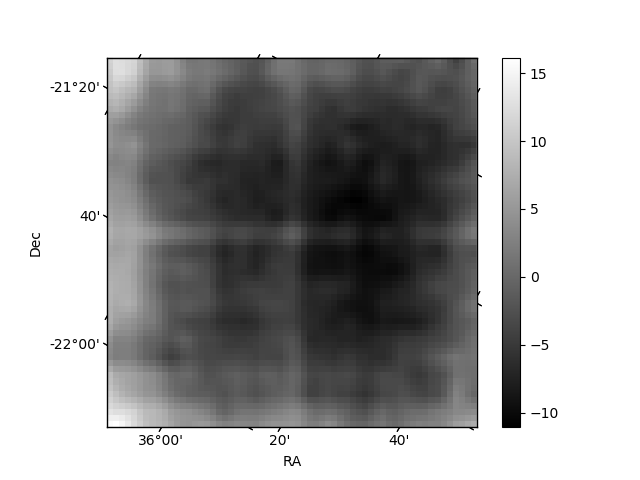
Quadrant B |
|---|---|---|---|
| Quadrant D | 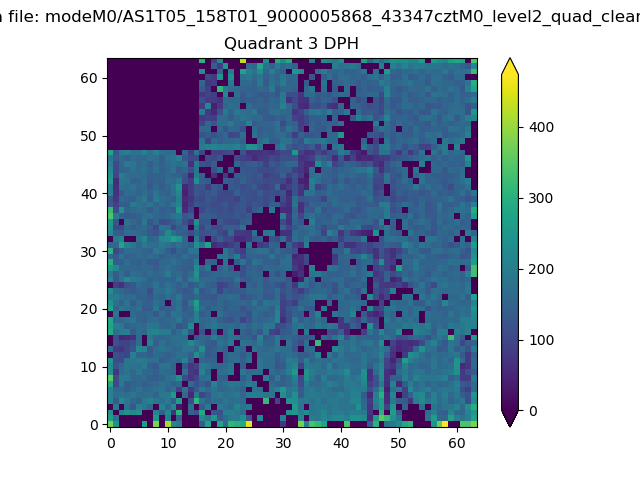 |
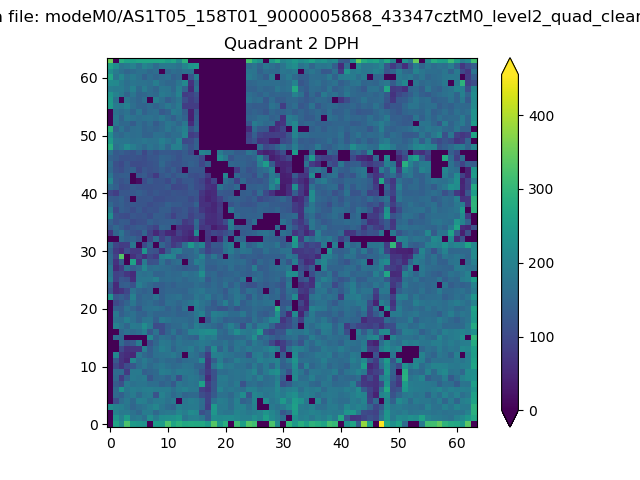 |
Quadrant C |
| Plot type | Count rate plots | Images |
|---|---|---|
| Comparison with Poisson distribution Blue bars denote a histogram of data divided into 1 sec bins. Red curve is a Poisson curve with rate = median count rate of data. |
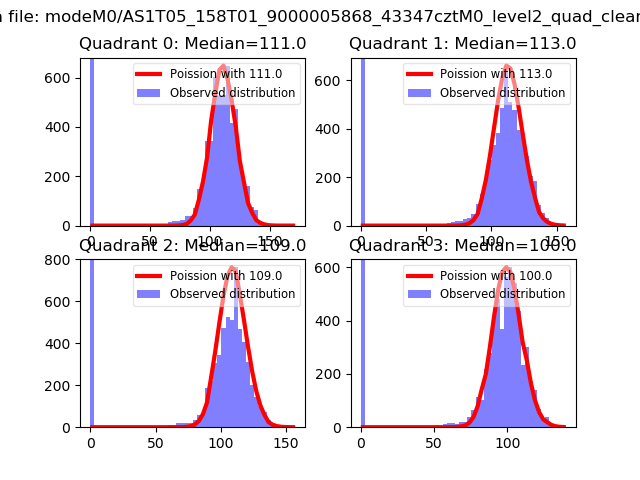 |
 |
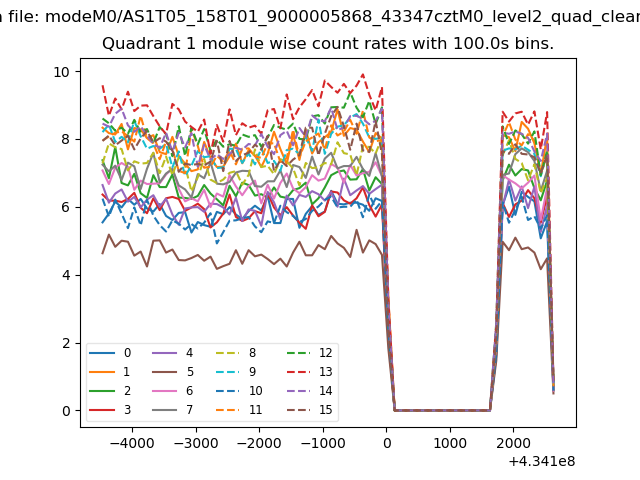
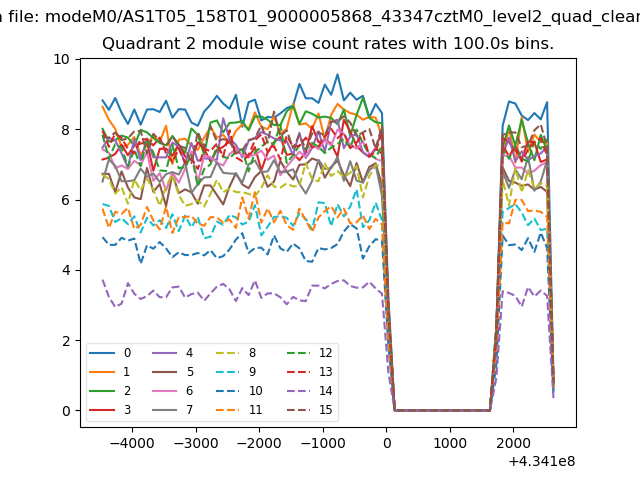
| Quadrant-wise count rates Data is divided into 100 sec bins |
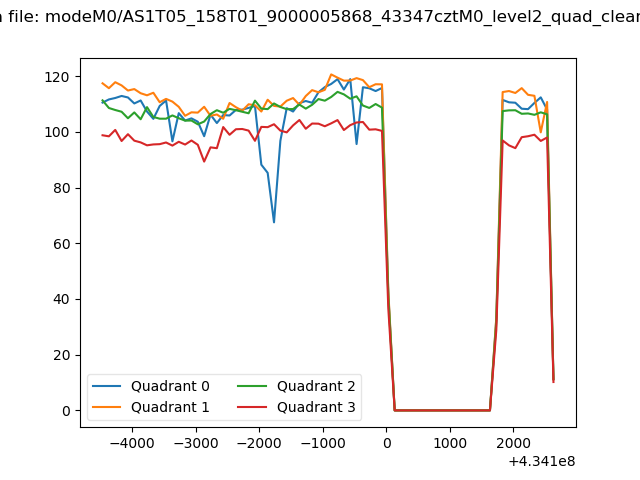 |
|
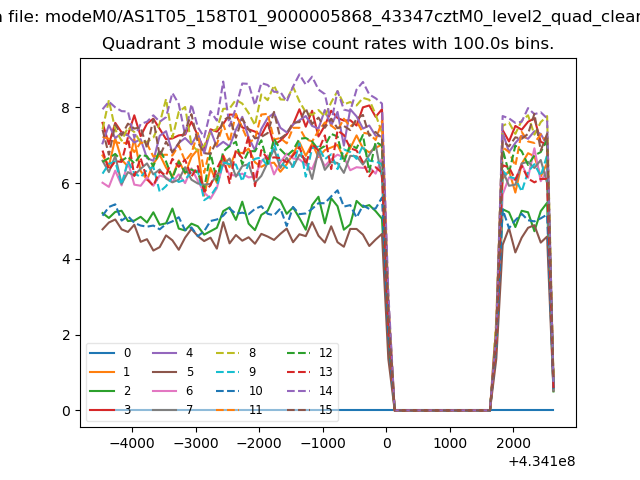
| Module-wise count rates for Quadrant A Data is divided into 100 sec bins |
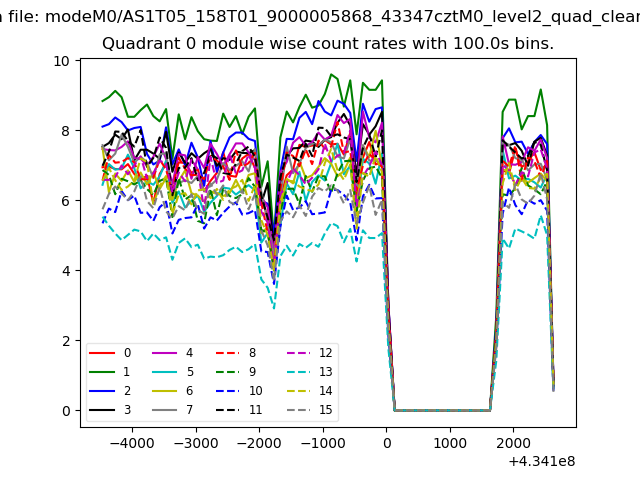 |
 |
| Module-wise count rates for Quadrant B Data is divided into 100 sec bins |
 |
 |
| Module-wise count rates for Quadrant C Data is divided into 100 sec bins |
 |
 |
| Module-wise count rates for Quadrant D Data is divided into 100 sec bins |
 |
 |
| Parameter | Plot |
|---|---|
| CZT HV Monitor | 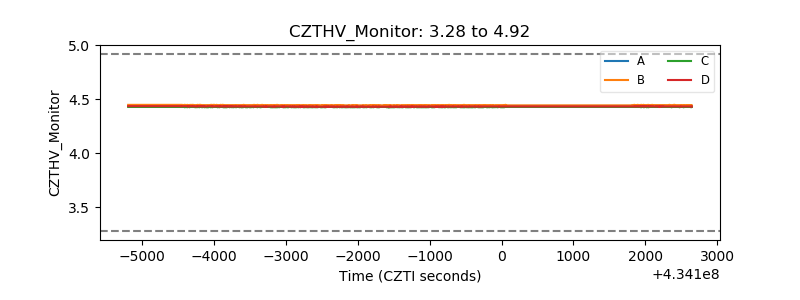 |
| D_VDD | 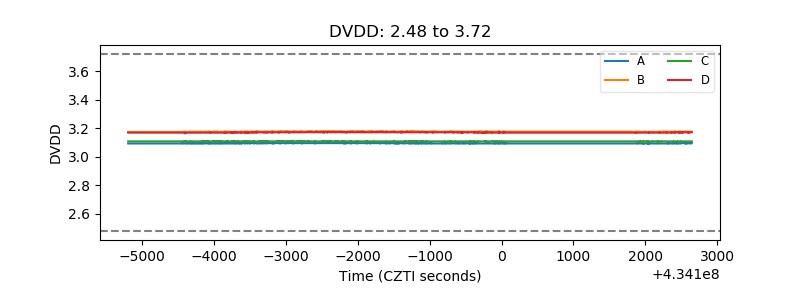 |
| Temperature 1 | 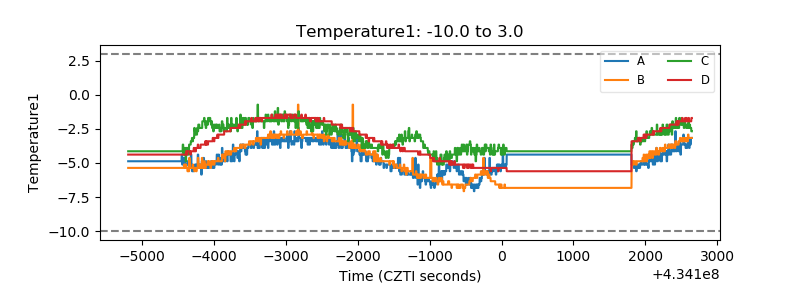 |
| Veto HV Monitor | 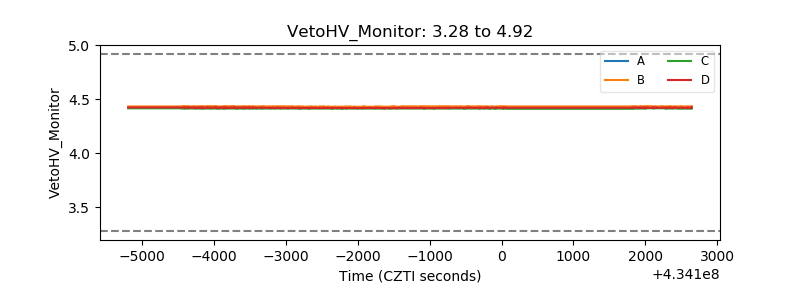 |
| Veto LLD | 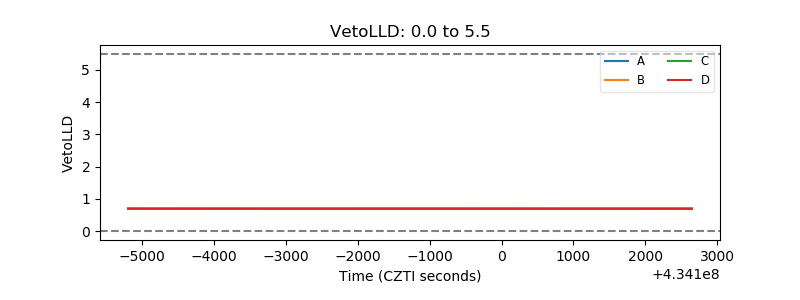 |
| Alpha Counter | 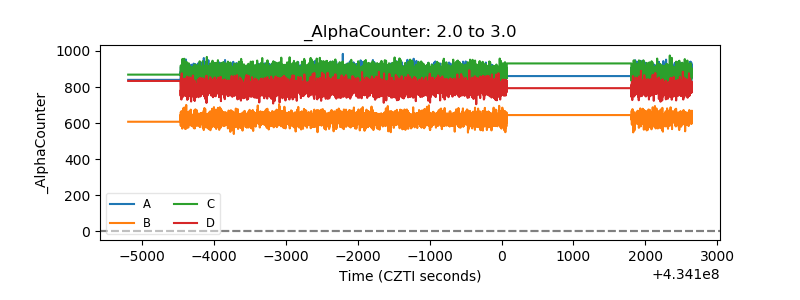 |
| _CPM_Rate | 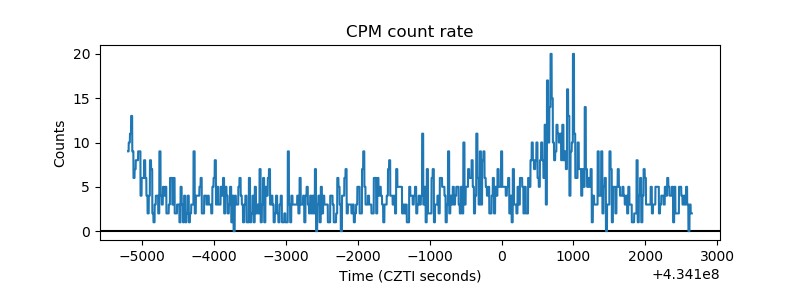 |
| CZT Counter | 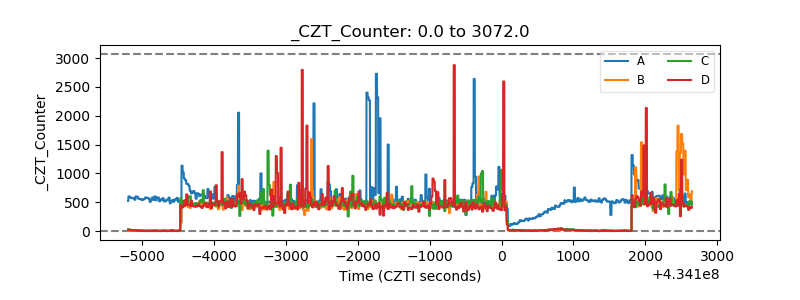 |
| +2.5 Volts monitor | 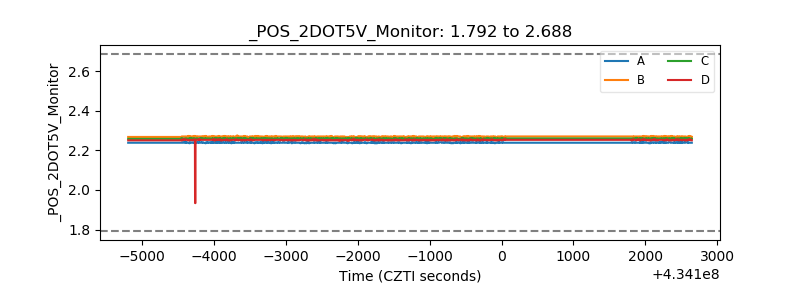 |
| +5 Volts monitor | 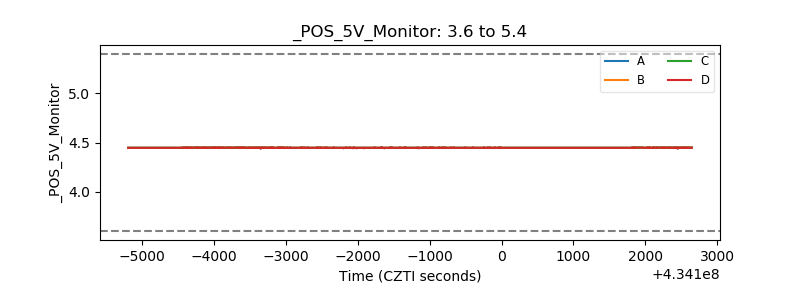 |
| _ROLL_ROT | 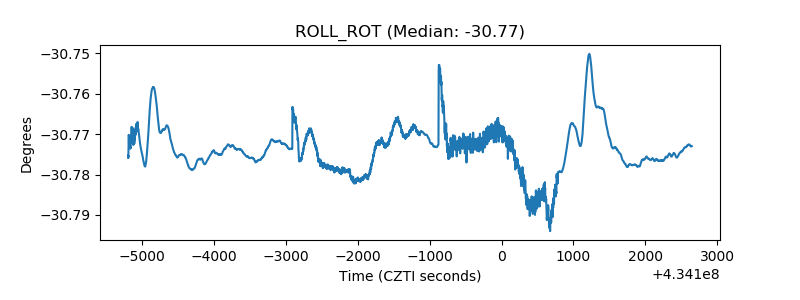 |
| _Roll_DEC |  |
| _Roll_RA | 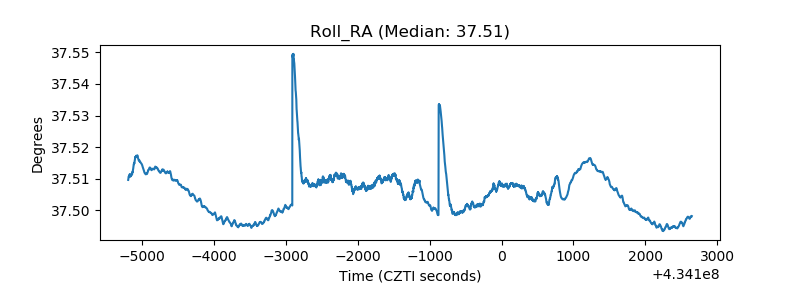 |
| Veto Counter | 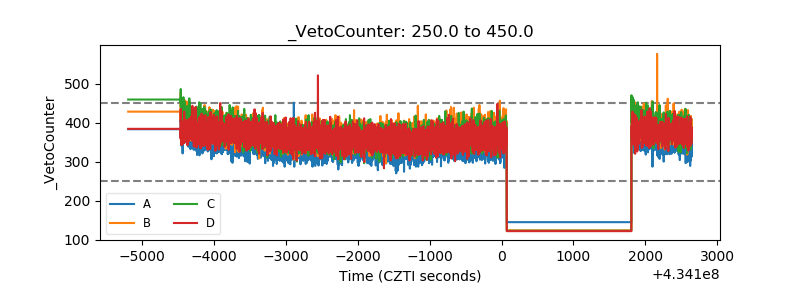 |