| Param | Original file | Final file |
|---|---|---|
| Filename | modeM0/AS1T05_158T01_9000005868_43348cztM0_level2.fits | modeM0/AS1T05_158T01_9000005868_43348cztM0_level2_quad_clean.evt |
| Size (bytes) | 337,340,160 | 93,332,160 |
| Size | 321.7 MB | 89.0 MB |
| Events in quadrant A | 3,412,105 | 617,852 |
| Events in quadrant B | 2,964,381 | 635,760 |
| Events in quadrant C | 2,717,453 | 611,980 |
| Events in quadrant D | 2,946,222 | 559,003 |
| Mode M0 | |||
|---|---|---|---|
| Quadrant | BADHDUFLAG | Total packets | Discarded packets |
| A | 0 | 13538 | 2 |
| B | 0 | 12500 | 2 |
| C | 0 | 11589 | 3 |
| D | 0 | 12867 | 2 |
| Mode M9 | |||
|---|---|---|---|
| Quadrant | BADHDUFLAG | Total packets | Discarded packets |
| A | 0 | 29 | 0 |
| B | 0 | 30 | 0 |
| C | 0 | 30 | 0 |
| D | 0 | 30 | 0 |
| Mode SS | |||
|---|---|---|---|
| Quadrant | BADHDUFLAG | Total packets | Discarded packets |
| A | 0 | 118 | 0 |
| B | 0 | 118 | 0 |
| C | 0 | 118 | 0 |
| D | 0 | 118 | 0 |
| Quadrant | Total seconds | Saturated seconds | Saturation percentage |
|---|---|---|---|
| A | 5738 | 116 | 2.021610% |
| B | 5738 | 49 | 0.853956% |
| C | 5737 | 3 | 0.052292% |
| D | 5737 | 131 | 2.283423% |
Noise dominated data is calculated using 1-second bins in cleaned event files. If a bin has >2000 counts, and if more than 50% of those come from <1% of pixels, then it is considered to be noise-dominated and hence unusable.
| Quadrant | # 1 sec bins | Bins with >0 counts | Bins with >2000 counts | High rate bins dominated by noise | Noise dominated (total time) | Noise dominated (detector-on time) | Marked lightcurve |
|---|---|---|---|---|---|---|---|
| A | 7139 | 5738 | 96 | 96 | 1.34% | 1.67% | 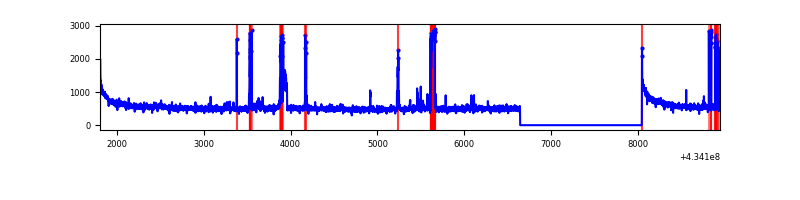 |
| B | 7140 | 5739 | 33 | 33 | 0.46% | 0.58% | 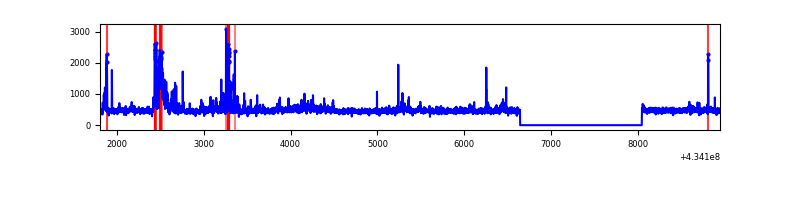 |
| C | 7139 | 5738 | 0 | 0 | 0.00% | 0.00% | 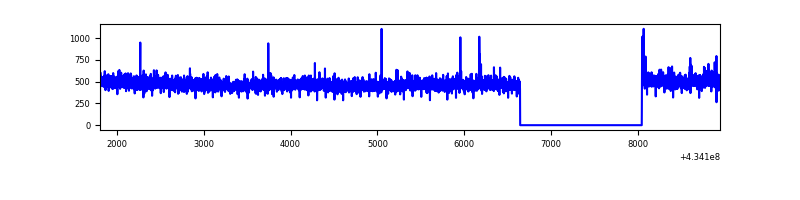 |
| D | 7139 | 5738 | 64 | 64 | 0.90% | 1.12% | 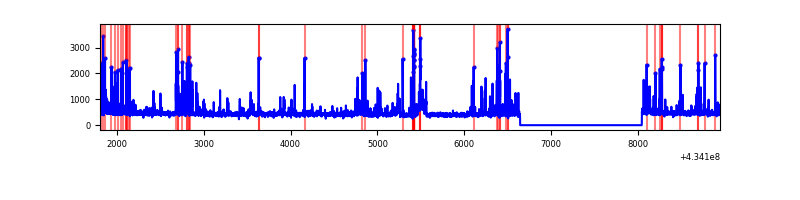 |
Top three noisy pixels from each quadrant. If the there are fewer than three noisy pixels in the level2.evt file, extra rows are filled as -1
| Pixel properties | Quadrant properties | ||||||
|---|---|---|---|---|---|---|---|
| Quadrant | DetID | PixID | Counts | Sigma | Mean | Median | Sigma |
| A | 10 | 83 | 581748 | 4452.39 | 631 | 618 | 130.5 |
| A | 15 | 237 | 386202 | 2954.19 | 631 | 618 | 130.5 |
| A | 3 | 137 | 7205 | 50.47 | 631 | 618 | 130.5 |
| B | 0 | 189 | 301702 | 2439.53 | 631 | 613 | 123.4 |
| B | 5 | 172 | 65624 | 526.74 | 631 | 613 | 123.4 |
| B | 0 | 245 | 49968 | 399.89 | 631 | 613 | 123.4 |
| C | 15 | 214 | 240144 | 1624.6 | 625 | 630 | 147.4 |
| C | 15 | 208 | 14023 | 90.84 | 625 | 630 | 147.4 |
| C | 14 | 254 | 8527 | 53.56 | 625 | 630 | 147.4 |
| D | 13 | 249 | 246966 | 1626.41 | 616 | 597 | 151.5 |
| D | 2 | 249 | 151399 | 995.52 | 616 | 597 | 151.5 |
| D | 12 | 6 | 68202 | 446.29 | 616 | 597 | 151.5 |
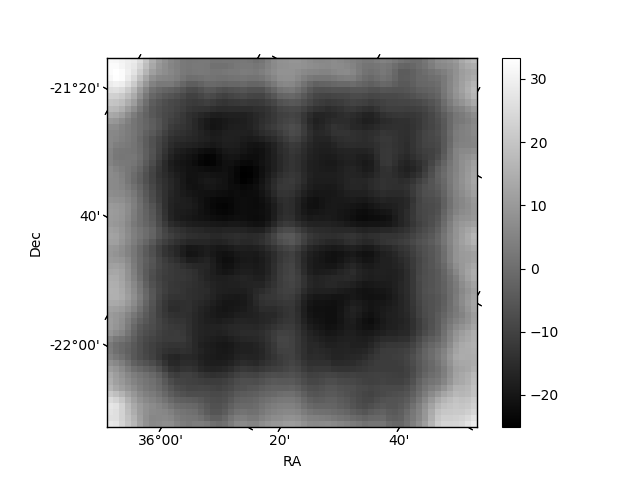
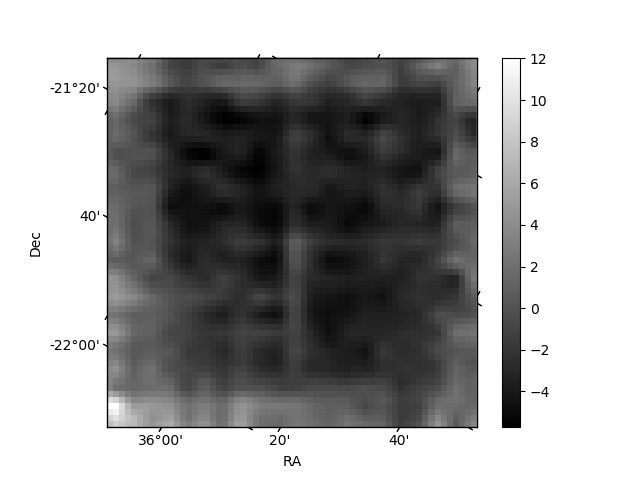
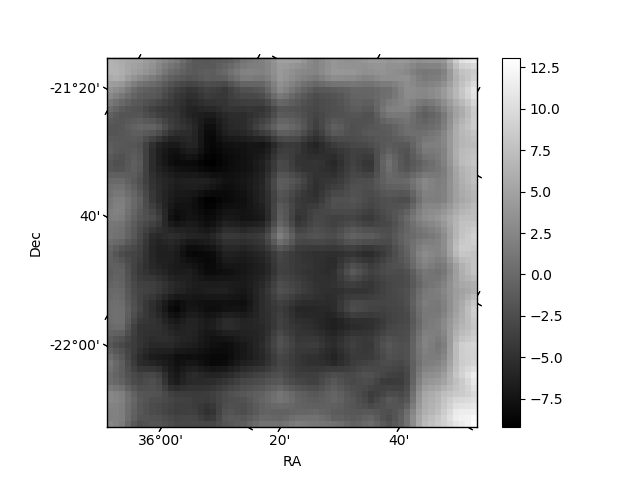
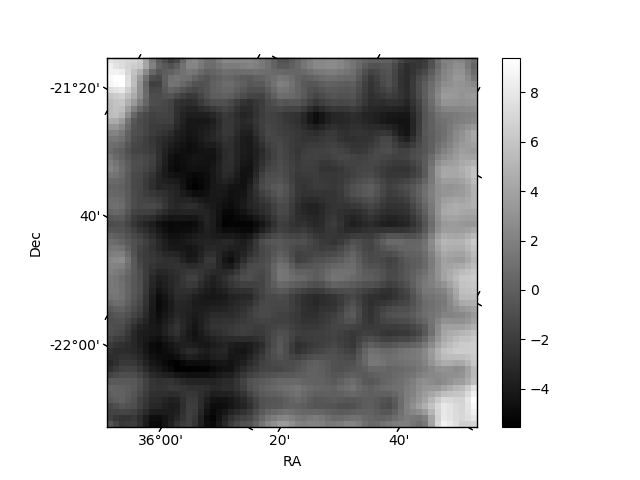
Histogram calculated using DETX and DETY for each event in the final _common_clean file
| Quadrant A | 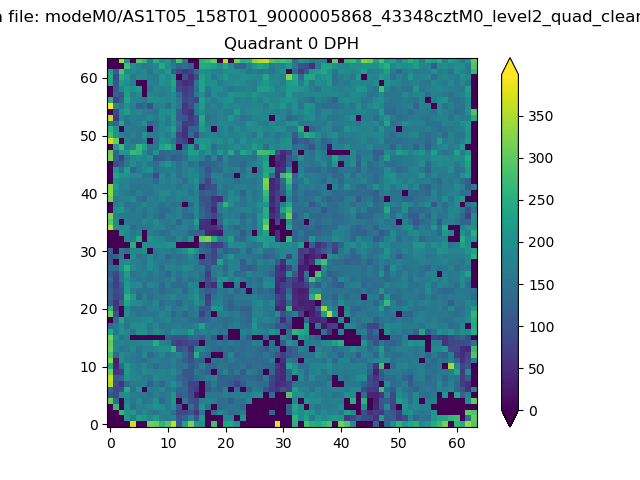 |
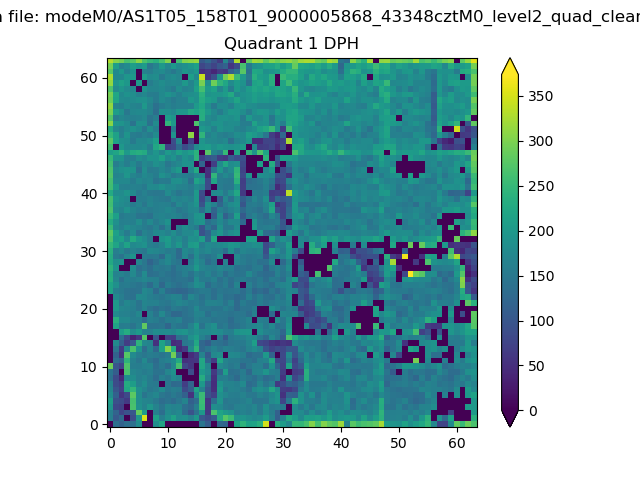 |
Quadrant B |
|---|---|---|---|
| Quadrant D | 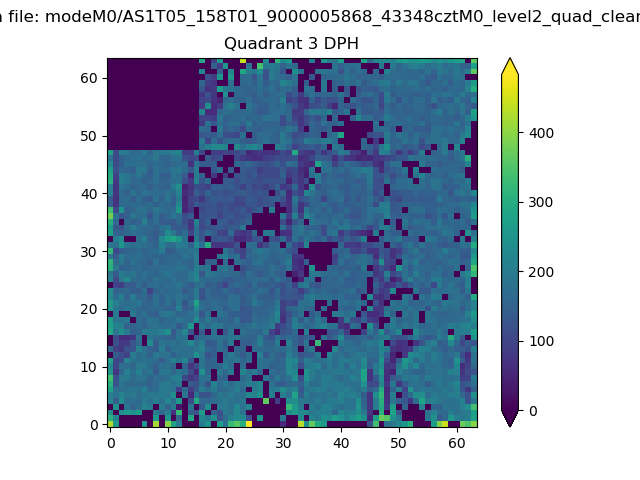 |
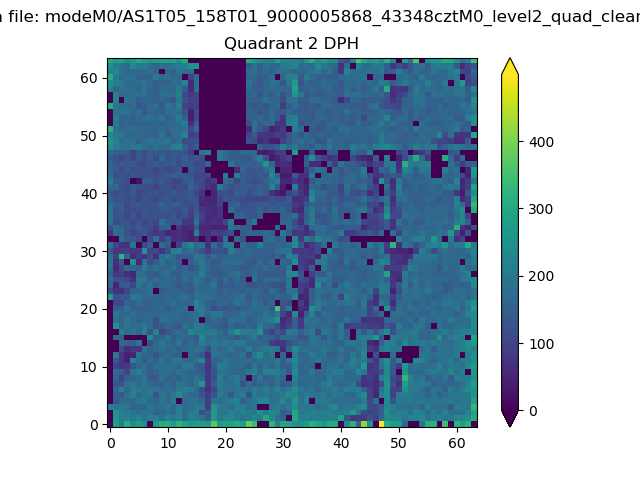 |
Quadrant C |
| Plot type | Count rate plots | Images |
|---|---|---|
| Comparison with Poisson distribution Blue bars denote a histogram of data divided into 1 sec bins. Red curve is a Poisson curve with rate = median count rate of data. |
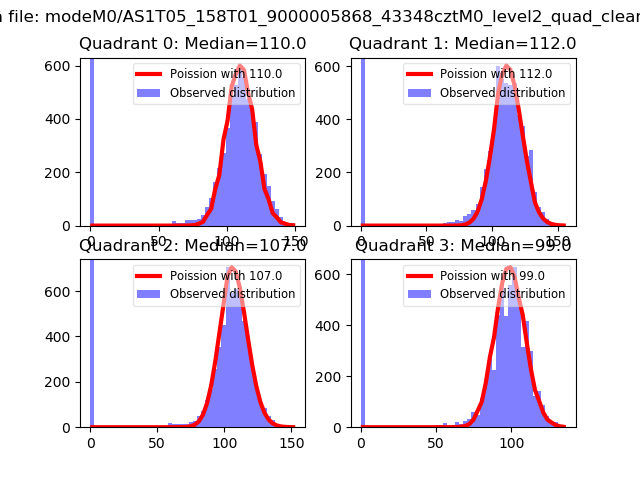 |
 |
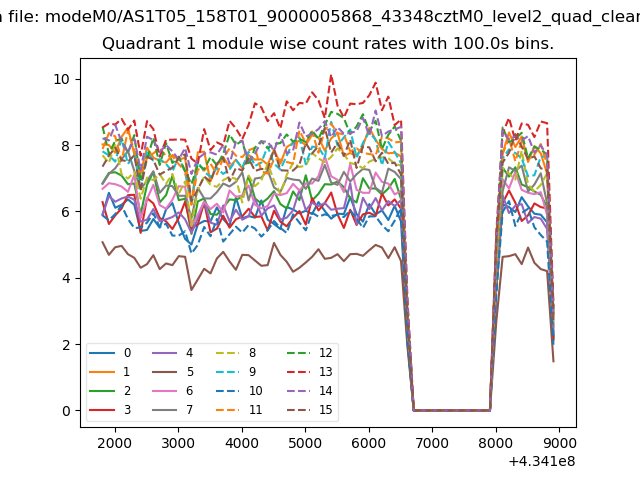
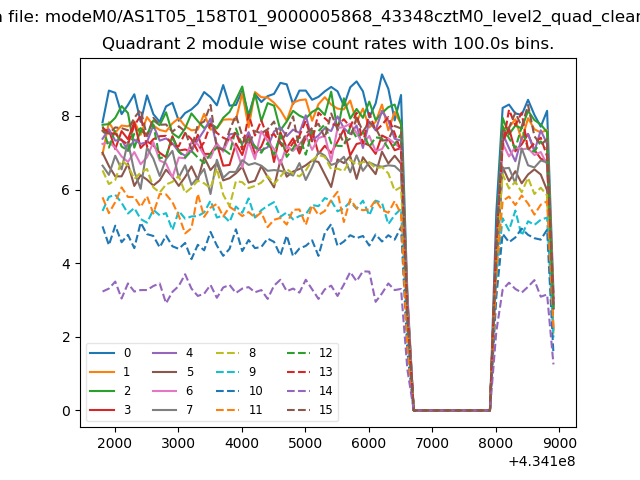
| Quadrant-wise count rates Data is divided into 100 sec bins |
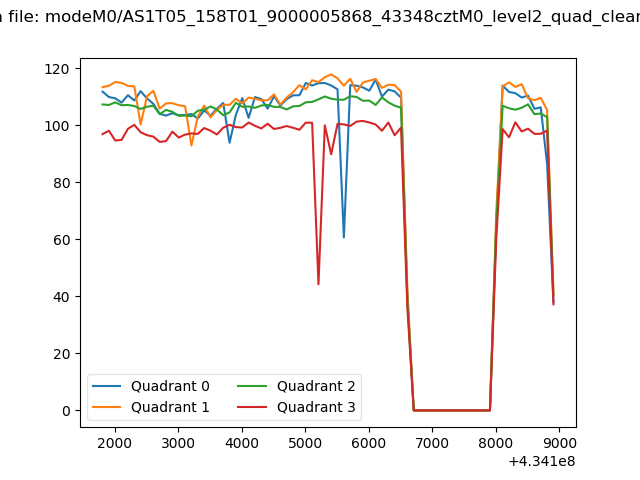 |
|
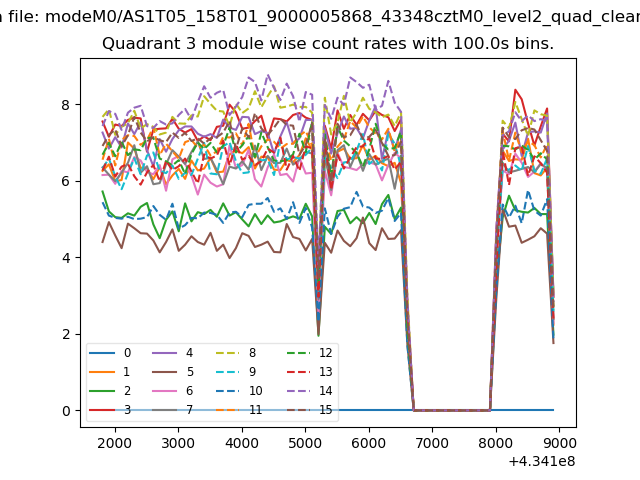
| Module-wise count rates for Quadrant A Data is divided into 100 sec bins |
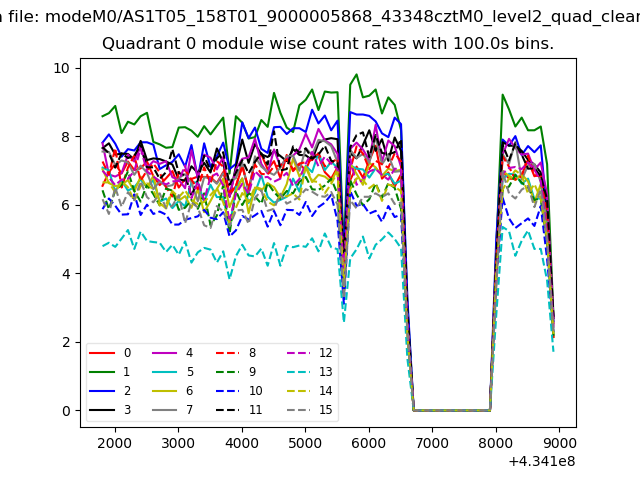 |
 |
| Module-wise count rates for Quadrant B Data is divided into 100 sec bins |
 |
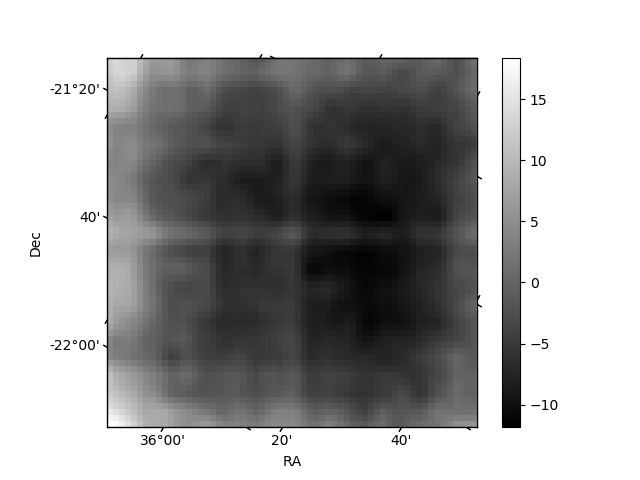 |
| Module-wise count rates for Quadrant C Data is divided into 100 sec bins |
 |
 |
| Module-wise count rates for Quadrant D Data is divided into 100 sec bins |
 |
 |
| Parameter | Plot |
|---|---|
| CZT HV Monitor | 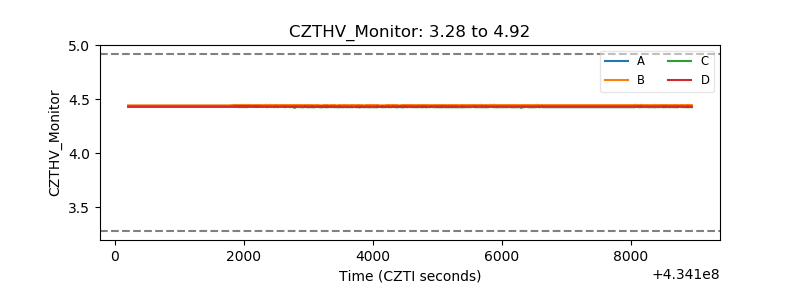 |
| D_VDD | 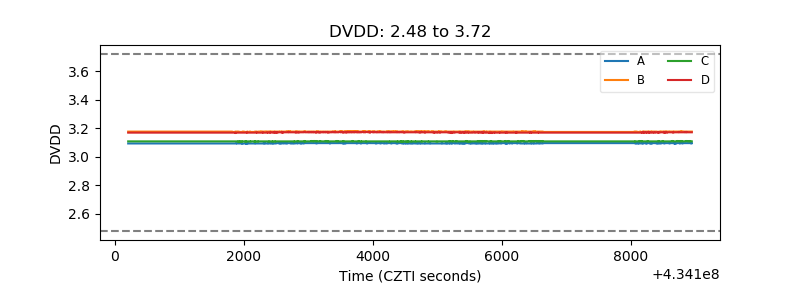 |
| Temperature 1 | 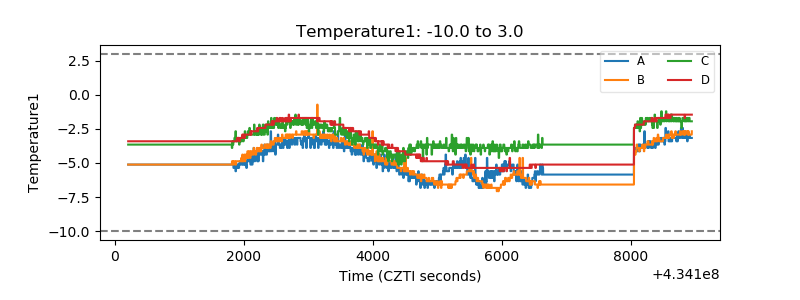 |
| Veto HV Monitor | 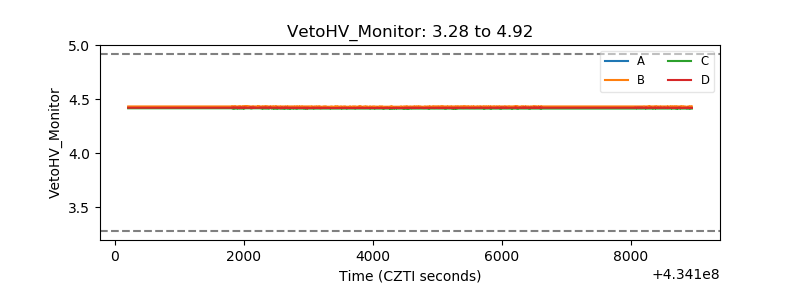 |
| Veto LLD | 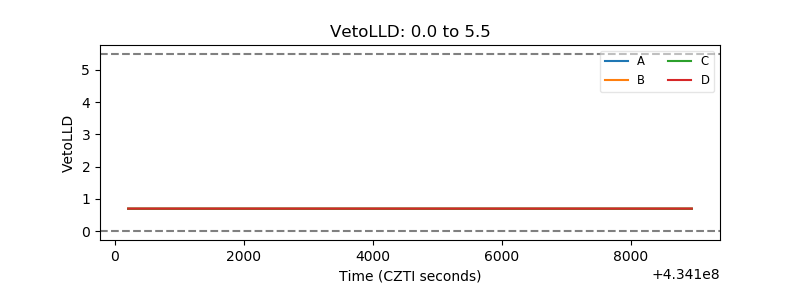 |
| Alpha Counter | 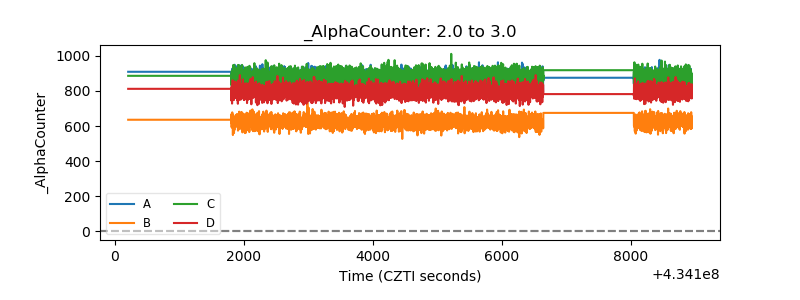 |
| _CPM_Rate |  |
| CZT Counter | 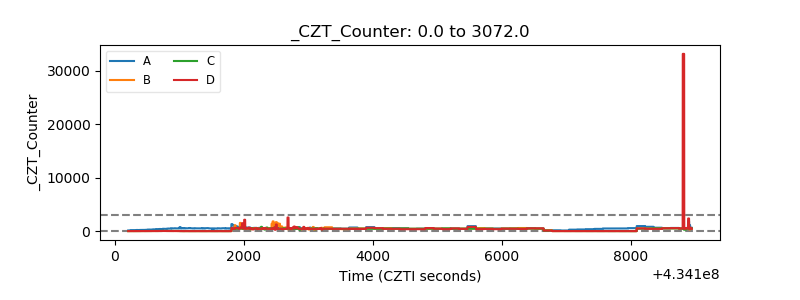 |
| +2.5 Volts monitor | 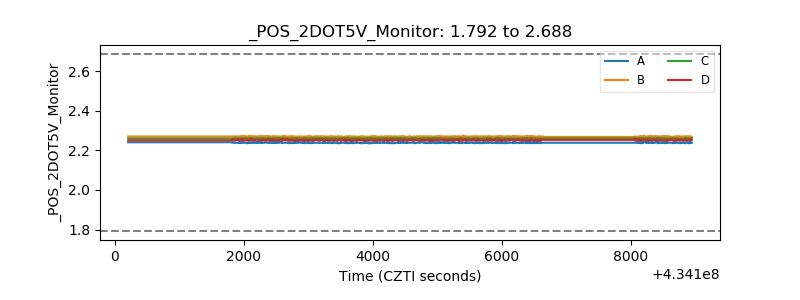 |
| +5 Volts monitor | 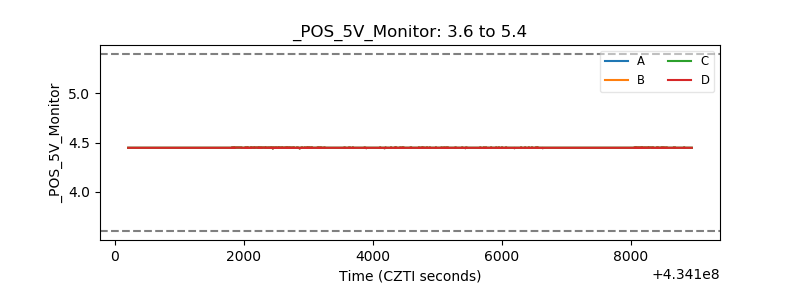 |
| _ROLL_ROT | 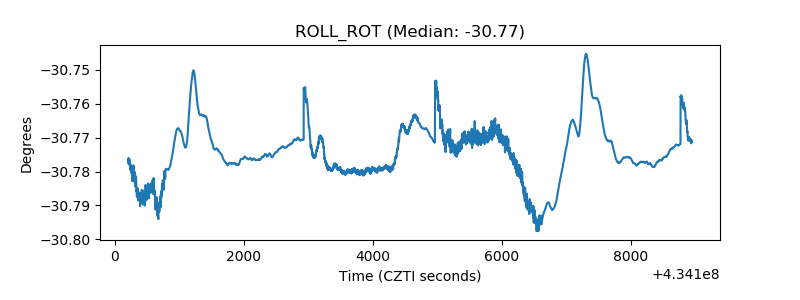 |
| _Roll_DEC | 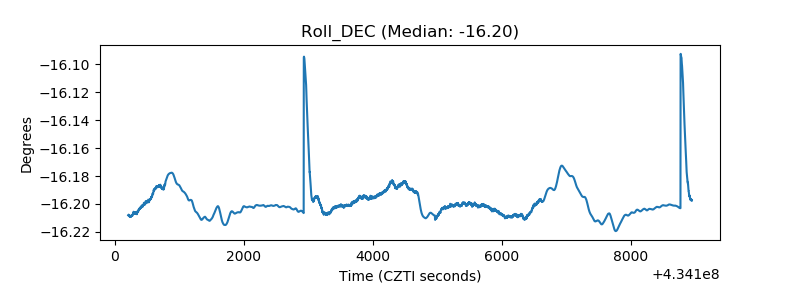 |
| _Roll_RA | 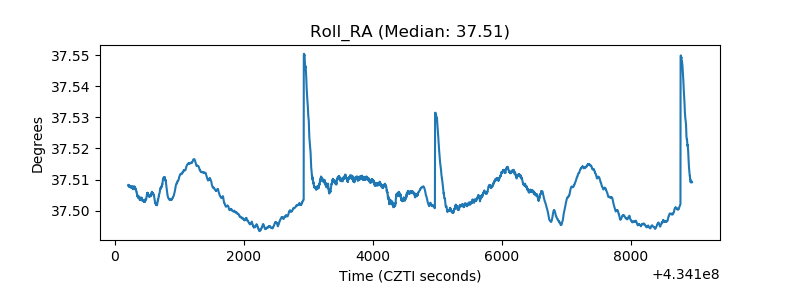 |
| Veto Counter | 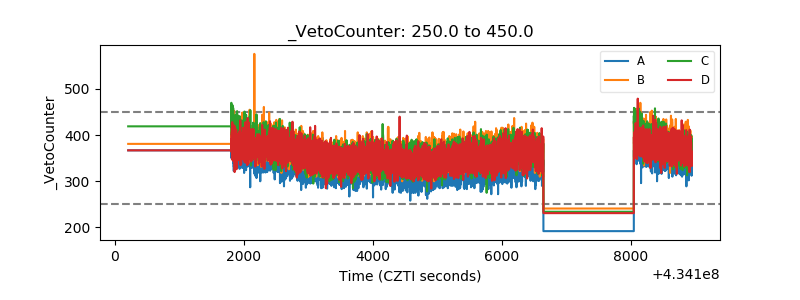 |