| Param | Original file | Final file |
|---|---|---|
| Filename | modeM0/AS1A09_143T01_9000005870_43353cztM0_level2.fits | modeM0/AS1A09_143T01_9000005870_43353cztM0_level2_quad_clean.evt |
| Size (bytes) | 417,205,440 | 90,601,920 |
| Size | 397.9 MB | 86.4 MB |
| Events in quadrant A | 3,274,606 | 622,643 |
| Events in quadrant B | 3,013,824 | 630,018 |
| Events in quadrant C | 2,667,054 | 608,648 |
| Events in quadrant D | 6,044,503 | 483,099 |
| Mode SS | |||
|---|---|---|---|
| Quadrant | BADHDUFLAG | Total packets | Discarded packets |
| A | 0 | 116 | 0 |
| B | 0 | 116 | 0 |
| C | 0 | 116 | 0 |
| D | 0 | 116 | 0 |
| Mode M9 | |||
|---|---|---|---|
| Quadrant | BADHDUFLAG | Total packets | Discarded packets |
| A | 0 | 20 | 0 |
| B | 0 | 21 | 0 |
| C | 0 | 21 | 0 |
| D | 0 | 21 | 0 |
| Mode M0 | |||
|---|---|---|---|
| Quadrant | BADHDUFLAG | Total packets | Discarded packets |
| A | 0 | 13230 | 2 |
| B | 0 | 12841 | 2 |
| C | 0 | 11526 | 2 |
| D | 0 | 21868 | 2 |
| Quadrant | Total seconds | Saturated seconds | Saturation percentage |
|---|---|---|---|
| A | 5702 | 36 | 0.631357% |
| B | 5702 | 67 | 1.175026% |
| C | 5702 | 4 | 0.070151% |
| D | 5702 | 983 | 17.239565% |
Noise dominated data is calculated using 1-second bins in cleaned event files. If a bin has >2000 counts, and if more than 50% of those come from <1% of pixels, then it is considered to be noise-dominated and hence unusable.
| Quadrant | # 1 sec bins | Bins with >0 counts | Bins with >2000 counts | High rate bins dominated by noise | Noise dominated (total time) | Noise dominated (detector-on time) | Marked lightcurve |
|---|---|---|---|---|---|---|---|
| A | 7315 | 5703 | 20 | 20 | 0.27% | 0.35% | 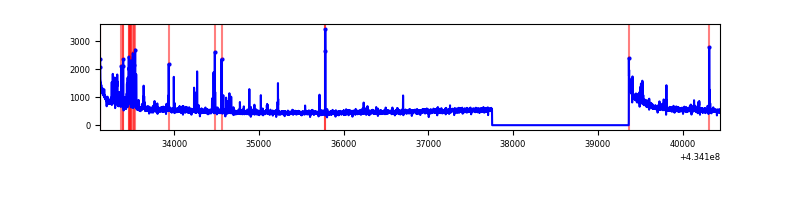 |
| B | 7315 | 5703 | 48 | 48 | 0.66% | 0.84% | 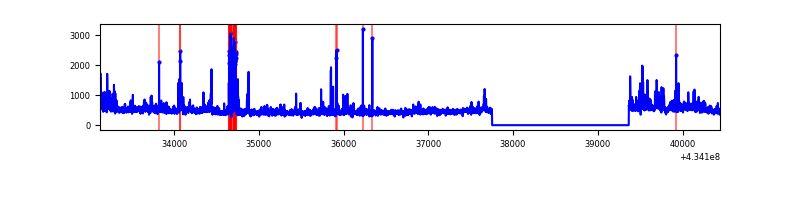 |
| C | 7315 | 5703 | 0 | 0 | 0.00% | 0.00% | 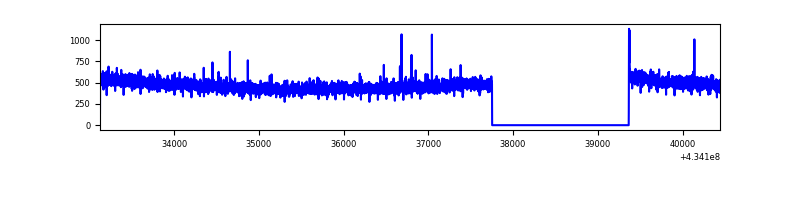 |
| D | 7314 | 5702 | 878 | 878 | 12.00% | 15.40% | 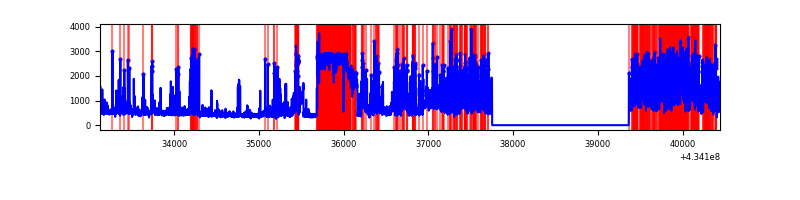 |
Top three noisy pixels from each quadrant. If the there are fewer than three noisy pixels in the level2.evt file, extra rows are filled as -1
| Pixel properties | Quadrant properties | ||||||
|---|---|---|---|---|---|---|---|
| Quadrant | DetID | PixID | Counts | Sigma | Mean | Median | Sigma |
| A | 10 | 83 | 626868 | 4818.41 | 623 | 610 | 130.0 |
| A | 13 | 248 | 146020 | 1118.78 | 623 | 610 | 130.0 |
| A | 15 | 237 | 66538 | 507.25 | 623 | 610 | 130.0 |
| B | 0 | 189 | 194026 | 1613.49 | 619 | 602 | 119.9 |
| B | 5 | 172 | 150472 | 1250.17 | 619 | 602 | 119.9 |
| B | 0 | 190 | 53882 | 444.44 | 619 | 602 | 119.9 |
| C | 15 | 214 | 235908 | 1634.4 | 615 | 619 | 144.0 |
| C | 3 | 233 | 11781 | 77.53 | 615 | 619 | 144.0 |
| C | 15 | 111 | 7973 | 51.08 | 615 | 619 | 144.0 |
| D | 1 | 52 | 2163721 | 15616.14 | 565 | 549 | 138.5 |
| D | 13 | 249 | 1391086 | 10038.41 | 565 | 549 | 138.5 |
| D | 12 | 233 | 138688 | 997.24 | 565 | 549 | 138.5 |
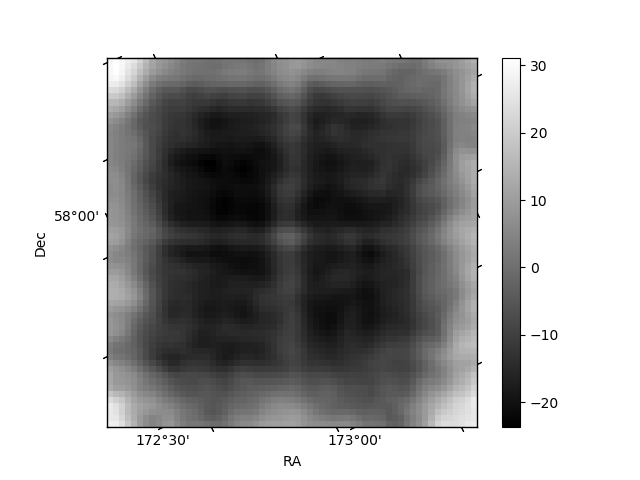
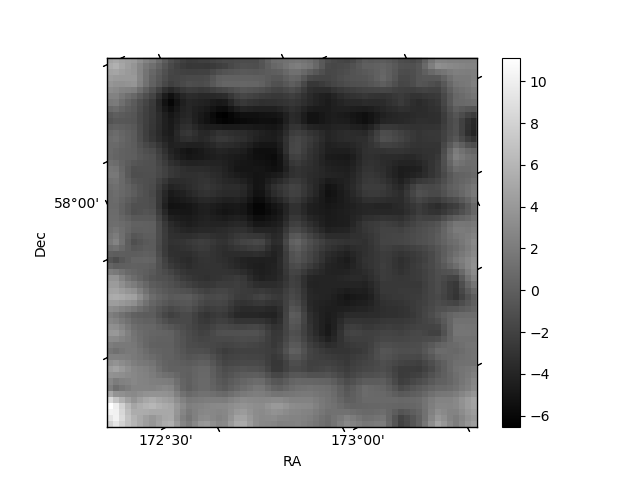
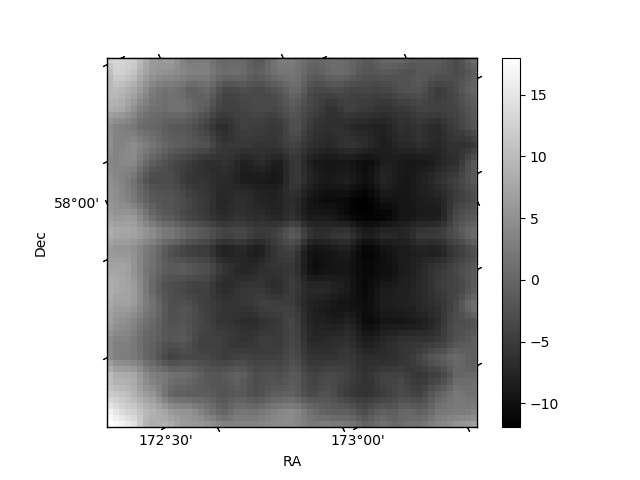
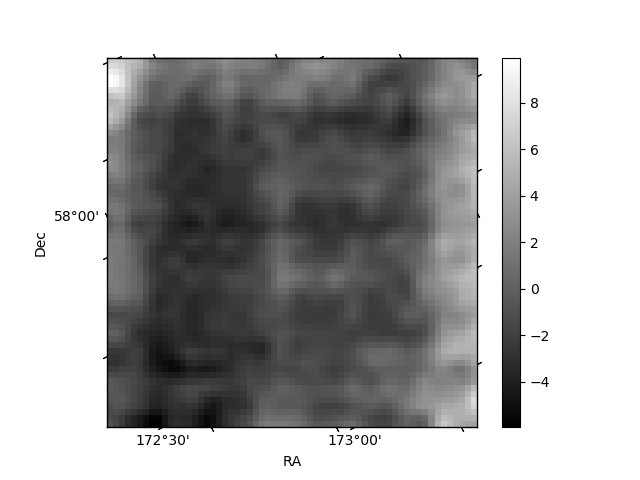
Histogram calculated using DETX and DETY for each event in the final _common_clean file
| Quadrant A | 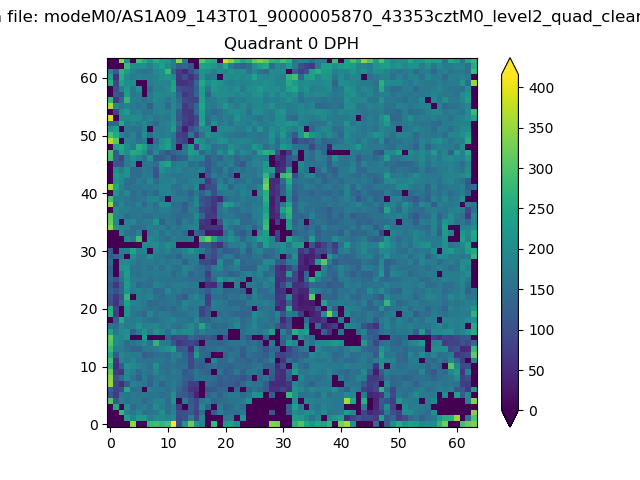 |
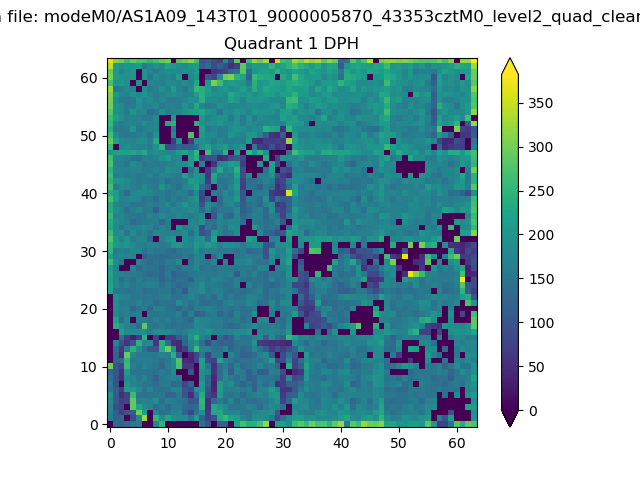 |
Quadrant B |
|---|---|---|---|
| Quadrant D | 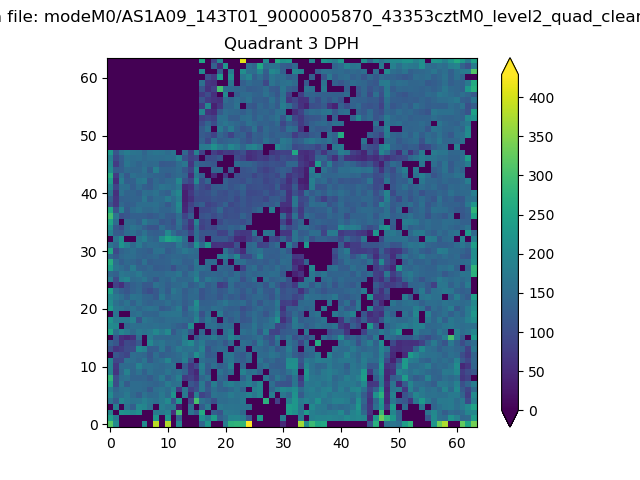 |
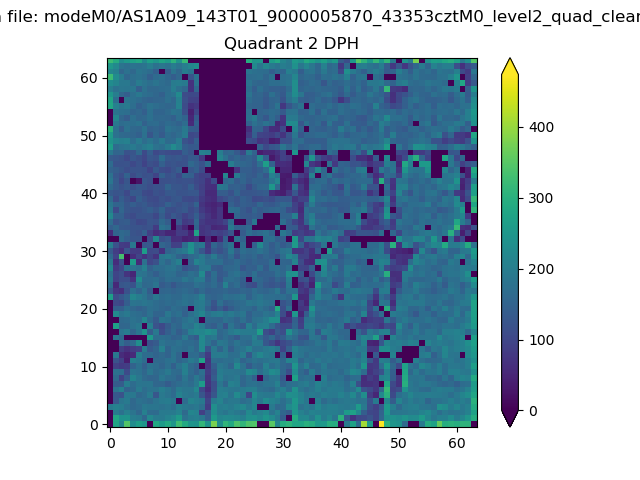 |
Quadrant C |
| Plot type | Count rate plots | Images |
|---|---|---|
| Comparison with Poisson distribution Blue bars denote a histogram of data divided into 1 sec bins. Red curve is a Poisson curve with rate = median count rate of data. |
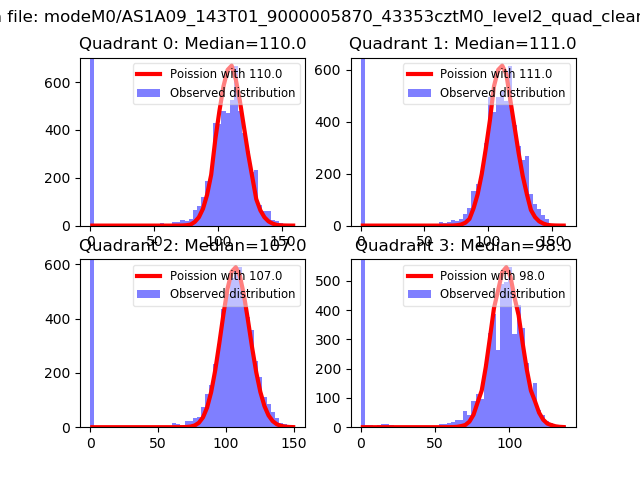 |
 |
| Quadrant-wise count rates Data is divided into 100 sec bins |
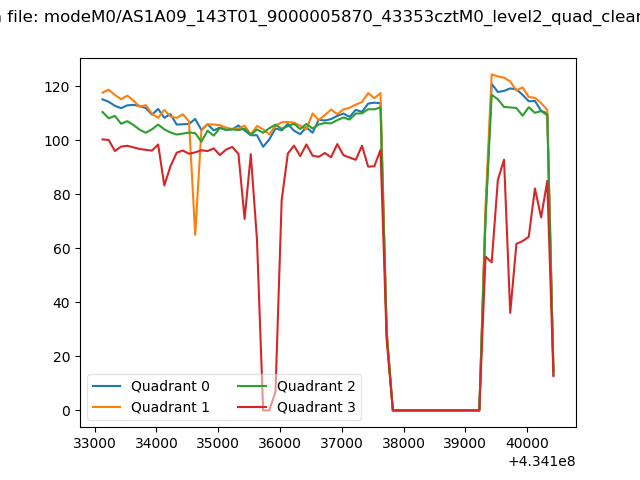 |
|
| Module-wise count rates for Quadrant A Data is divided into 100 sec bins |
 |
 |
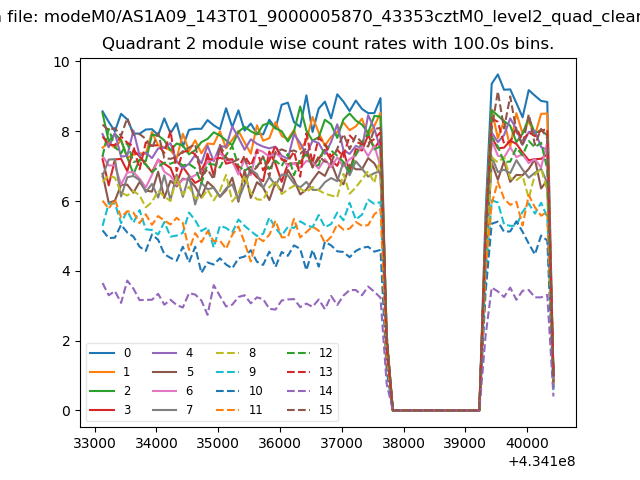
| Module-wise count rates for Quadrant B Data is divided into 100 sec bins |
 |
 |
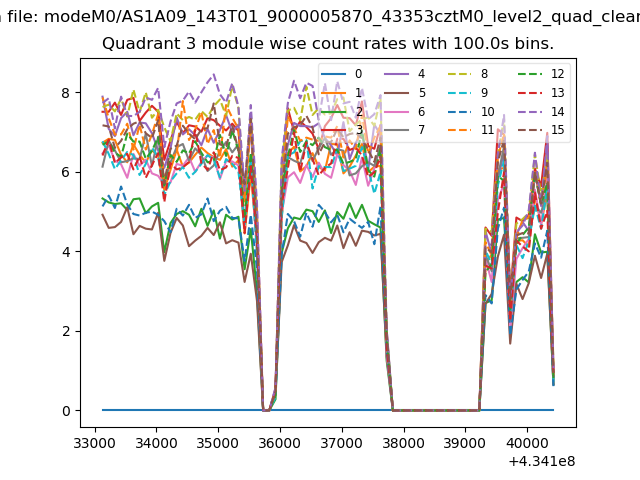
| Module-wise count rates for Quadrant C Data is divided into 100 sec bins |
 |
 |
| Module-wise count rates for Quadrant D Data is divided into 100 sec bins |
 |
 |
| Parameter | Plot |
|---|---|
| CZT HV Monitor |  |
| D_VDD | 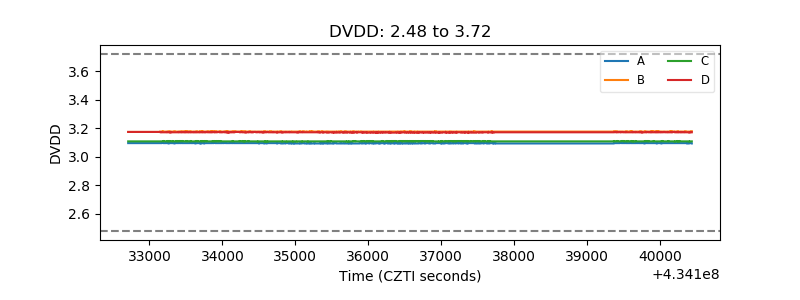 |
| Temperature 1 | 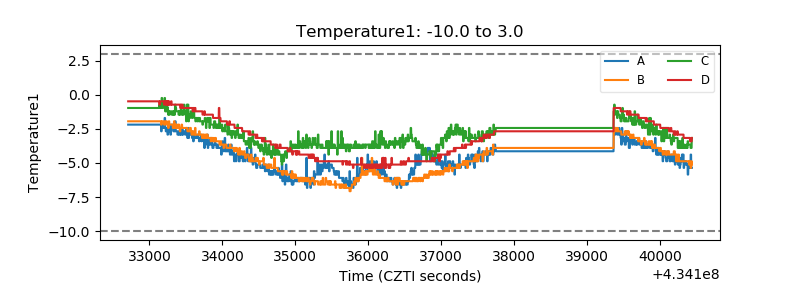 |
| Veto HV Monitor | 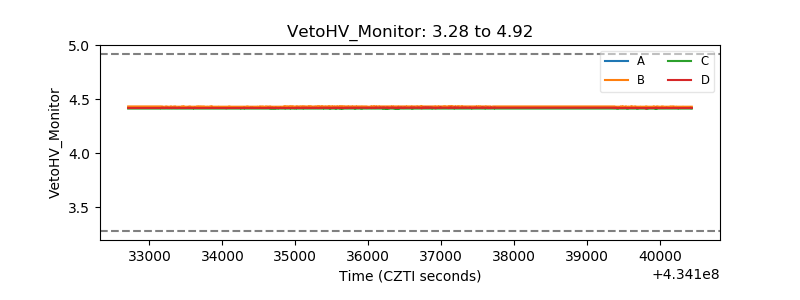 |
| Veto LLD | 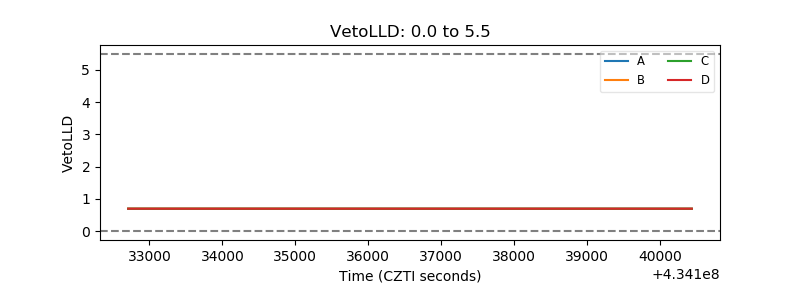 |
| Alpha Counter | 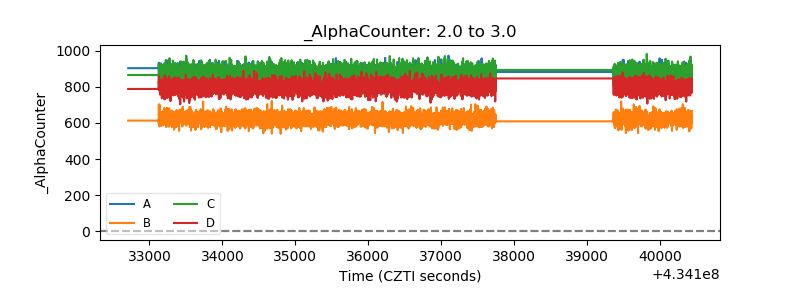 |
| _CPM_Rate | 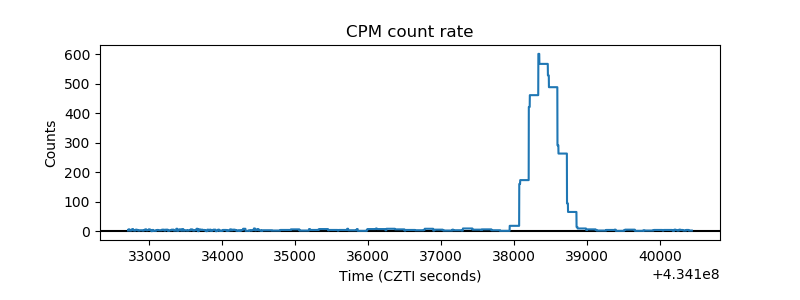 |
| CZT Counter | 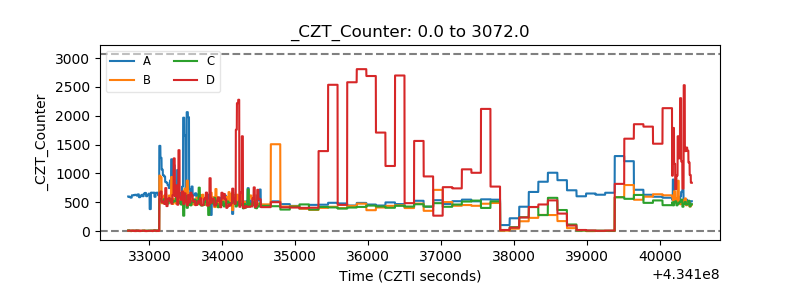 |
| +2.5 Volts monitor | 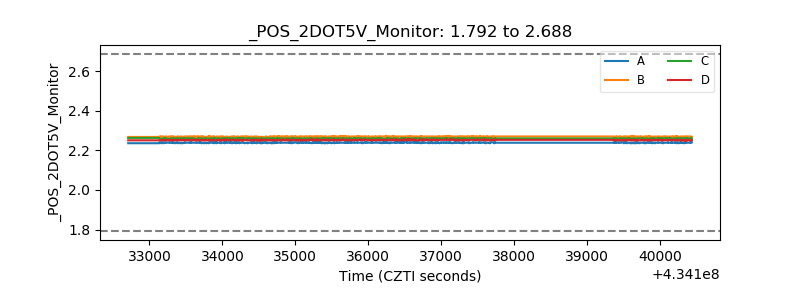 |
| +5 Volts monitor | 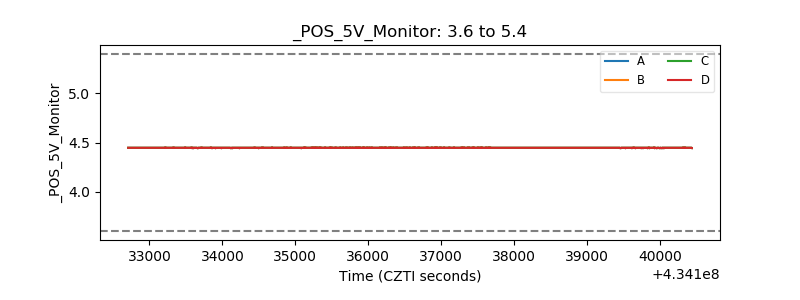 |
| _ROLL_ROT | 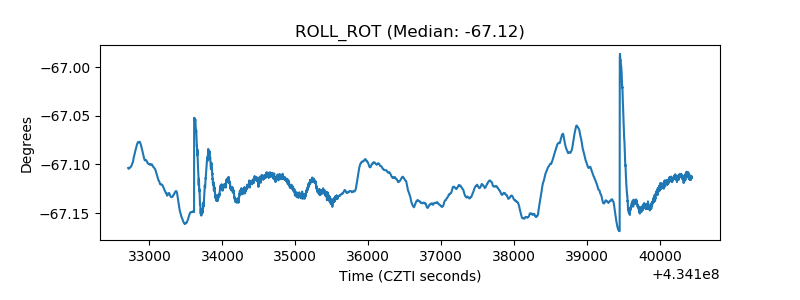 |
| _Roll_DEC | 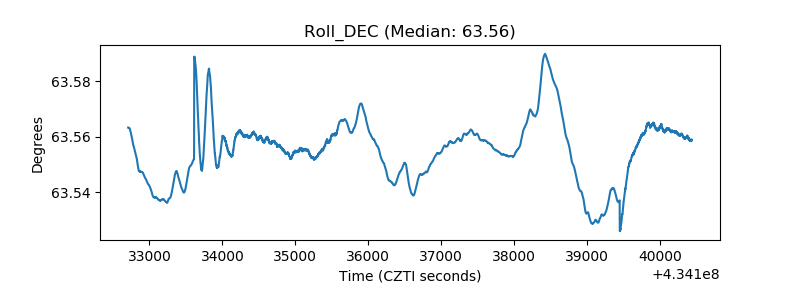 |
| _Roll_RA | 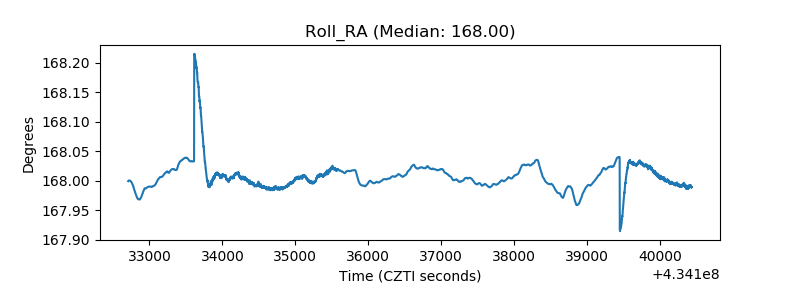 |
| Veto Counter | 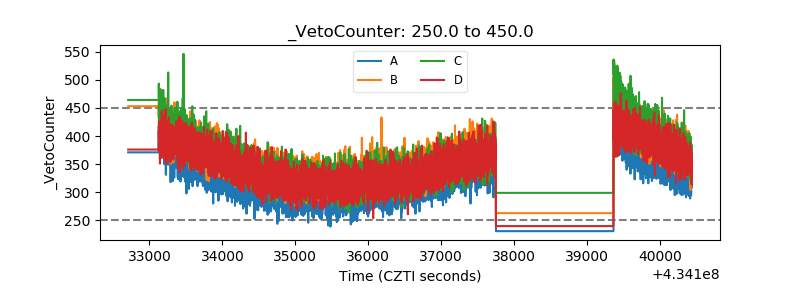 |