| Param | Original file | Final file |
|---|---|---|
| Filename | modeM0/AS1A09_143T01_9000005870_43355cztM0_level2.fits | modeM0/AS1A09_143T01_9000005870_43355cztM0_level2_quad_clean.evt |
| Size (bytes) | 378,060,480 | 88,816,320 |
| Size | 360.5 MB | 84.7 MB |
| Events in quadrant A | 3,016,638 | 604,434 |
| Events in quadrant B | 2,734,164 | 616,904 |
| Events in quadrant C | 2,602,010 | 597,012 |
| Events in quadrant D | 5,220,365 | 491,951 |
| Mode SS | |||
|---|---|---|---|
| Quadrant | BADHDUFLAG | Total packets | Discarded packets |
| A | 0 | 110 | 0 |
| B | 0 | 110 | 0 |
| C | 0 | 110 | 0 |
| D | 0 | 110 | 0 |
| Mode M9 | |||
|---|---|---|---|
| Quadrant | BADHDUFLAG | Total packets | Discarded packets |
| A | 0 | 22 | 0 |
| B | 0 | 23 | 0 |
| C | 0 | 23 | 0 |
| D | 0 | 23 | 0 |
| Mode M0 | |||
|---|---|---|---|
| Quadrant | BADHDUFLAG | Total packets | Discarded packets |
| A | 0 | 12347 | 2 |
| B | 0 | 11899 | 2 |
| C | 0 | 11190 | 2 |
| D | 0 | 19240 | 2 |
| Quadrant | Total seconds | Saturated seconds | Saturation percentage |
|---|---|---|---|
| A | 5415 | 37 | 0.683287% |
| B | 5415 | 53 | 0.978763% |
| C | 5415 | 7 | 0.129271% |
| D | 5414 | 767 | 14.166975% |
Noise dominated data is calculated using 1-second bins in cleaned event files. If a bin has >2000 counts, and if more than 50% of those come from <1% of pixels, then it is considered to be noise-dominated and hence unusable.
| Quadrant | # 1 sec bins | Bins with >0 counts | Bins with >2000 counts | High rate bins dominated by noise | Noise dominated (total time) | Noise dominated (detector-on time) | Marked lightcurve |
|---|---|---|---|---|---|---|---|
| A | 7177 | 5416 | 17 | 17 | 0.24% | 0.31% | 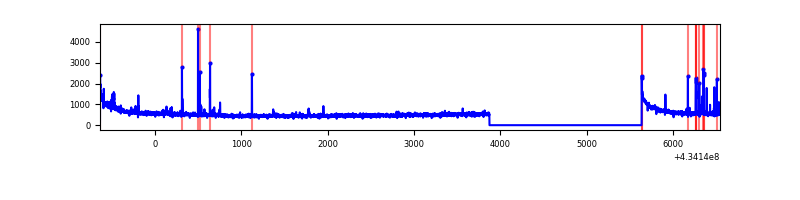 |
| B | 7177 | 5416 | 35 | 35 | 0.49% | 0.65% | 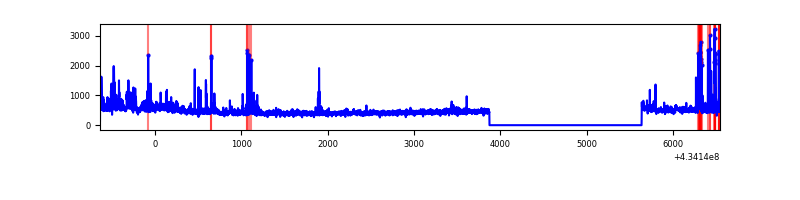 |
| C | 7177 | 5416 | 4 | 4 | 0.06% | 0.07% | 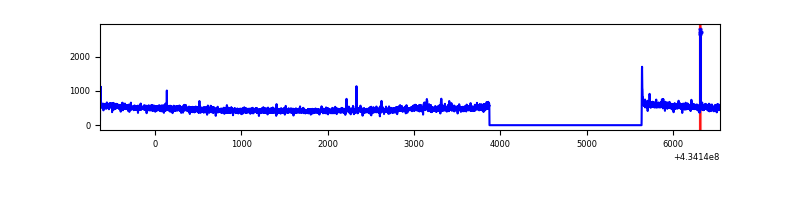 |
| D | 7176 | 5415 | 579 | 579 | 8.07% | 10.69% | 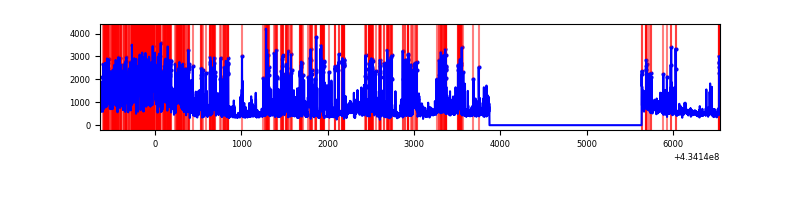 |
Top three noisy pixels from each quadrant. If the there are fewer than three noisy pixels in the level2.evt file, extra rows are filled as -1
| Pixel properties | Quadrant properties | ||||||
|---|---|---|---|---|---|---|---|
| Quadrant | DetID | PixID | Counts | Sigma | Mean | Median | Sigma |
| A | 10 | 83 | 589464 | 4849.6 | 594 | 582 | 121.4 |
| A | 15 | 237 | 86248 | 705.48 | 594 | 582 | 121.4 |
| A | 13 | 248 | 26747 | 215.48 | 594 | 582 | 121.4 |
| B | 0 | 189 | 188306 | 1641.78 | 589 | 571 | 114.3 |
| B | 5 | 172 | 120967 | 1052.89 | 589 | 571 | 114.3 |
| B | 5 | 255 | 47641 | 411.63 | 589 | 571 | 114.3 |
| C | 15 | 214 | 222461 | 1620.63 | 585 | 587 | 136.9 |
| C | 3 | 233 | 79370 | 575.45 | 585 | 587 | 136.9 |
| C | 2 | 16 | 13573 | 94.85 | 585 | 587 | 136.9 |
| D | 1 | 52 | 2791756 | 20854.08 | 551 | 535 | 133.8 |
| D | 12 | 218 | 69459 | 514.95 | 551 | 535 | 133.8 |
| D | 12 | 233 | 65638 | 486.4 | 551 | 535 | 133.8 |
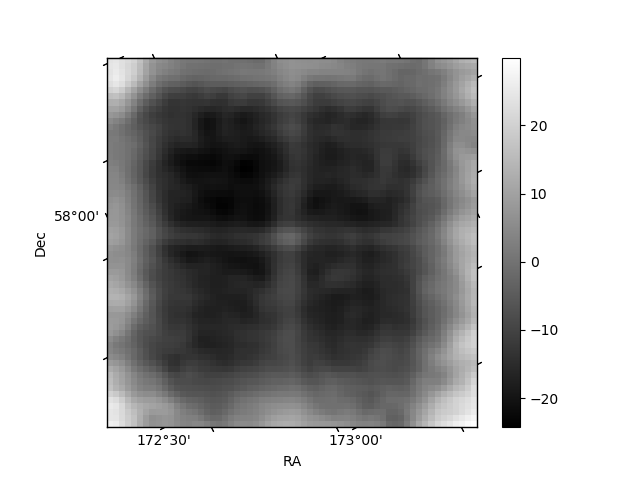
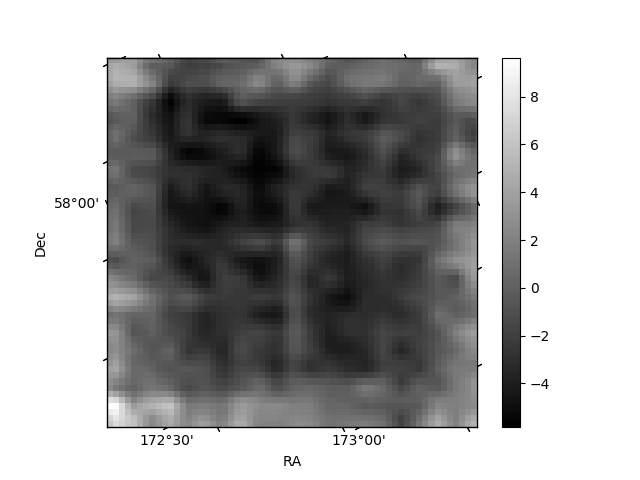
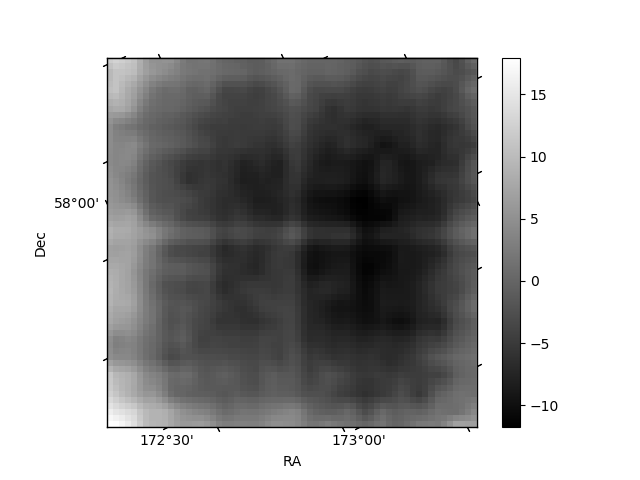
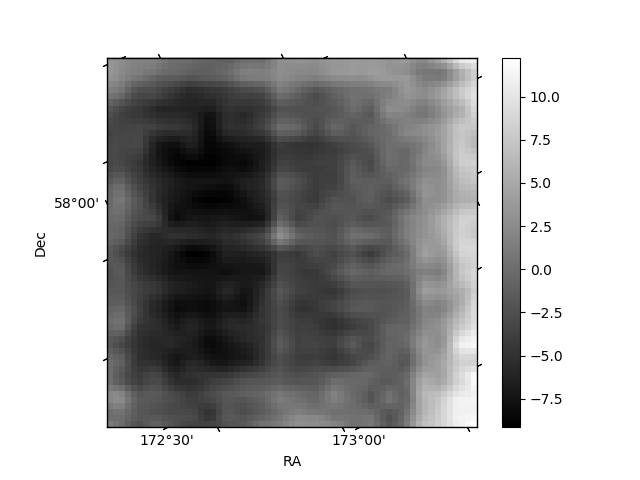
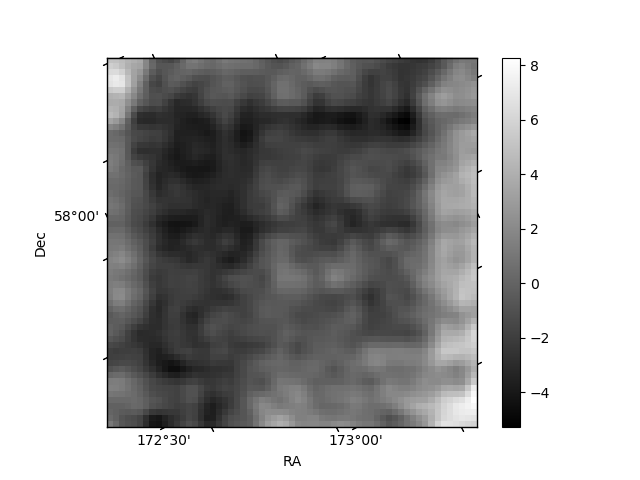
Histogram calculated using DETX and DETY for each event in the final _common_clean file
| Quadrant A | 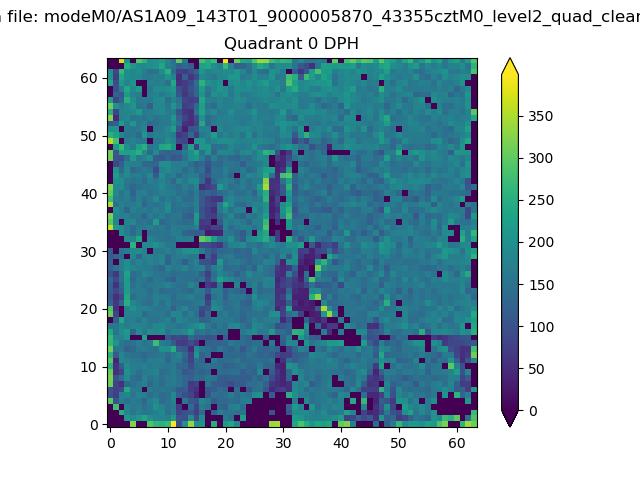 |
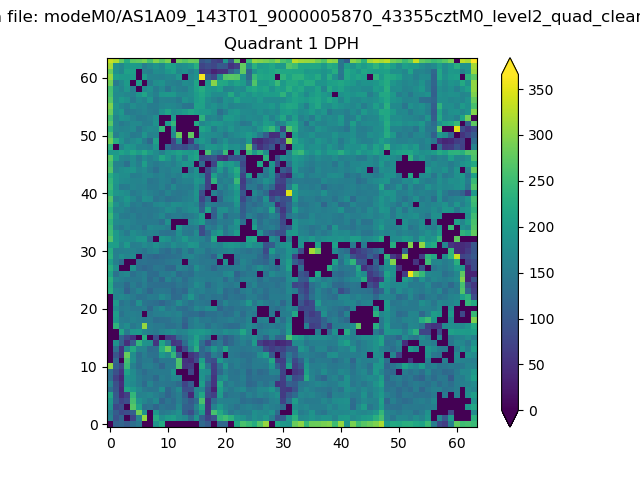 |
Quadrant B |
|---|---|---|---|
| Quadrant D | 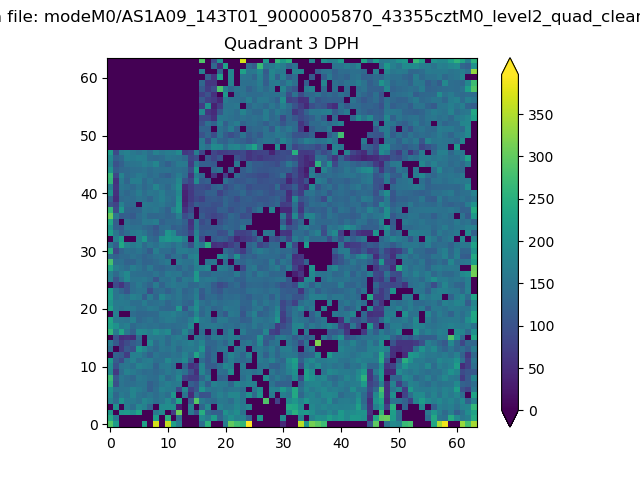 |
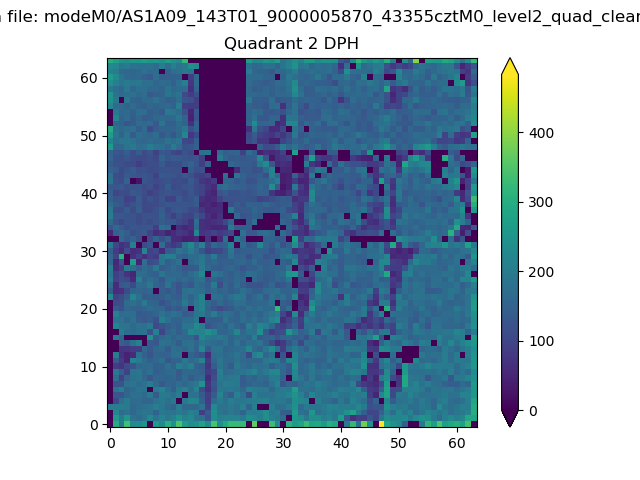 |
Quadrant C |
| Plot type | Count rate plots | Images |
|---|---|---|
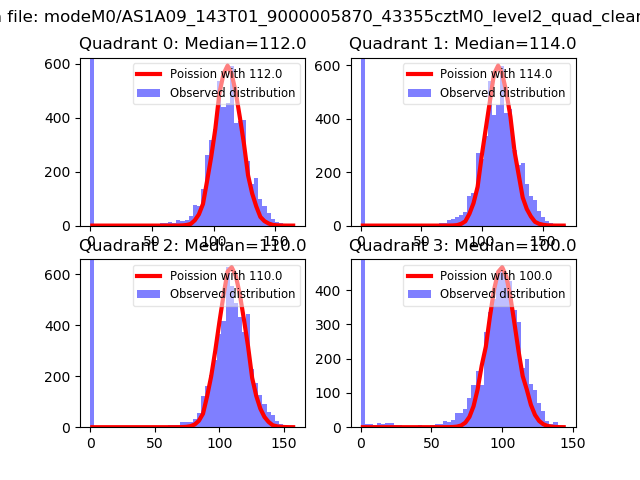
| Comparison with Poisson distribution Blue bars denote a histogram of data divided into 1 sec bins. Red curve is a Poisson curve with rate = median count rate of data. |
 |
 |
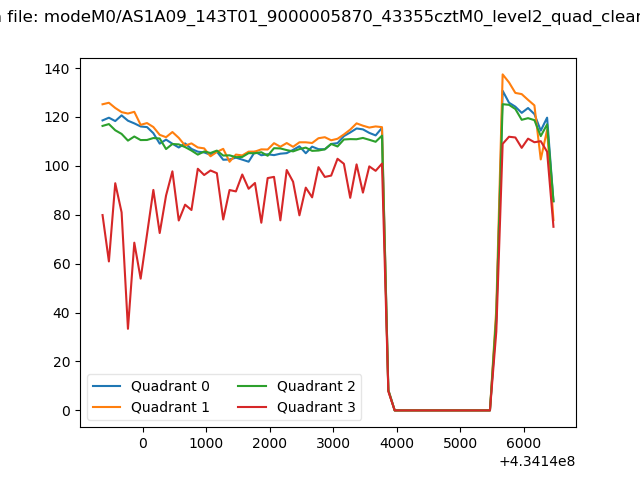
| Quadrant-wise count rates Data is divided into 100 sec bins |
 |
|
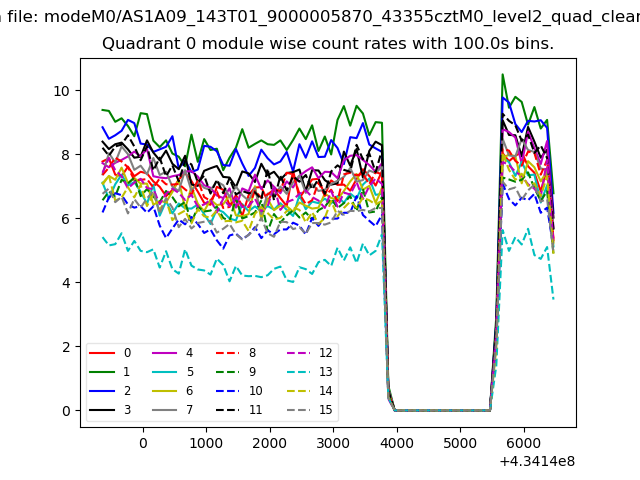
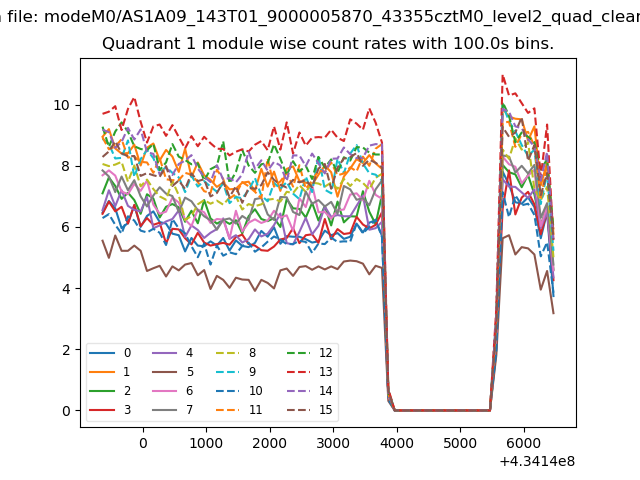
| Module-wise count rates for Quadrant A Data is divided into 100 sec bins |
 |
 |
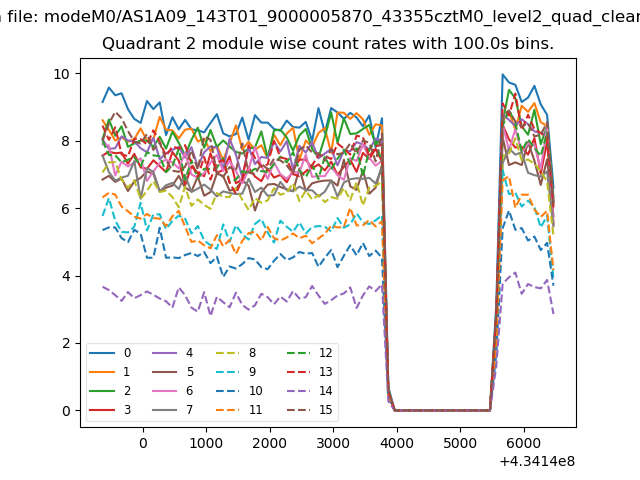
| Module-wise count rates for Quadrant B Data is divided into 100 sec bins |
 |
 |
| Module-wise count rates for Quadrant C Data is divided into 100 sec bins |
 |
 |
| Module-wise count rates for Quadrant D Data is divided into 100 sec bins |
 |
 |
| Parameter | Plot |
|---|---|
| CZT HV Monitor | 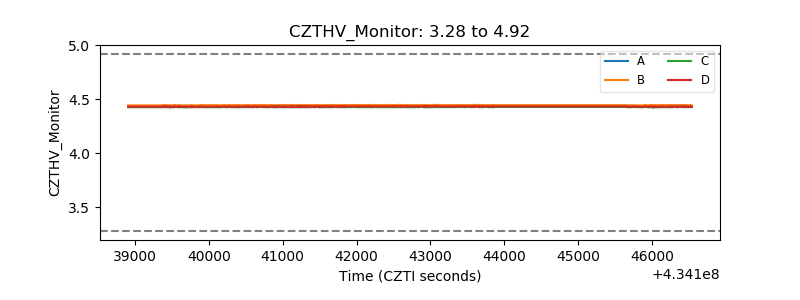 |
| D_VDD | 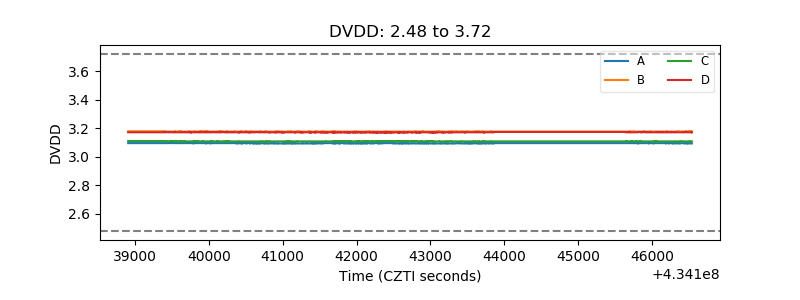 |
| Temperature 1 | 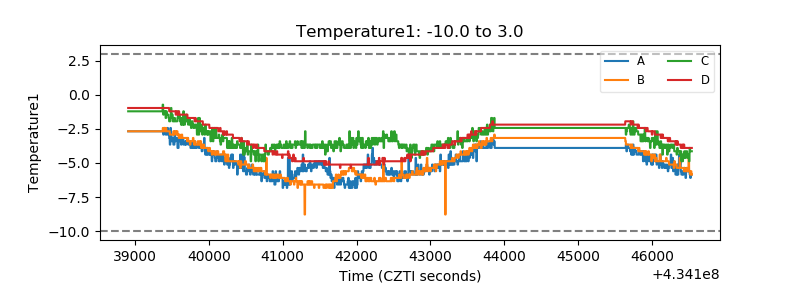 |
| Veto HV Monitor | 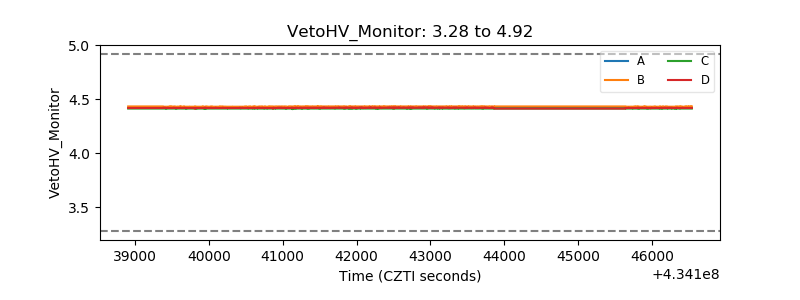 |
| Veto LLD | 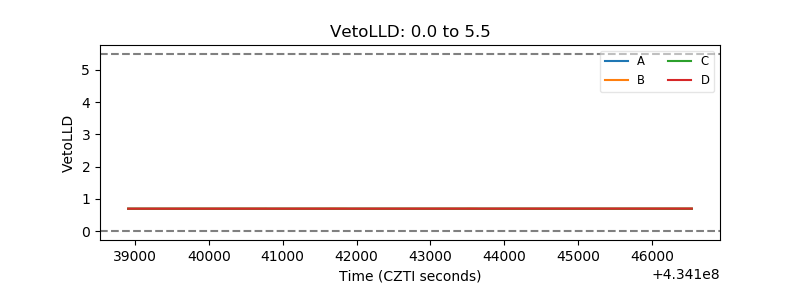 |
| Alpha Counter | 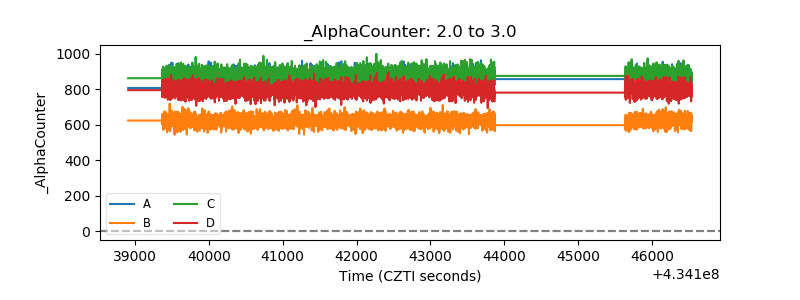 |
| _CPM_Rate | 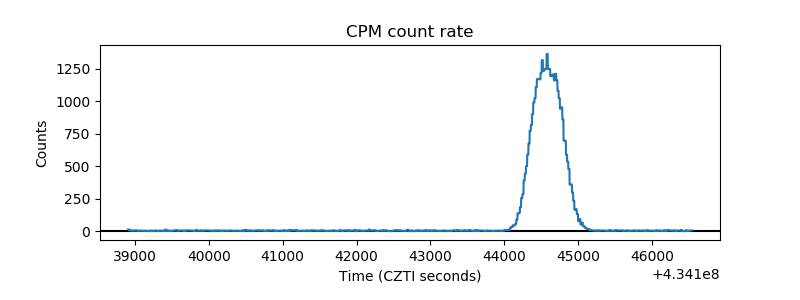 |
| CZT Counter | 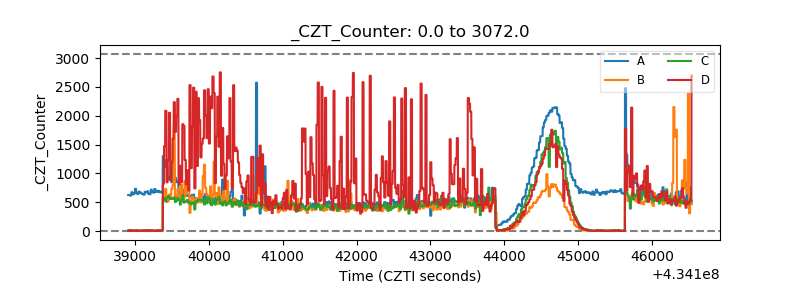 |
| +2.5 Volts monitor | 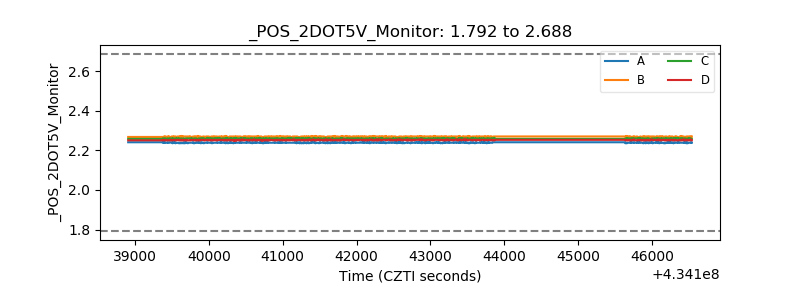 |
| +5 Volts monitor | 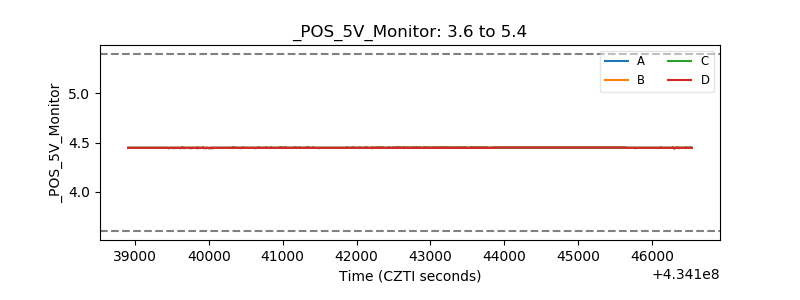 |
| _ROLL_ROT | 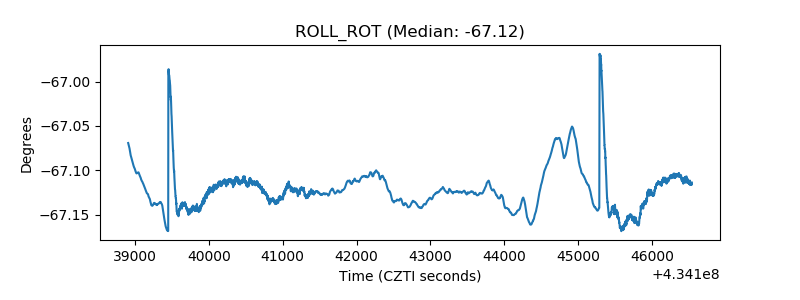 |
| _Roll_DEC | 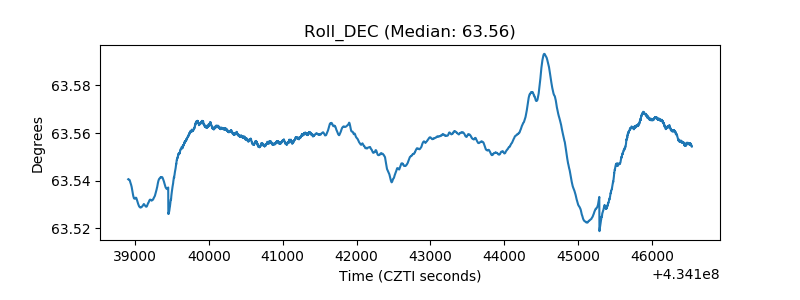 |
| _Roll_RA | 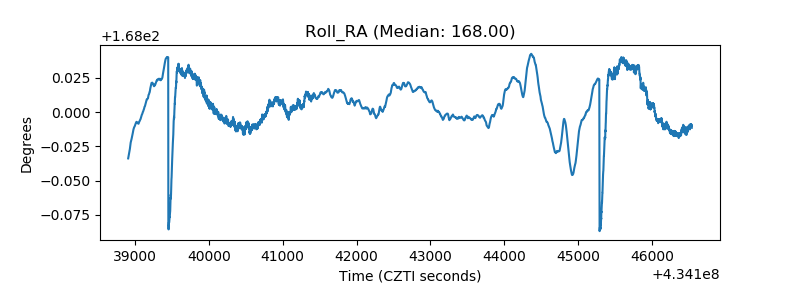 |
| Veto Counter |  |