| Param | Original file | Final file |
|---|---|---|
| Filename | modeM0/AS1A09_143T01_9000005870_43356cztM0_level2.fits | modeM0/AS1A09_143T01_9000005870_43356cztM0_level2_quad_clean.evt |
| Size (bytes) | 324,325,440 | 89,881,920 |
| Size | 309.3 MB | 85.7 MB |
| Events in quadrant A | 3,230,428 | 593,986 |
| Events in quadrant B | 2,709,266 | 615,132 |
| Events in quadrant C | 2,623,243 | 601,982 |
| Events in quadrant D | 3,034,516 | 543,536 |
| Mode SS | |||
|---|---|---|---|
| Quadrant | BADHDUFLAG | Total packets | Discarded packets |
| A | 0 | 108 | 0 |
| B | 0 | 108 | 0 |
| C | 0 | 108 | 0 |
| D | 0 | 108 | 0 |
| Mode M9 | |||
|---|---|---|---|
| Quadrant | BADHDUFLAG | Total packets | Discarded packets |
| A | 0 | 23 | 0 |
| B | 0 | 24 | 0 |
| C | 0 | 24 | 0 |
| D | 0 | 24 | 0 |
| Mode M0 | |||
|---|---|---|---|
| Quadrant | BADHDUFLAG | Total packets | Discarded packets |
| A | 0 | 12910 | 2 |
| B | 0 | 11585 | 2 |
| C | 0 | 10933 | 2 |
| D | 0 | 12795 | 2 |
| Quadrant | Total seconds | Saturated seconds | Saturation percentage |
|---|---|---|---|
| A | 5235 | 133 | 2.540592% |
| B | 5235 | 83 | 1.585482% |
| C | 5235 | 7 | 0.133715% |
| D | 5235 | 111 | 2.120344% |
Noise dominated data is calculated using 1-second bins in cleaned event files. If a bin has >2000 counts, and if more than 50% of those come from <1% of pixels, then it is considered to be noise-dominated and hence unusable.
| Quadrant | # 1 sec bins | Bins with >0 counts | Bins with >2000 counts | High rate bins dominated by noise | Noise dominated (total time) | Noise dominated (detector-on time) | Marked lightcurve |
|---|---|---|---|---|---|---|---|
| A | 7117 | 5236 | 113 | 113 | 1.59% | 2.16% | 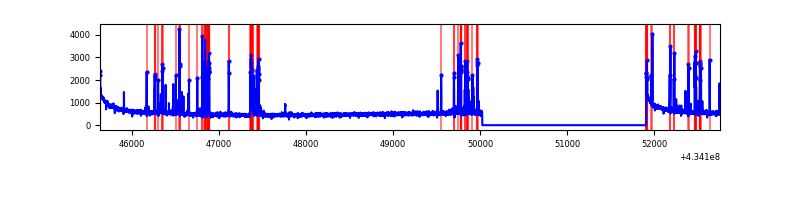 |
| B | 7117 | 5236 | 60 | 60 | 0.84% | 1.15% | 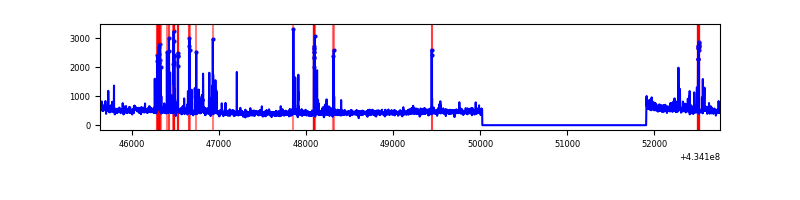 |
| C | 7117 | 5236 | 5 | 5 | 0.07% | 0.10% | 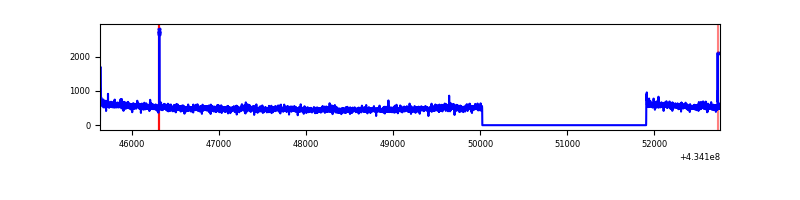 |
| D | 7117 | 5236 | 102 | 102 | 1.43% | 1.95% | 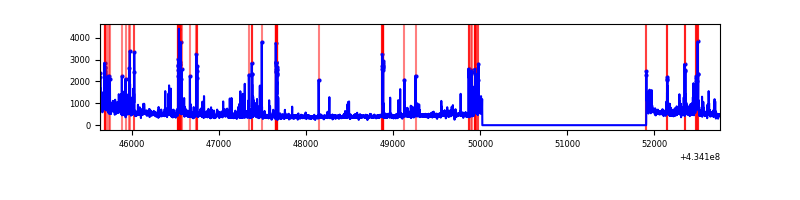 |
Top three noisy pixels from each quadrant. If the there are fewer than three noisy pixels in the level2.evt file, extra rows are filled as -1
| Pixel properties | Quadrant properties | ||||||
|---|---|---|---|---|---|---|---|
| Quadrant | DetID | PixID | Counts | Sigma | Mean | Median | Sigma |
| A | 10 | 83 | 564706 | 4790.37 | 574 | 562 | 117.8 |
| A | 15 | 237 | 431883 | 3662.52 | 574 | 562 | 117.8 |
| A | 13 | 6 | 10088 | 80.89 | 574 | 562 | 117.8 |
| B | 5 | 172 | 202034 | 1799.54 | 575 | 558 | 112.0 |
| B | 0 | 189 | 126452 | 1124.46 | 575 | 558 | 112.0 |
| B | 5 | 255 | 94529 | 839.33 | 575 | 558 | 112.0 |
| C | 15 | 214 | 214874 | 1611.98 | 572 | 576 | 132.9 |
| C | 3 | 233 | 156721 | 1174.54 | 572 | 576 | 132.9 |
| C | 2 | 16 | 13974 | 100.78 | 572 | 576 | 132.9 |
| D | 1 | 52 | 493396 | 3626.71 | 564 | 551 | 135.9 |
| D | 13 | 249 | 147577 | 1081.92 | 564 | 551 | 135.9 |
| D | 12 | 6 | 66982 | 488.85 | 564 | 551 | 135.9 |
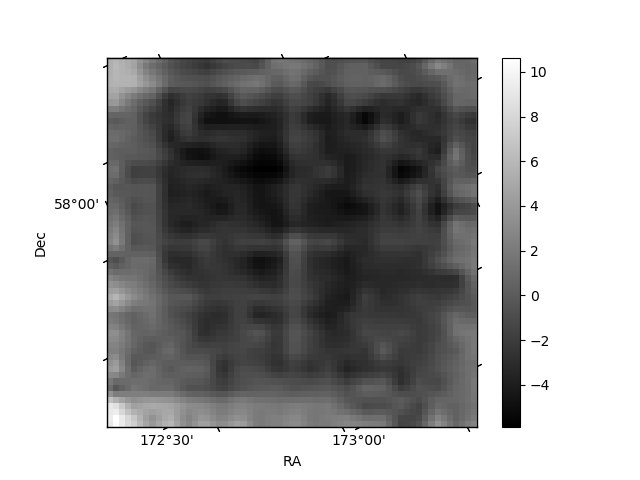
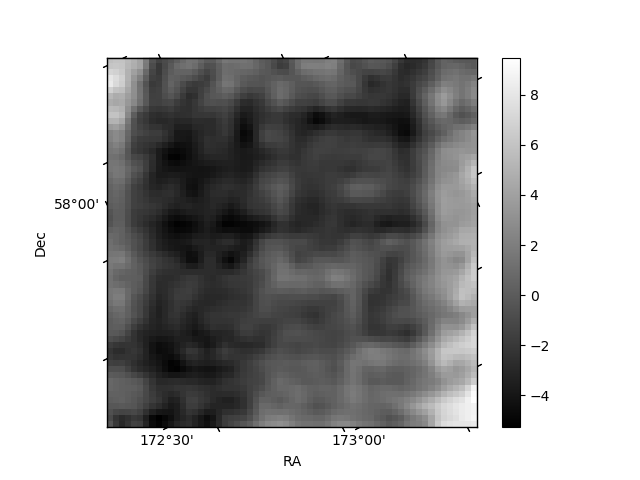
Histogram calculated using DETX and DETY for each event in the final _common_clean file
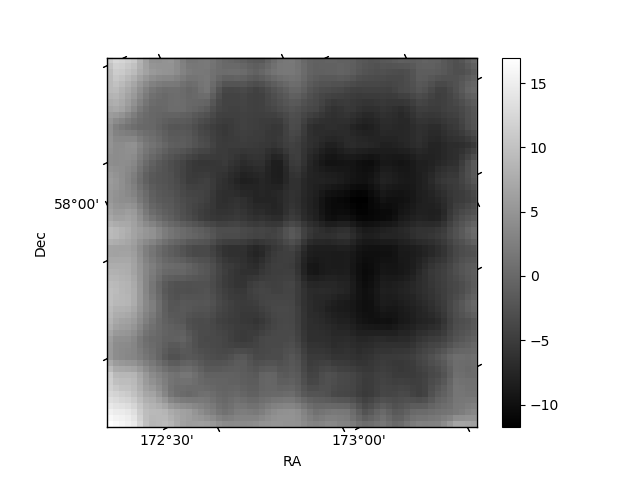
| Quadrant A | 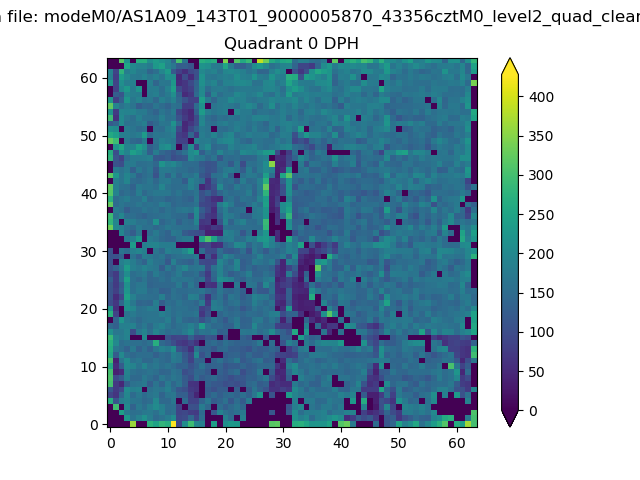 |
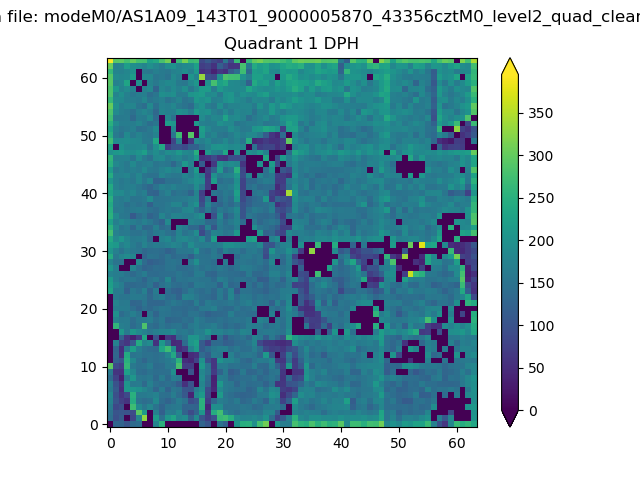 |
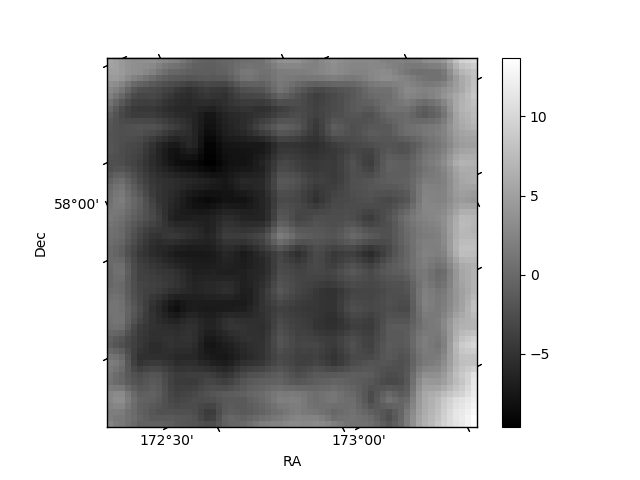
Quadrant B |
|---|---|---|---|
| Quadrant D | 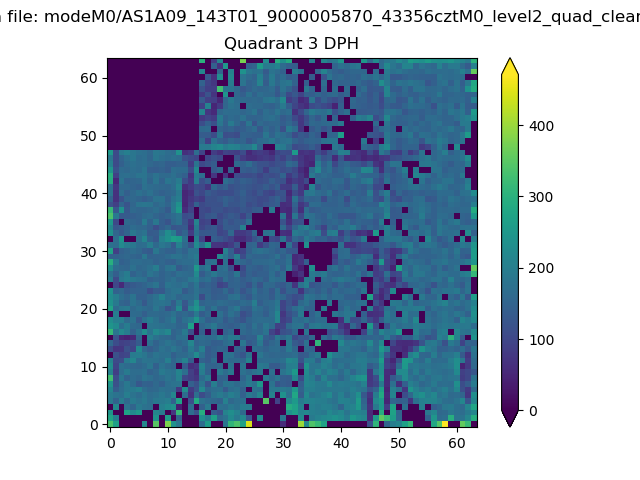 |
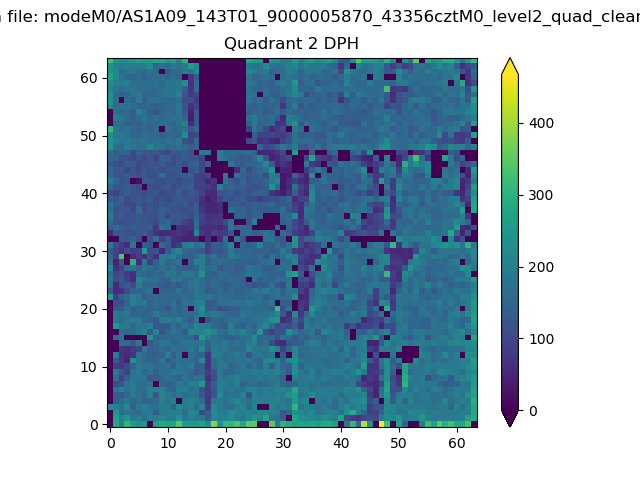 |
Quadrant C |
| Plot type | Count rate plots | Images |
|---|---|---|
| Comparison with Poisson distribution Blue bars denote a histogram of data divided into 1 sec bins. Red curve is a Poisson curve with rate = median count rate of data. |
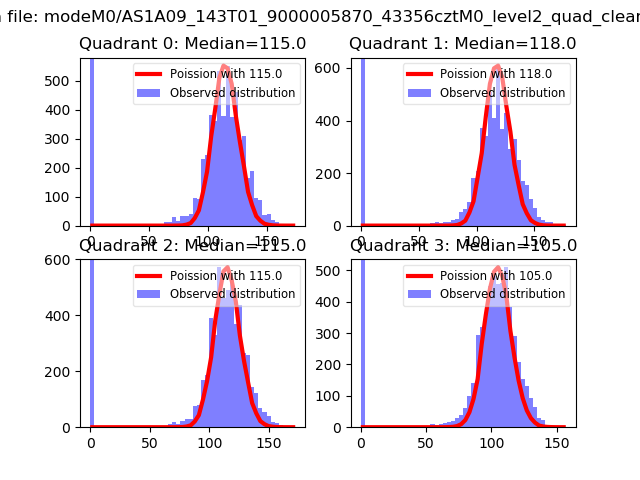 |
 |
| Quadrant-wise count rates Data is divided into 100 sec bins |
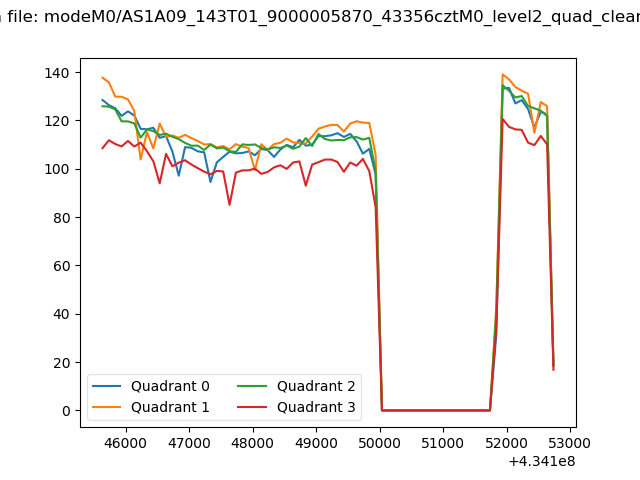 |
|
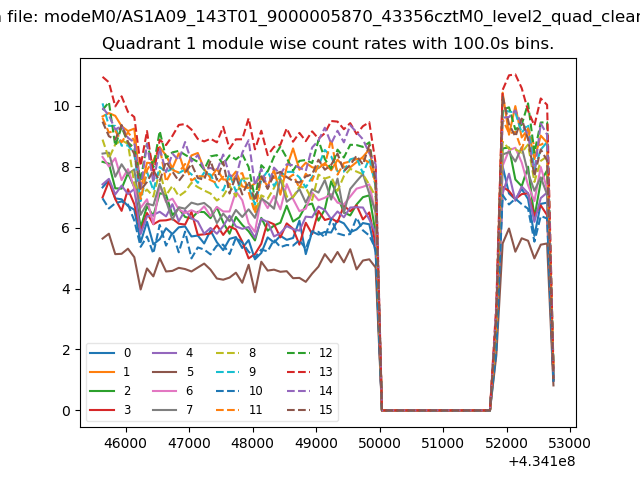
| Module-wise count rates for Quadrant A Data is divided into 100 sec bins |
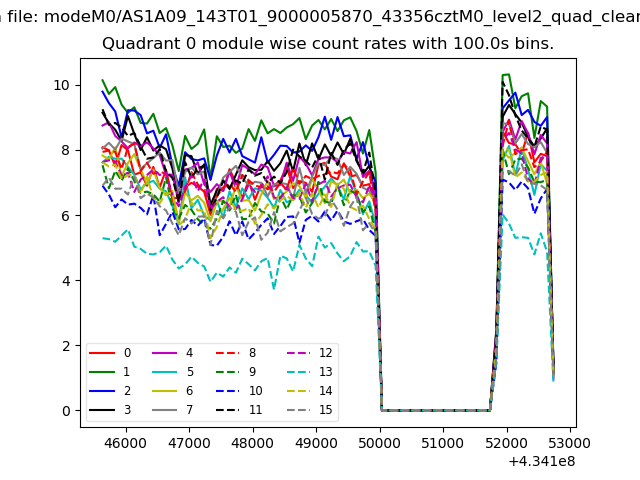 |
 |
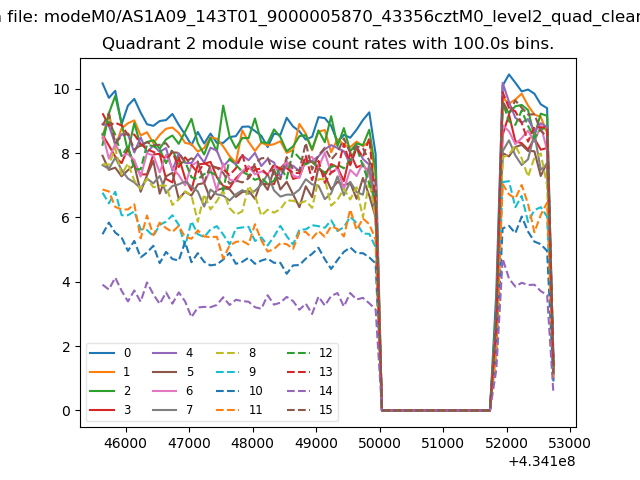
| Module-wise count rates for Quadrant B Data is divided into 100 sec bins |
 |
 |
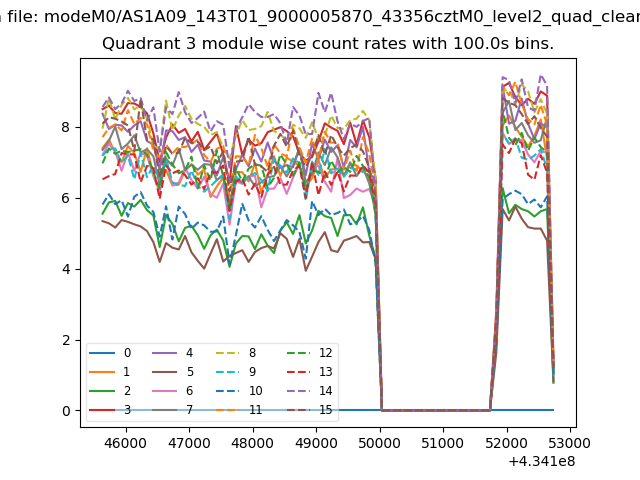
| Module-wise count rates for Quadrant C Data is divided into 100 sec bins |
 |
 |
| Module-wise count rates for Quadrant D Data is divided into 100 sec bins |
 |
 |
| Parameter | Plot |
|---|---|
| CZT HV Monitor | 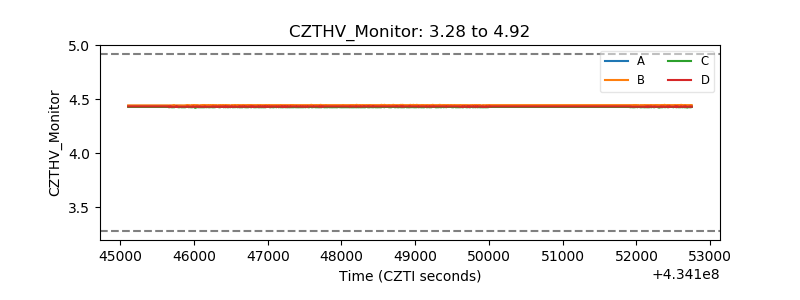 |
| D_VDD | 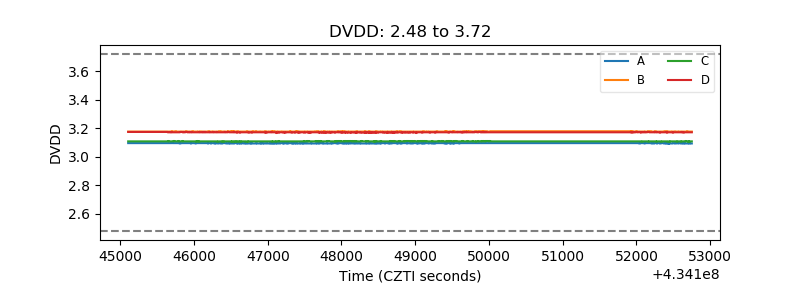 |
| Temperature 1 | 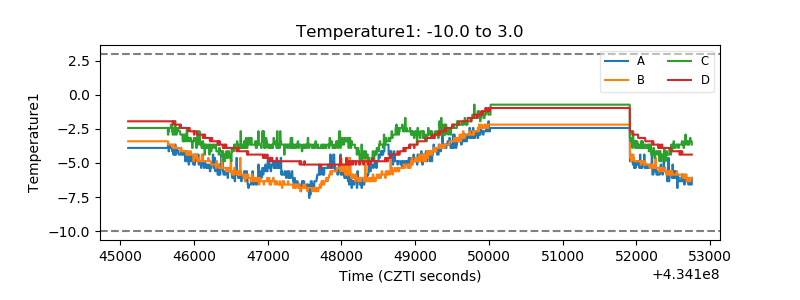 |
| Veto HV Monitor |  |
| Veto LLD | 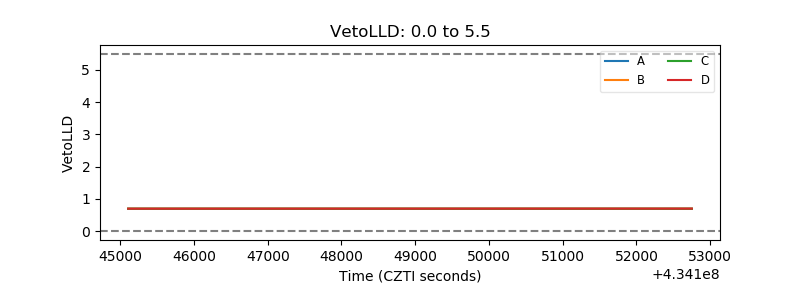 |
| Alpha Counter | 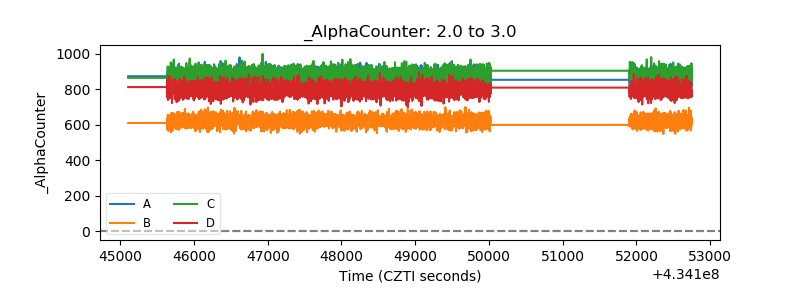 |
| _CPM_Rate | 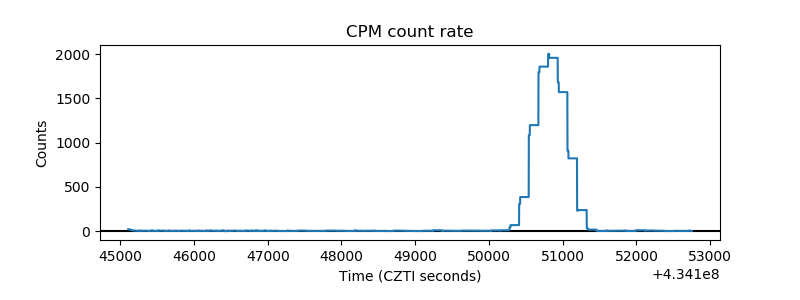 |
| CZT Counter | 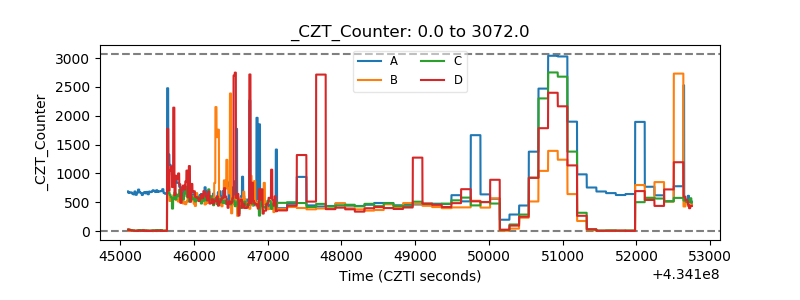 |
| +2.5 Volts monitor | 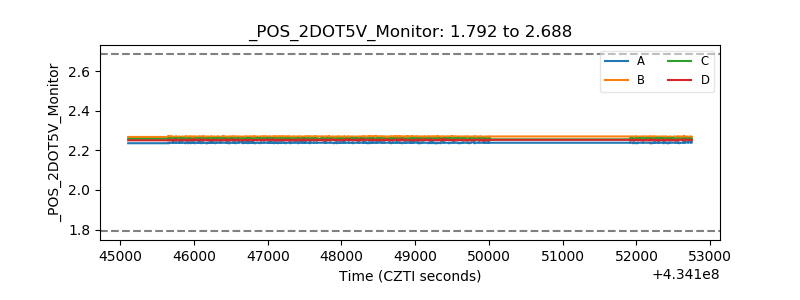 |
| +5 Volts monitor | 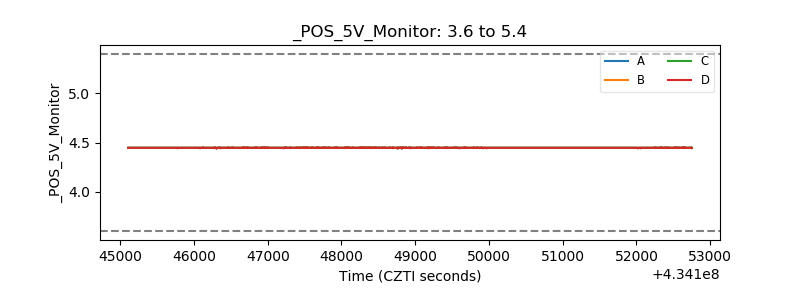 |
| _ROLL_ROT | 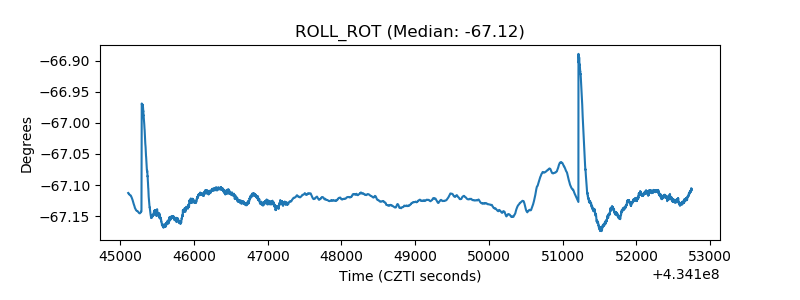 |
| _Roll_DEC | 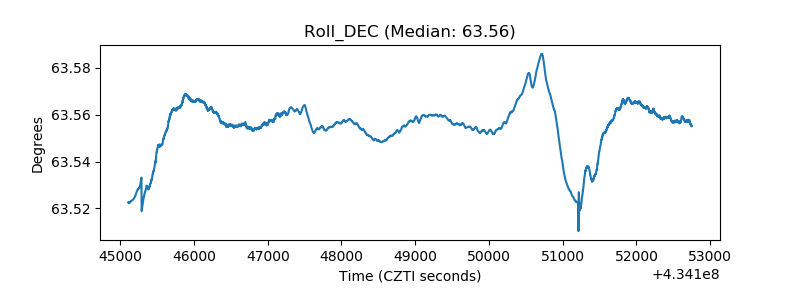 |
| _Roll_RA | 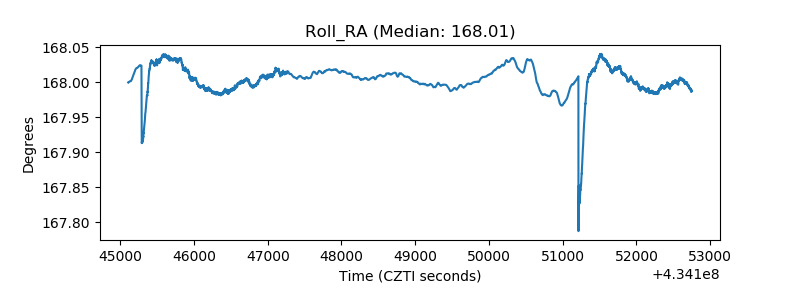 |
| Veto Counter | 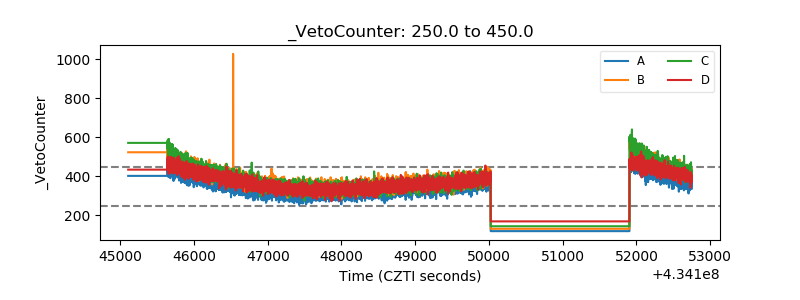 |