| Param | Original file | Final file |
|---|---|---|
| Filename | modeM0/AS1A09_143T01_9000005870_43357cztM0_level2.fits | modeM0/AS1A09_143T01_9000005870_43357cztM0_level2_quad_clean.evt |
| Size (bytes) | 308,825,280 | 88,511,040 |
| Size | 294.5 MB | 84.4 MB |
| Events in quadrant A | 3,310,824 | 576,594 |
| Events in quadrant B | 2,508,410 | 614,540 |
| Events in quadrant C | 2,478,085 | 594,851 |
| Events in quadrant D | 2,741,526 | 540,813 |
| Mode SS | |||
|---|---|---|---|
| Quadrant | BADHDUFLAG | Total packets | Discarded packets |
| A | 0 | 104 | 0 |
| B | 0 | 104 | 0 |
| C | 0 | 104 | 0 |
| D | 0 | 104 | 0 |
| Mode M9 | |||
|---|---|---|---|
| Quadrant | BADHDUFLAG | Total packets | Discarded packets |
| A | 0 | 32 | 0 |
| B | 0 | 33 | 0 |
| C | 0 | 33 | 0 |
| D | 0 | 33 | 0 |
| Mode M0 | |||
|---|---|---|---|
| Quadrant | BADHDUFLAG | Total packets | Discarded packets |
| A | 0 | 12965 | 2 |
| B | 0 | 10722 | 2 |
| C | 0 | 10380 | 2 |
| D | 0 | 11703 | 2 |
| Quadrant | Total seconds | Saturated seconds | Saturation percentage |
|---|---|---|---|
| A | 5039 | 235 | 4.663624% |
| B | 5039 | 31 | 0.615201% |
| C | 5039 | 4 | 0.079381% |
| D | 5039 | 41 | 0.813654% |
Noise dominated data is calculated using 1-second bins in cleaned event files. If a bin has >2000 counts, and if more than 50% of those come from <1% of pixels, then it is considered to be noise-dominated and hence unusable.
| Quadrant | # 1 sec bins | Bins with >0 counts | Bins with >2000 counts | High rate bins dominated by noise | Noise dominated (total time) | Noise dominated (detector-on time) | Marked lightcurve |
|---|---|---|---|---|---|---|---|
| A | 7042 | 5040 | 195 | 195 | 2.77% | 3.87% | 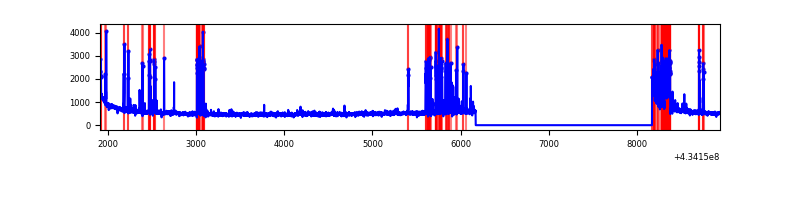 |
| B | 7042 | 5040 | 22 | 22 | 0.31% | 0.44% | 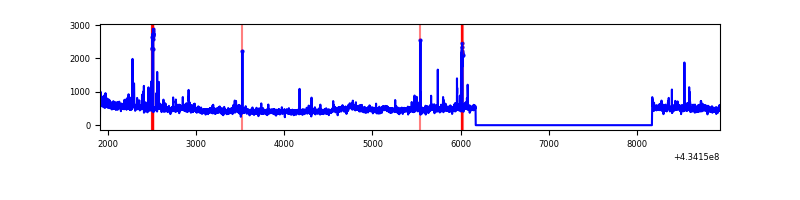 |
| C | 7042 | 5040 | 1 | 1 | 0.01% | 0.02% | 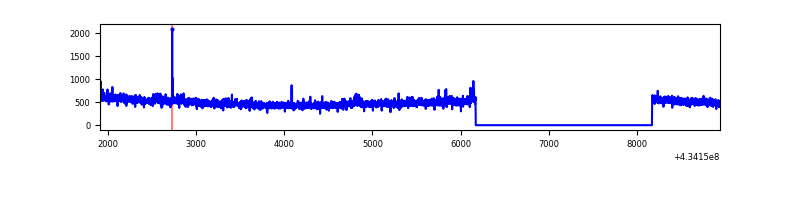 |
| D | 7042 | 5040 | 39 | 39 | 0.55% | 0.77% | 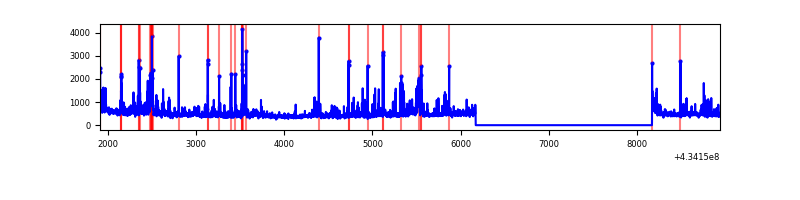 |
Top three noisy pixels from each quadrant. If the there are fewer than three noisy pixels in the level2.evt file, extra rows are filled as -1
| Pixel properties | Quadrant properties | ||||||
|---|---|---|---|---|---|---|---|
| Quadrant | DetID | PixID | Counts | Sigma | Mean | Median | Sigma |
| A | 10 | 83 | 527868 | 4669.45 | 552 | 541 | 112.9 |
| A | 15 | 237 | 429779 | 3800.88 | 552 | 541 | 112.9 |
| A | 13 | 248 | 209046 | 1846.3 | 552 | 541 | 112.9 |
| B | 0 | 189 | 125392 | 1168.69 | 561 | 546 | 106.8 |
| B | 5 | 172 | 79569 | 739.74 | 561 | 546 | 106.8 |
| B | 0 | 190 | 37775 | 348.5 | 561 | 546 | 106.8 |
| C | 15 | 214 | 211555 | 1627.19 | 555 | 559 | 129.7 |
| C | 3 | 233 | 81322 | 622.84 | 555 | 559 | 129.7 |
| C | 14 | 254 | 9516 | 69.08 | 555 | 559 | 129.7 |
| D | 1 | 52 | 342333 | 2558.45 | 547 | 531 | 133.6 |
| D | 13 | 249 | 125050 | 932.05 | 547 | 531 | 133.6 |
| D | 2 | 249 | 50950 | 377.4 | 547 | 531 | 133.6 |
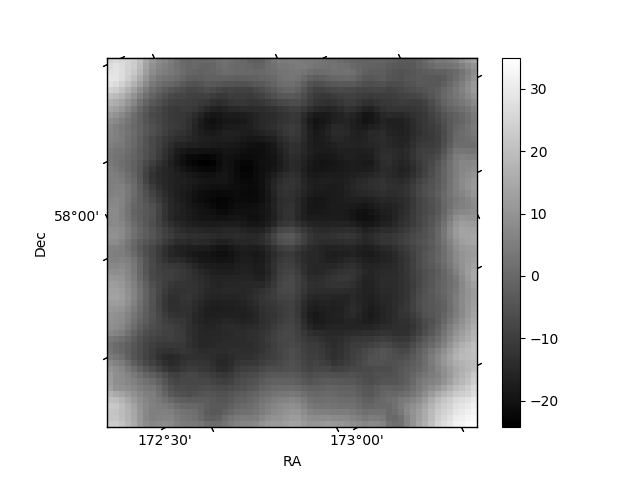
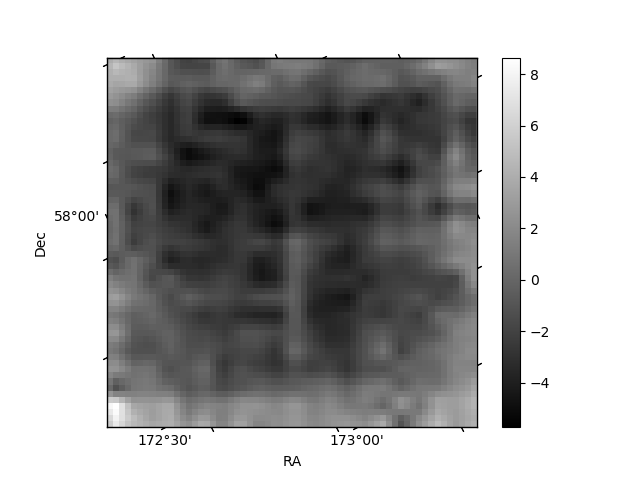
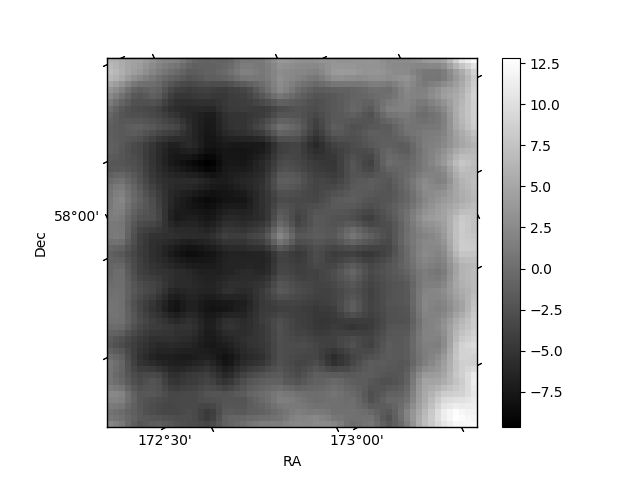
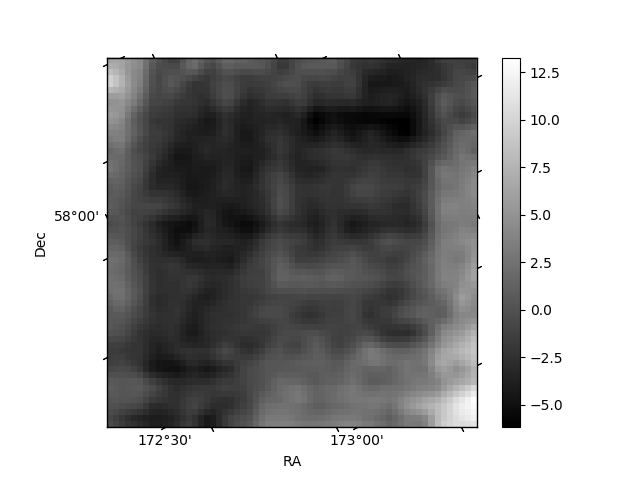
Histogram calculated using DETX and DETY for each event in the final _common_clean file
| Quadrant A | 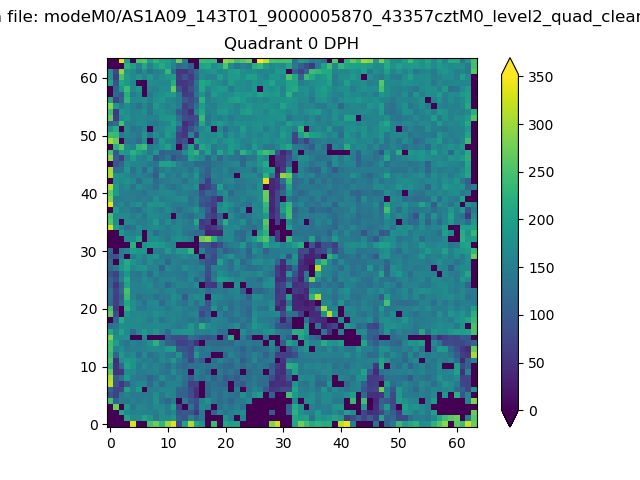 |
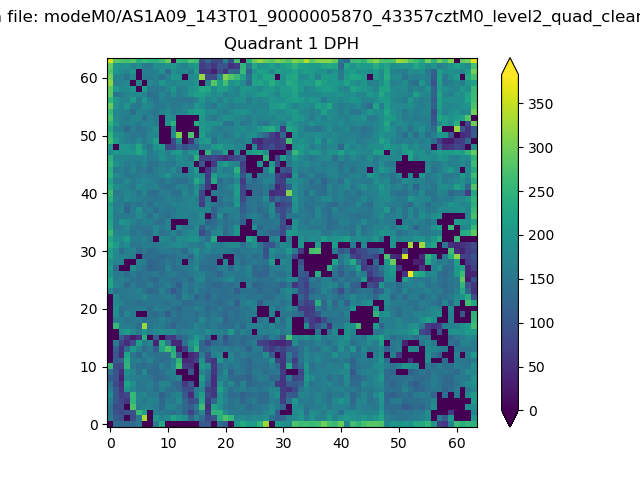 |
Quadrant B |
|---|---|---|---|
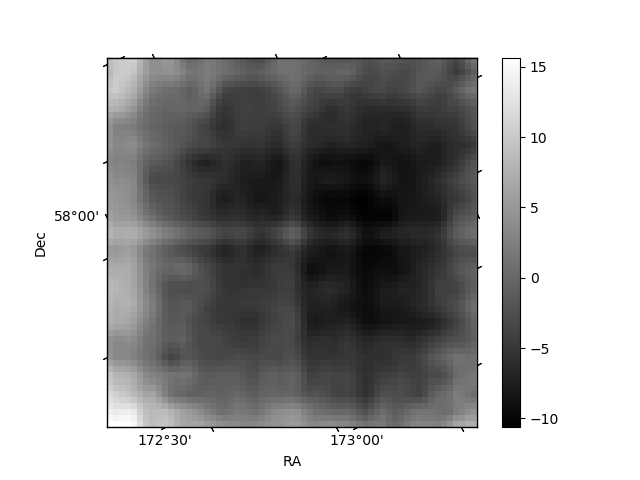
| Quadrant D | 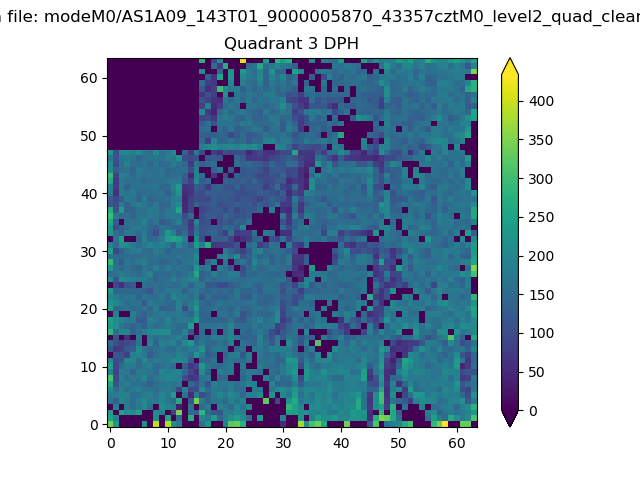 |
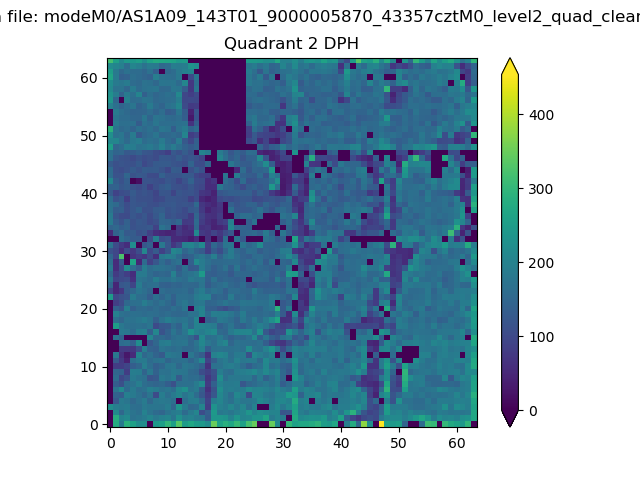 |
Quadrant C |
| Plot type | Count rate plots | Images |
|---|---|---|
| Comparison with Poisson distribution Blue bars denote a histogram of data divided into 1 sec bins. Red curve is a Poisson curve with rate = median count rate of data. |
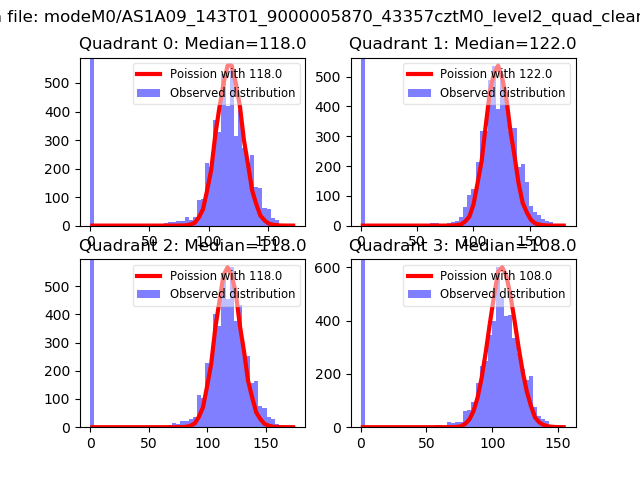 |
 |
| Quadrant-wise count rates Data is divided into 100 sec bins |
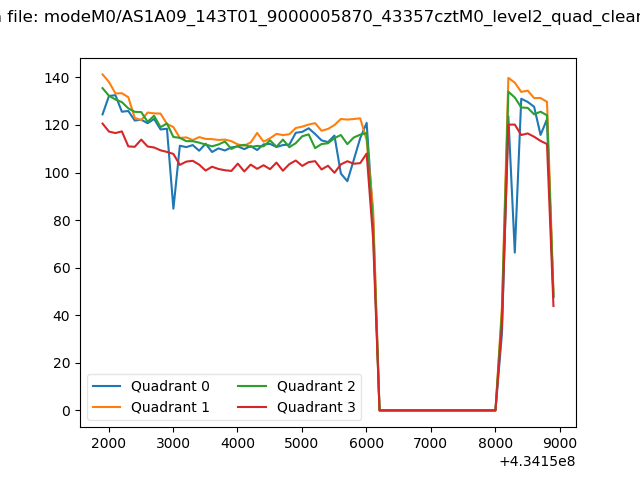 |
|
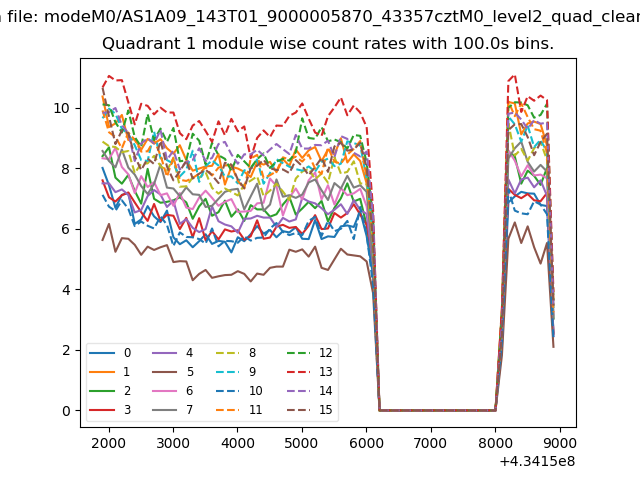
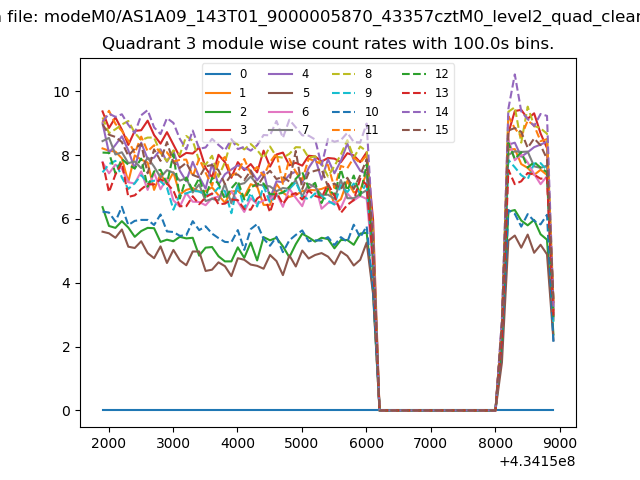
| Module-wise count rates for Quadrant A Data is divided into 100 sec bins |
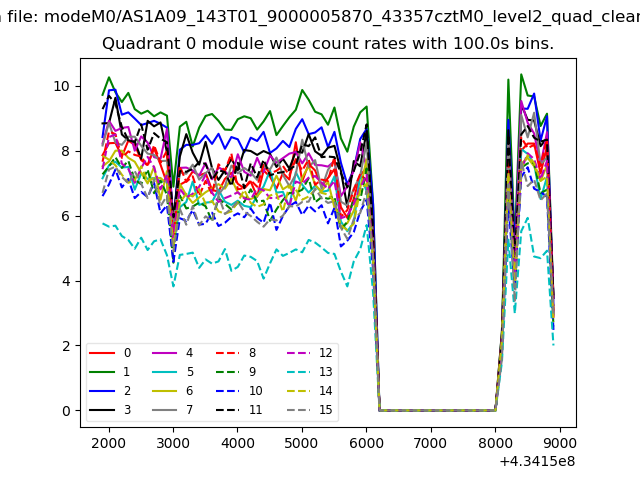 |
 |
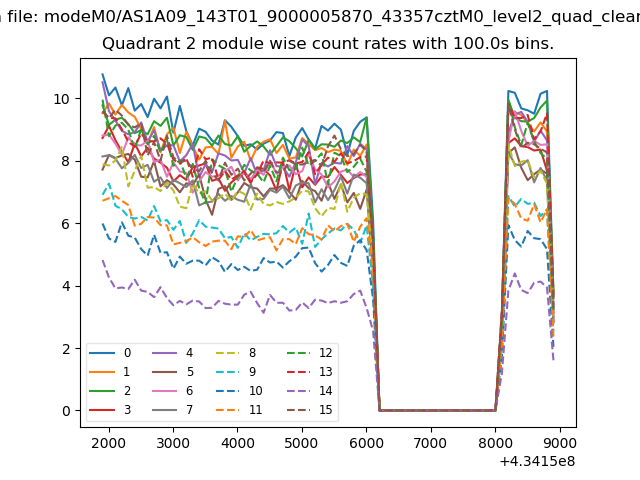
| Module-wise count rates for Quadrant B Data is divided into 100 sec bins |
 |
 |
| Module-wise count rates for Quadrant C Data is divided into 100 sec bins |
 |
 |
| Module-wise count rates for Quadrant D Data is divided into 100 sec bins |
 |
 |
| Parameter | Plot |
|---|---|
| CZT HV Monitor | 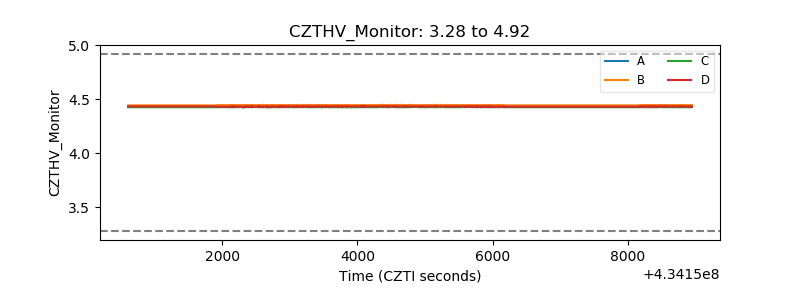 |
| D_VDD | 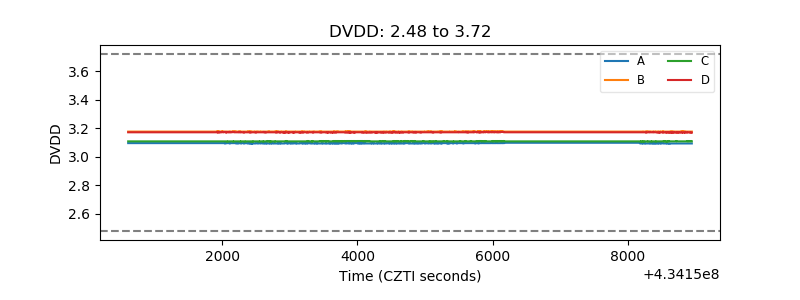 |
| Temperature 1 | 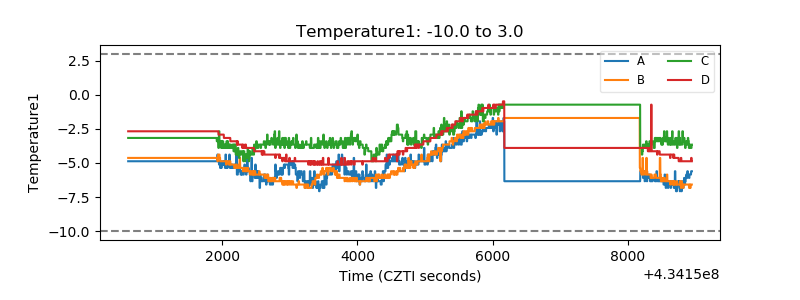 |
| Veto HV Monitor | 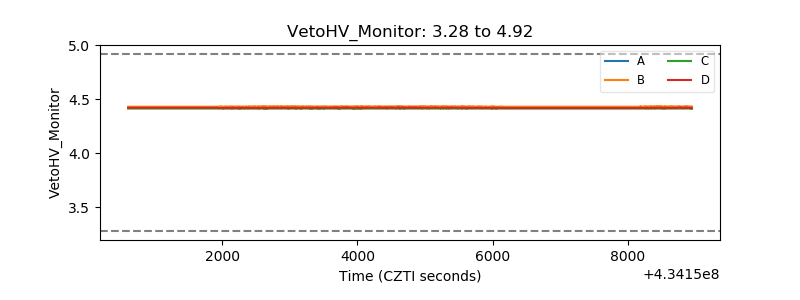 |
| Veto LLD | 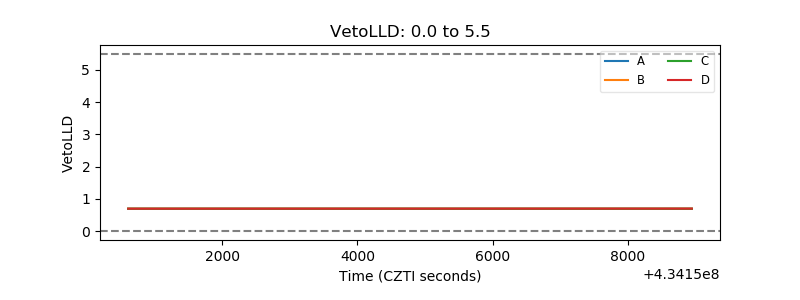 |
| Alpha Counter | 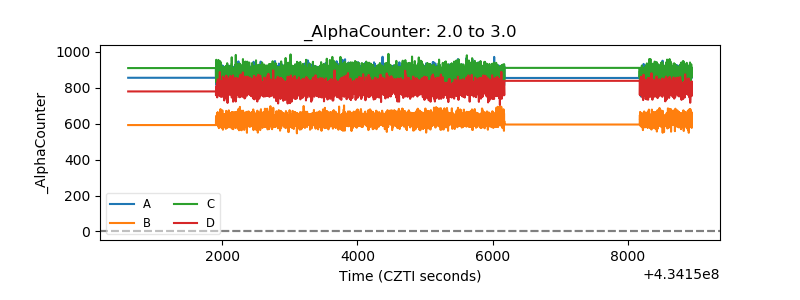 |
| _CPM_Rate | 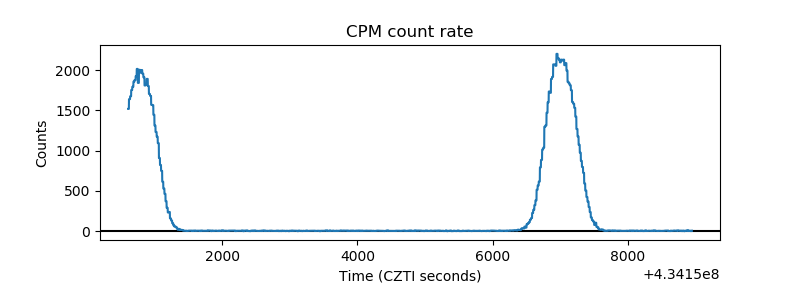 |
| CZT Counter | 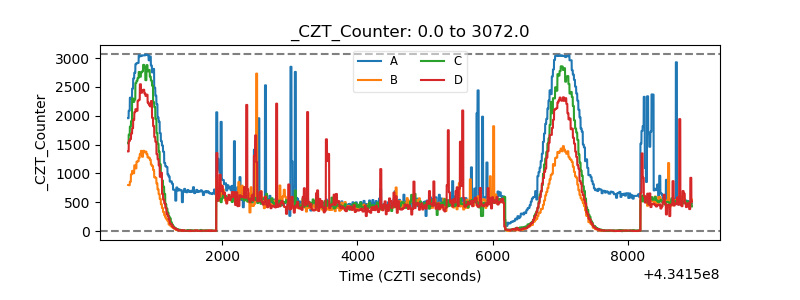 |
| +2.5 Volts monitor | 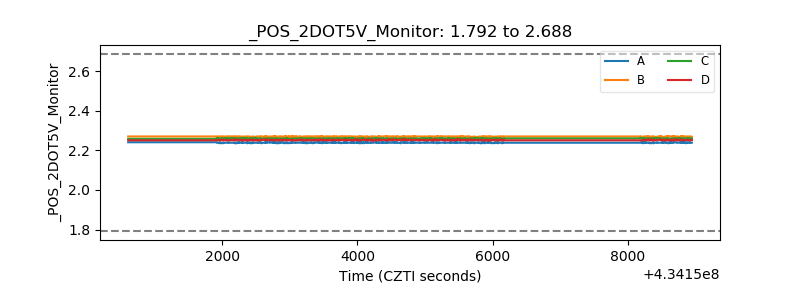 |
| +5 Volts monitor | 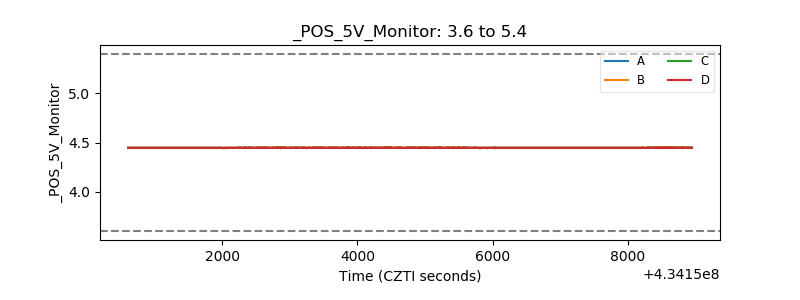 |
| _ROLL_ROT | 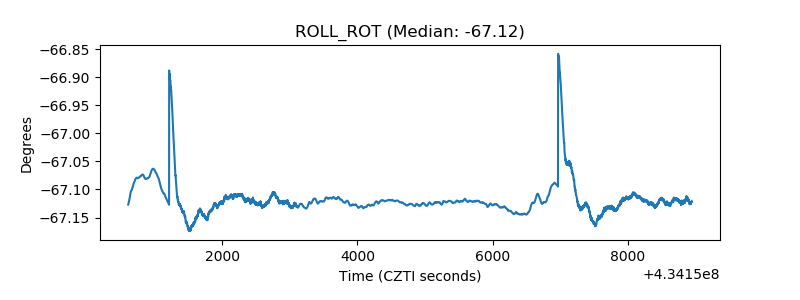 |
| _Roll_DEC | 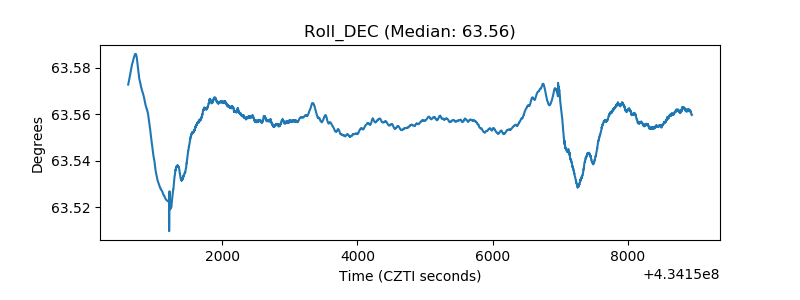 |
| _Roll_RA | 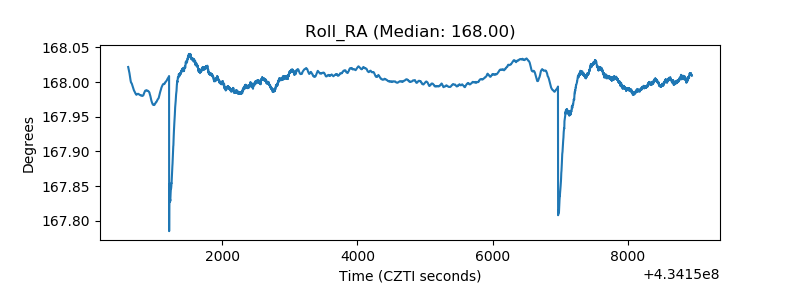 |
| Veto Counter | 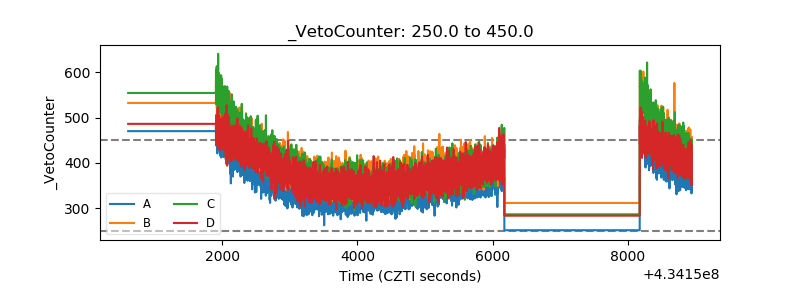 |