| Param | Original file | Final file |
|---|---|---|
| Filename | modeM0/AS1A09_143T01_9000005870_43358cztM0_level2.fits | modeM0/AS1A09_143T01_9000005870_43358cztM0_level2_quad_clean.evt |
| Size (bytes) | 298,998,720 | 90,639,360 |
| Size | 285.1 MB | 86.4 MB |
| Events in quadrant A | 3,230,577 | 596,049 |
| Events in quadrant B | 2,457,131 | 631,456 |
| Events in quadrant C | 2,443,027 | 605,422 |
| Events in quadrant D | 2,535,978 | 551,129 |
| Mode SS | |||
|---|---|---|---|
| Quadrant | BADHDUFLAG | Total packets | Discarded packets |
| A | 0 | 106 | 0 |
| B | 0 | 106 | 0 |
| C | 0 | 106 | 0 |
| D | 0 | 106 | 0 |
| Mode M9 | |||
|---|---|---|---|
| Quadrant | BADHDUFLAG | Total packets | Discarded packets |
| A | 0 | 29 | 0 |
| B | 0 | 30 | 0 |
| C | 0 | 30 | 0 |
| D | 0 | 30 | 0 |
| Mode M0 | |||
|---|---|---|---|
| Quadrant | BADHDUFLAG | Total packets | Discarded packets |
| A | 0 | 12722 | 2 |
| B | 0 | 10658 | 2 |
| C | 0 | 10411 | 2 |
| D | 0 | 11348 | 2 |
| Quadrant | Total seconds | Saturated seconds | Saturation percentage |
|---|---|---|---|
| A | 5144 | 163 | 3.168740% |
| B | 5144 | 11 | 0.213841% |
| C | 5144 | 3 | 0.058320% |
| D | 5144 | 19 | 0.369362% |
Noise dominated data is calculated using 1-second bins in cleaned event files. If a bin has >2000 counts, and if more than 50% of those come from <1% of pixels, then it is considered to be noise-dominated and hence unusable.
| Quadrant | # 1 sec bins | Bins with >0 counts | Bins with >2000 counts | High rate bins dominated by noise | Noise dominated (total time) | Noise dominated (detector-on time) | Marked lightcurve |
|---|---|---|---|---|---|---|---|
| A | 7236 | 5145 | 135 | 135 | 1.87% | 2.62% | 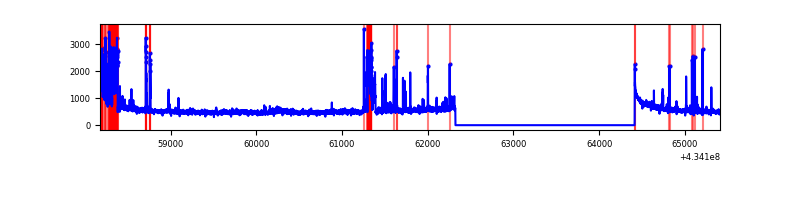 |
| B | 7236 | 5145 | 5 | 5 | 0.07% | 0.10% | 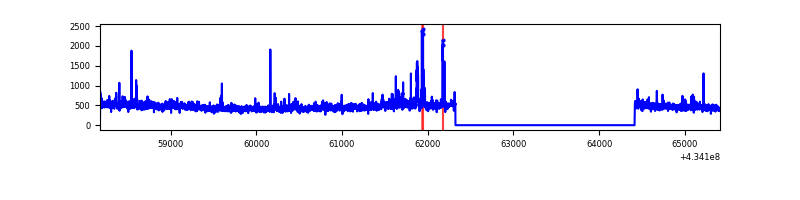 |
| C | 7236 | 5145 | 0 | 0 | 0.00% | 0.00% | 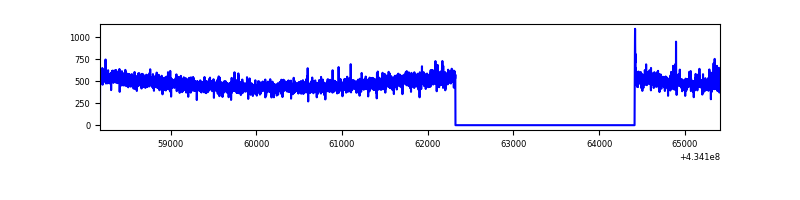 |
| D | 7236 | 5145 | 19 | 19 | 0.26% | 0.37% | 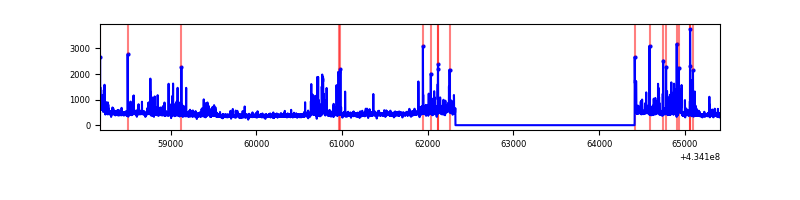 |
Top three noisy pixels from each quadrant. If the there are fewer than three noisy pixels in the level2.evt file, extra rows are filled as -1
| Pixel properties | Quadrant properties | ||||||
|---|---|---|---|---|---|---|---|
| Quadrant | DetID | PixID | Counts | Sigma | Mean | Median | Sigma |
| A | 10 | 83 | 536658 | 4650.95 | 565 | 555 | 115.3 |
| A | 13 | 248 | 398331 | 3450.9 | 565 | 555 | 115.3 |
| A | 15 | 237 | 94547 | 815.43 | 565 | 555 | 115.3 |
| B | 0 | 189 | 121128 | 1112.33 | 572 | 558 | 108.4 |
| B | 5 | 172 | 19357 | 173.43 | 572 | 558 | 108.4 |
| B | 5 | 255 | 18785 | 168.16 | 572 | 558 | 108.4 |
| C | 15 | 214 | 214721 | 1659.79 | 558 | 563 | 129.0 |
| C | 3 | 233 | 39668 | 303.08 | 558 | 563 | 129.0 |
| C | 7 | 220 | 5849 | 40.97 | 558 | 563 | 129.0 |
| D | 12 | 233 | 119684 | 894.18 | 550 | 535 | 133.2 |
| D | 1 | 52 | 82055 | 611.78 | 550 | 535 | 133.2 |
| D | 13 | 249 | 80065 | 596.85 | 550 | 535 | 133.2 |
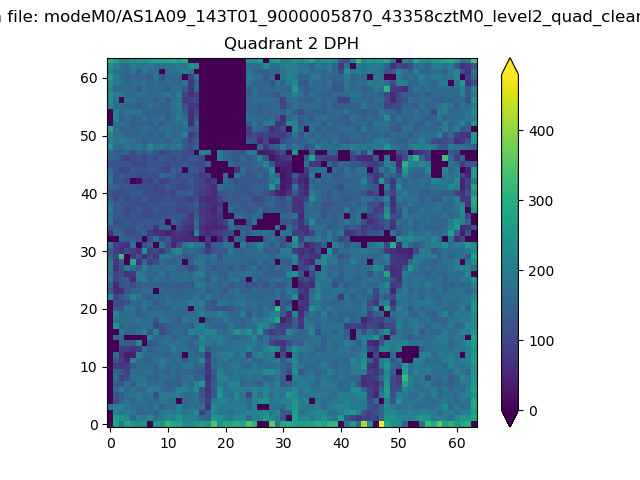
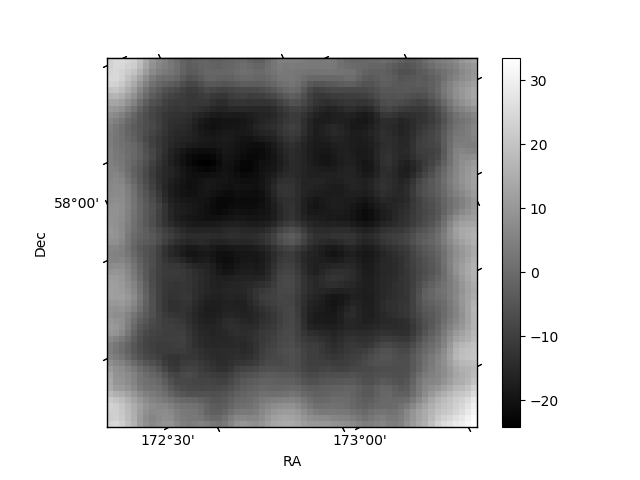
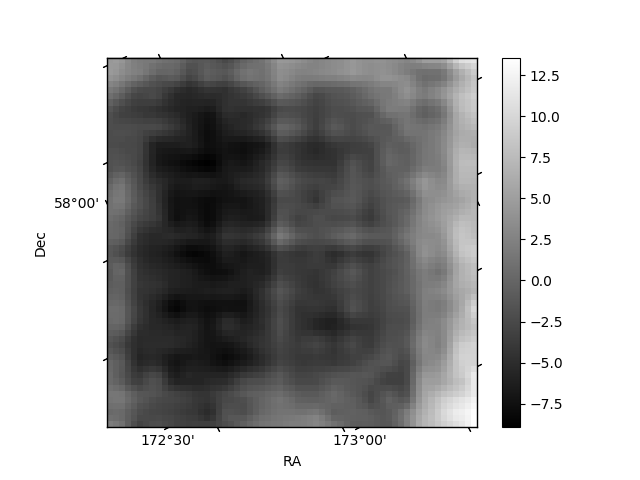
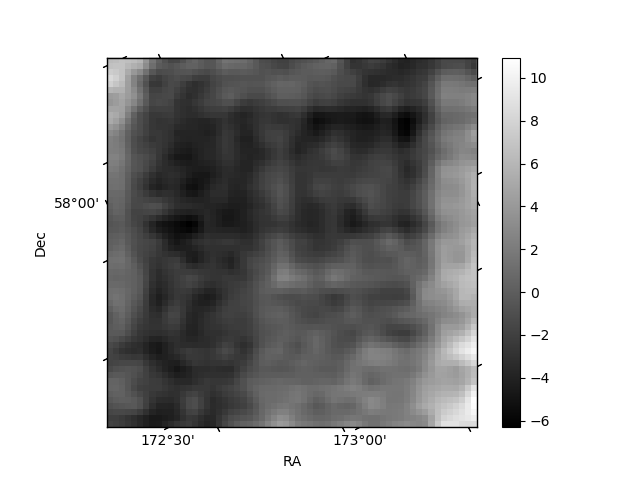
Histogram calculated using DETX and DETY for each event in the final _common_clean file
| Quadrant A | 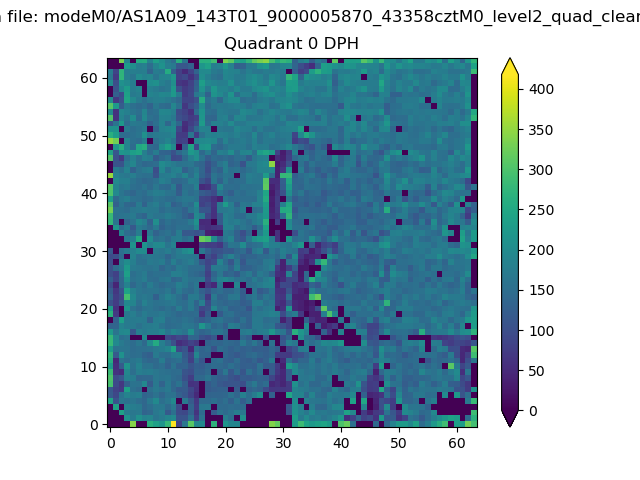 |
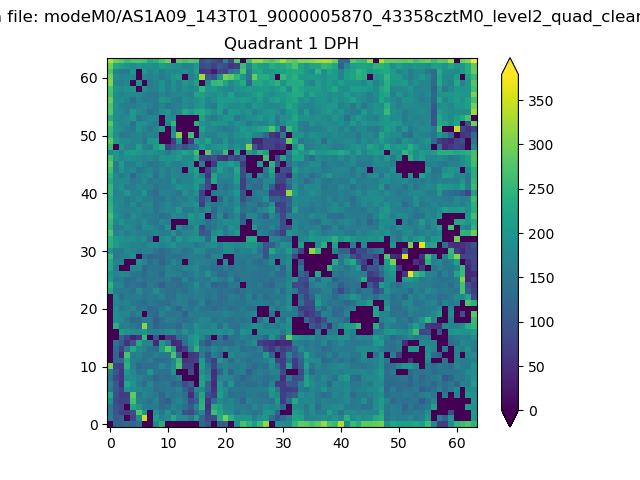 |
Quadrant B |
|---|---|---|---|
| Quadrant D | 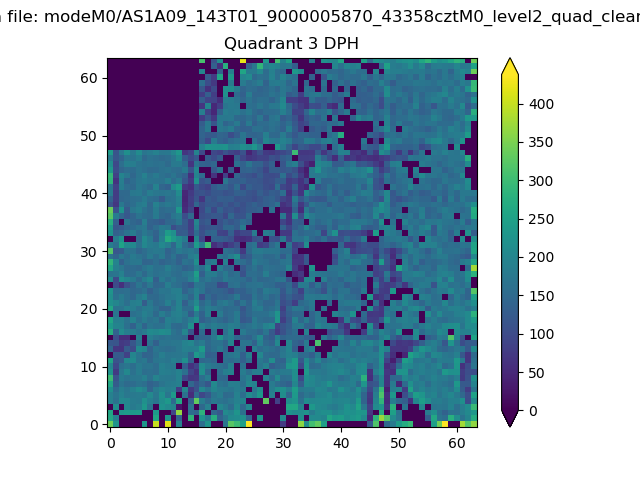 |
 |
Quadrant C |
| Plot type | Count rate plots | Images |
|---|---|---|
| Comparison with Poisson distribution Blue bars denote a histogram of data divided into 1 sec bins. Red curve is a Poisson curve with rate = median count rate of data. |
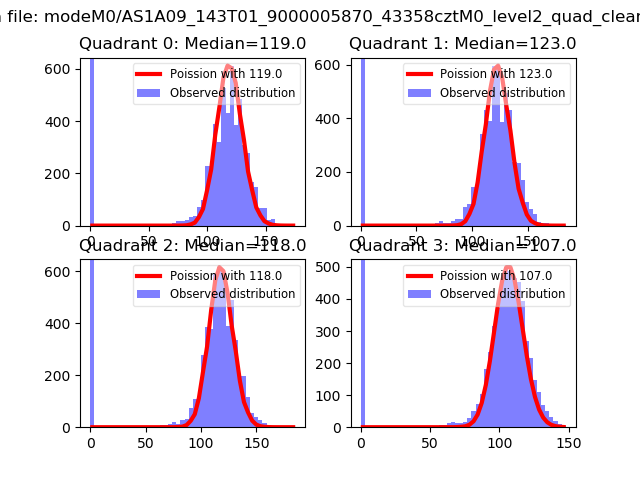 |
 |
| Quadrant-wise count rates Data is divided into 100 sec bins |
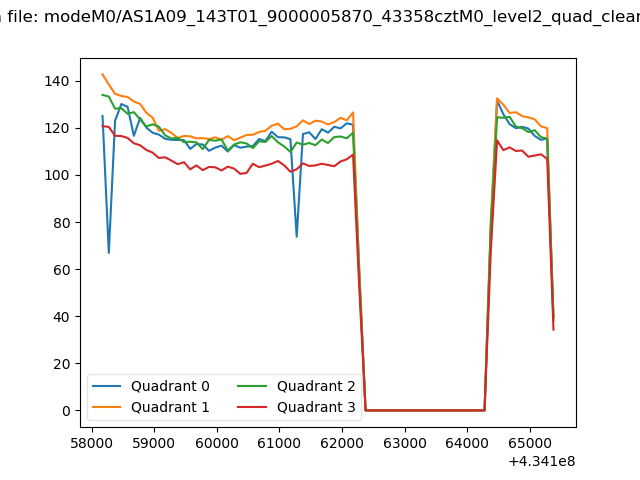 |
|
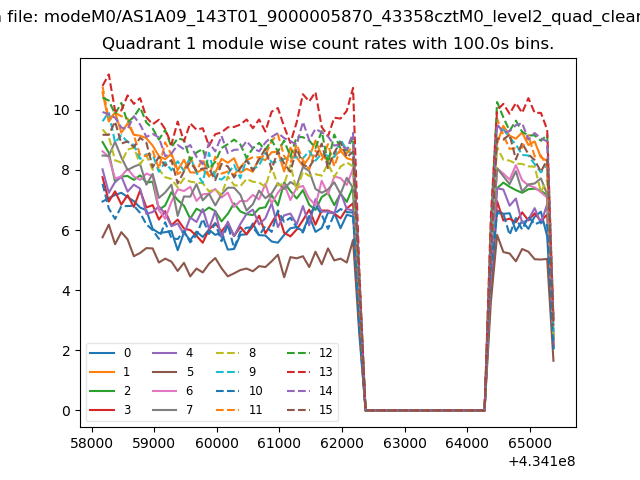
| Module-wise count rates for Quadrant A Data is divided into 100 sec bins |
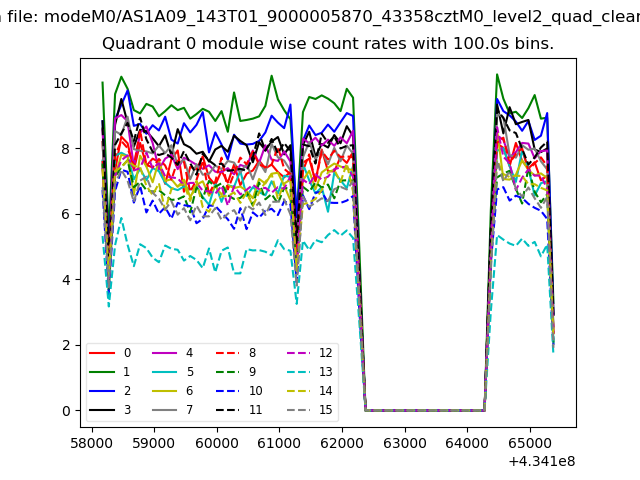 |
 |
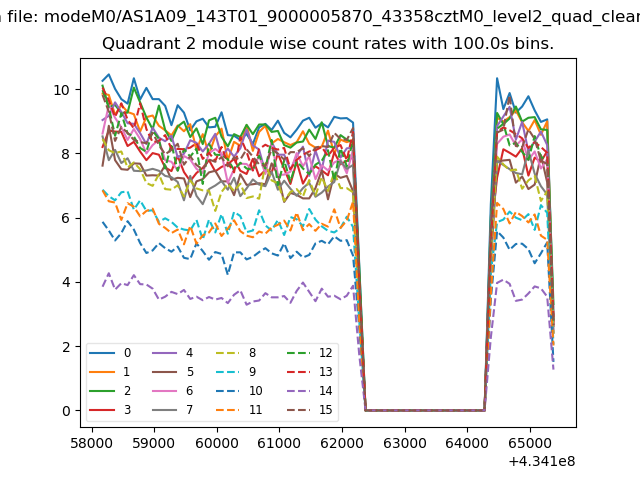
| Module-wise count rates for Quadrant B Data is divided into 100 sec bins |
 |
 |
| Module-wise count rates for Quadrant C Data is divided into 100 sec bins |
 |
 |
| Module-wise count rates for Quadrant D Data is divided into 100 sec bins |
 |
 |
| Parameter | Plot |
|---|---|
| CZT HV Monitor | 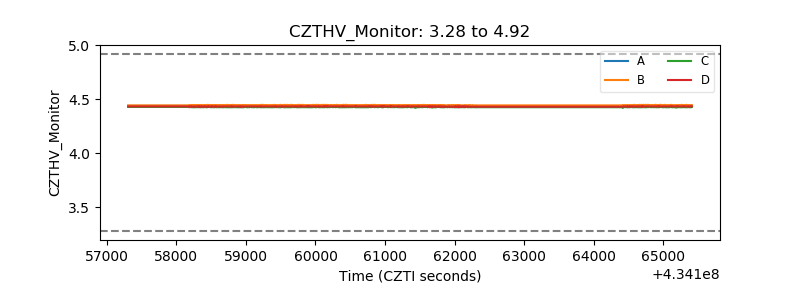 |
| D_VDD | 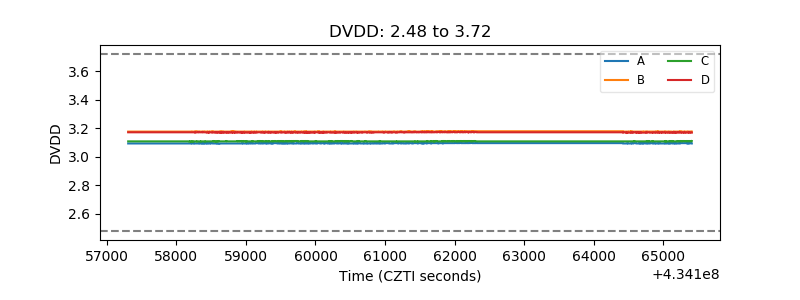 |
| Temperature 1 | 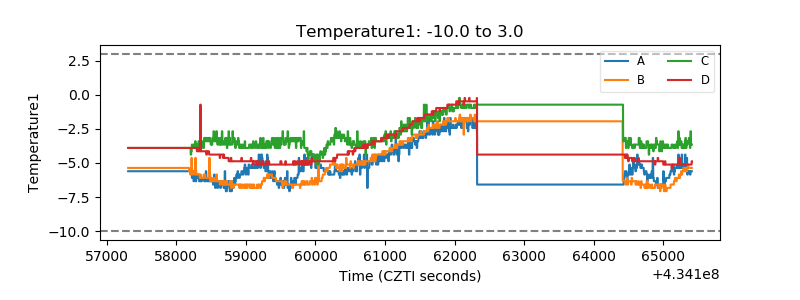 |
| Veto HV Monitor | 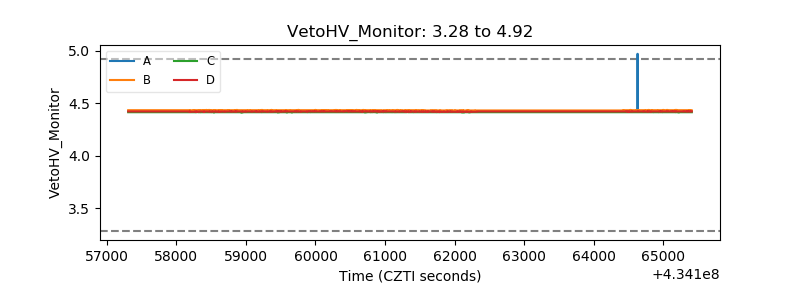 |
| Veto LLD | 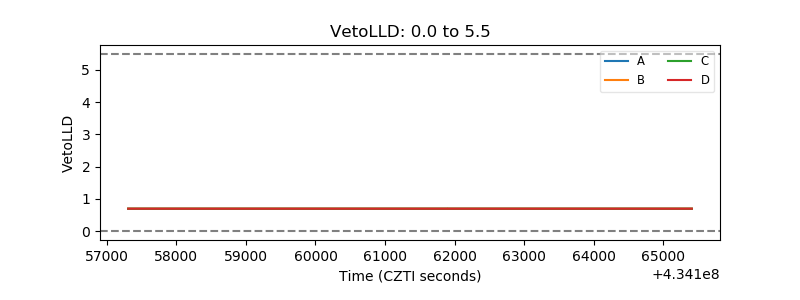 |
| Alpha Counter | 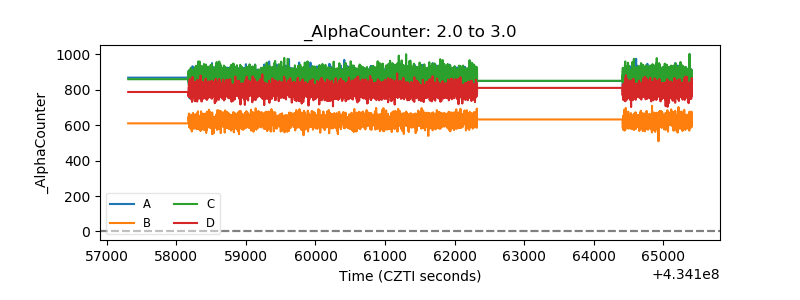 |
| _CPM_Rate | 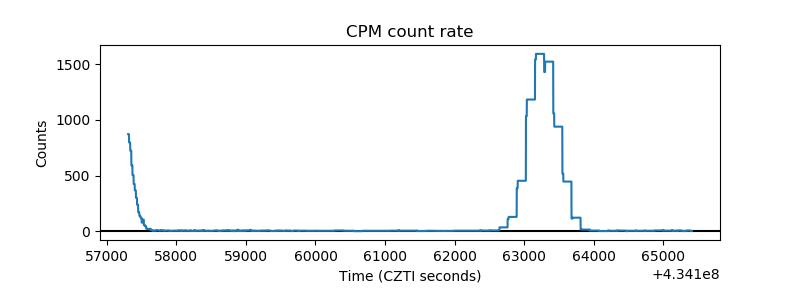 |
| CZT Counter | 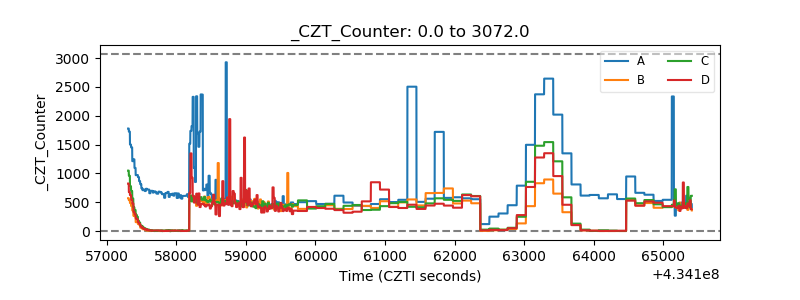 |
| +2.5 Volts monitor | 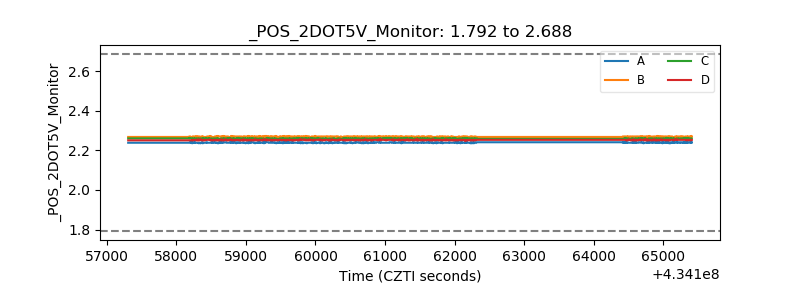 |
| +5 Volts monitor | 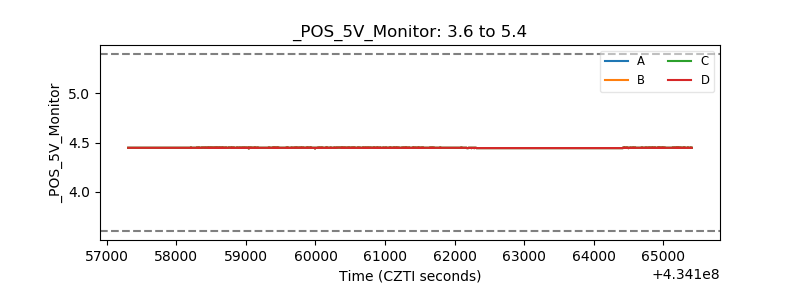 |
| _ROLL_ROT | 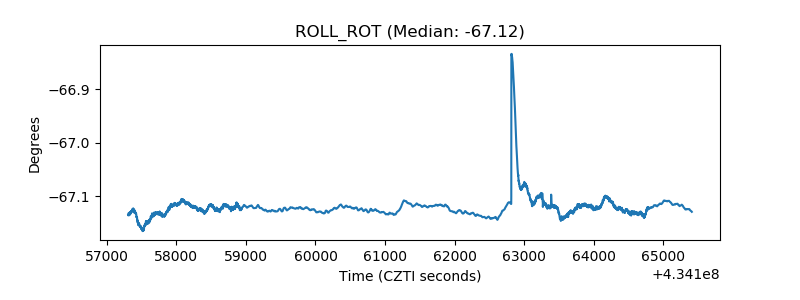 |
| _Roll_DEC | 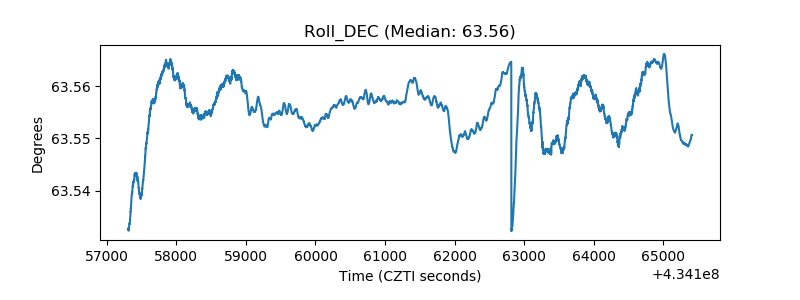 |
| _Roll_RA | 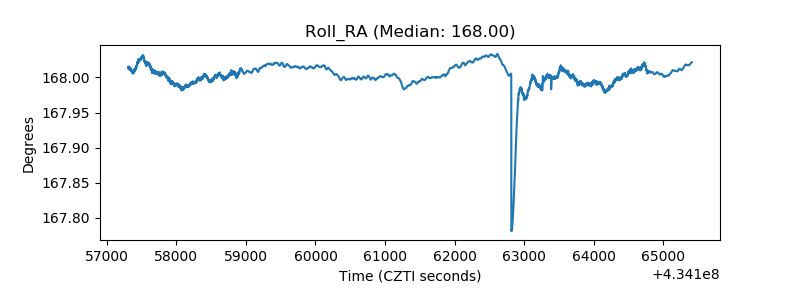 |
| Veto Counter | 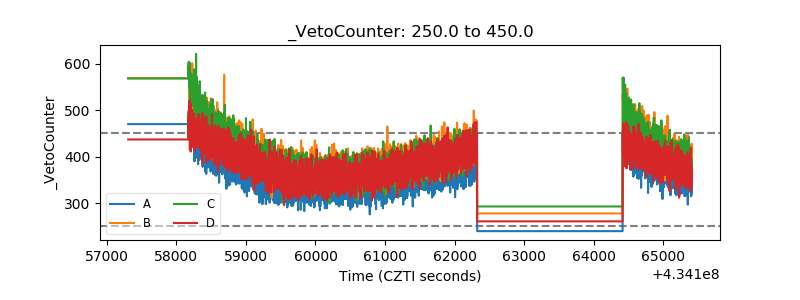 |