| Param | Original file | Final file |
|---|---|---|
| Filename | modeM0/AS1A09_143T01_9000005870_43360cztM0_level2.fits | modeM0/AS1A09_143T01_9000005870_43360cztM0_level2_quad_clean.evt |
| Size (bytes) | 325,330,560 | 82,019,520 |
| Size | 310.3 MB | 78.2 MB |
| Events in quadrant A | 3,015,344 | 547,708 |
| Events in quadrant B | 2,345,160 | 574,787 |
| Events in quadrant C | 2,343,830 | 545,866 |
| Events in quadrant D | 3,947,916 | 464,064 |
| Mode SS | |||
|---|---|---|---|
| Quadrant | BADHDUFLAG | Total packets | Discarded packets |
| A | 0 | 102 | 0 |
| B | 0 | 102 | 0 |
| C | 0 | 102 | 0 |
| D | 0 | 102 | 0 |
| Mode M9 | |||
|---|---|---|---|
| Quadrant | BADHDUFLAG | Total packets | Discarded packets |
| A | 0 | 30 | 0 |
| B | 0 | 31 | 0 |
| C | 0 | 31 | 0 |
| D | 0 | 31 | 0 |
| Mode M0 | |||
|---|---|---|---|
| Quadrant | BADHDUFLAG | Total packets | Discarded packets |
| A | 0 | 12074 | 22 |
| B | 0 | 10514 | 19 |
| C | 0 | 10156 | 18 |
| D | 0 | 15537 | 20 |
| Quadrant | Total seconds | Saturated seconds | Saturation percentage |
|---|---|---|---|
| A | 5012 | 128 | 2.553871% |
| B | 5006 | 32 | 0.639233% |
| C | 5007 | 2 | 0.039944% |
| D | 5007 | 480 | 9.586579% |
Noise dominated data is calculated using 1-second bins in cleaned event files. If a bin has >2000 counts, and if more than 50% of those come from <1% of pixels, then it is considered to be noise-dominated and hence unusable.
| Quadrant | # 1 sec bins | Bins with >0 counts | Bins with >2000 counts | High rate bins dominated by noise | Noise dominated (total time) | Noise dominated (detector-on time) | Marked lightcurve |
|---|---|---|---|---|---|---|---|
| A | 7111 | 5018 | 97 | 97 | 1.36% | 1.93% | 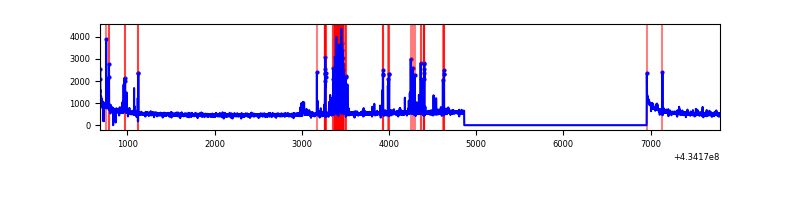 |
| B | 7111 | 5014 | 18 | 18 | 0.25% | 0.36% | 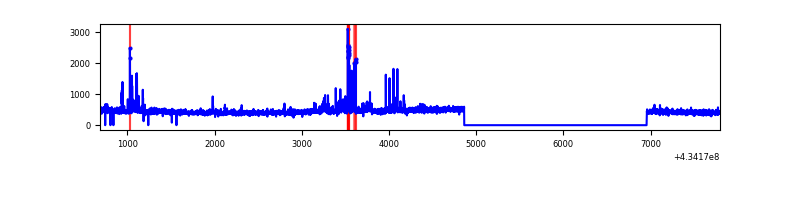 |
| C | 7111 | 5014 | 0 | 0 | 0.00% | 0.00% | 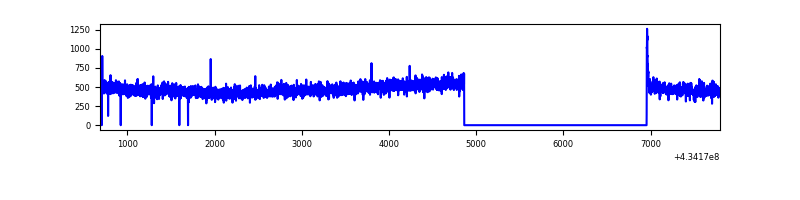 |
| D | 7111 | 5013 | 461 | 461 | 6.48% | 9.20% | 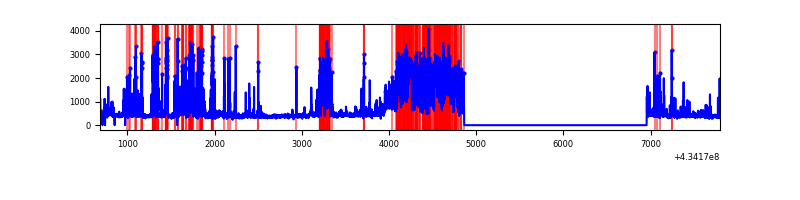 |
Top three noisy pixels from each quadrant. If the there are fewer than three noisy pixels in the level2.evt file, extra rows are filled as -1
| Pixel properties | Quadrant properties | ||||||
|---|---|---|---|---|---|---|---|
| Quadrant | DetID | PixID | Counts | Sigma | Mean | Median | Sigma |
| A | 10 | 83 | 554365 | 5063.44 | 533 | 521 | 109.4 |
| A | 15 | 237 | 241677 | 2204.74 | 533 | 521 | 109.4 |
| A | 13 | 248 | 147522 | 1343.94 | 533 | 521 | 109.4 |
| B | 5 | 172 | 108398 | 1041.01 | 536 | 520 | 103.6 |
| B | 0 | 189 | 89294 | 856.66 | 536 | 520 | 103.6 |
| B | 0 | 186 | 17217 | 161.12 | 536 | 520 | 103.6 |
| C | 15 | 214 | 209668 | 1730.69 | 520 | 522 | 120.8 |
| C | 3 | 233 | 84359 | 693.75 | 520 | 522 | 120.8 |
| C | 7 | 220 | 14591 | 116.42 | 520 | 522 | 120.8 |
| D | 1 | 52 | 1508218 | 12243.12 | 499 | 485 | 123.1 |
| D | 12 | 233 | 180791 | 1464.12 | 499 | 485 | 123.1 |
| D | 12 | 218 | 115595 | 934.72 | 499 | 485 | 123.1 |
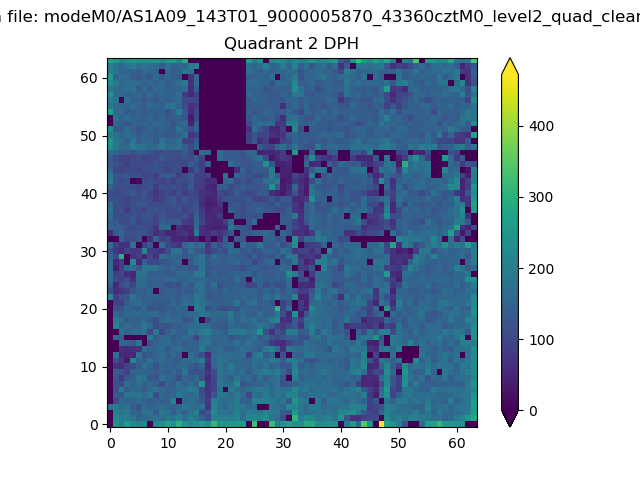
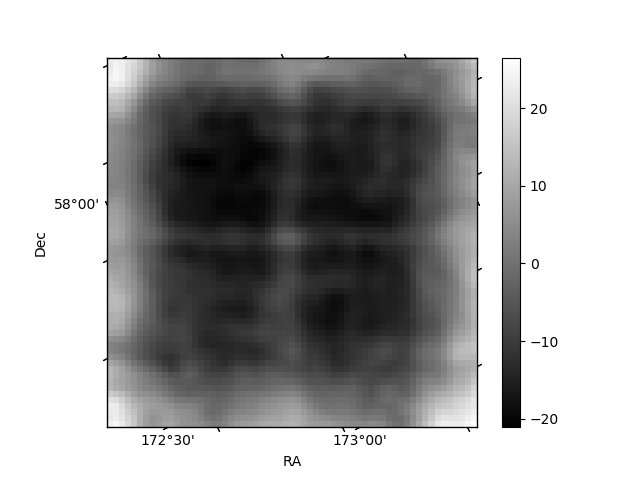
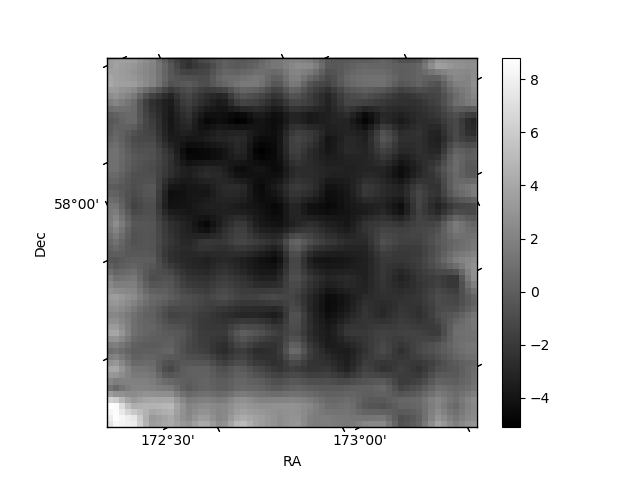
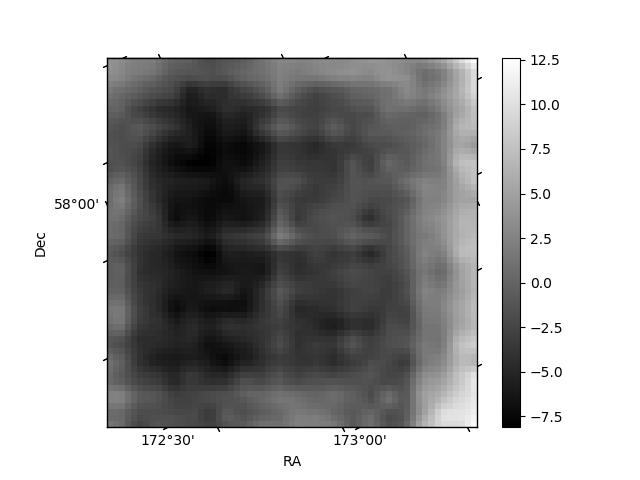
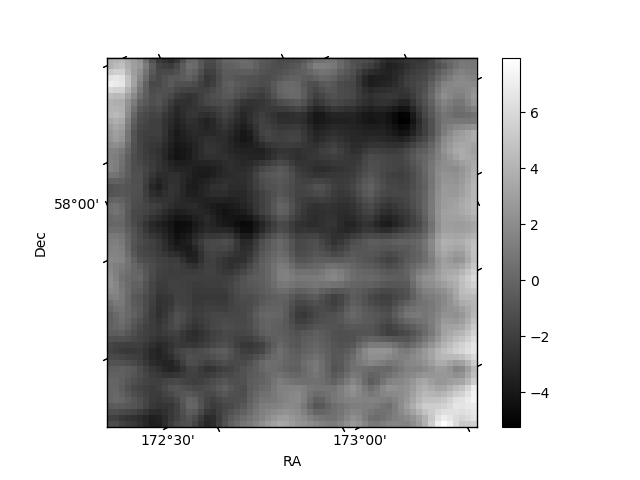
Histogram calculated using DETX and DETY for each event in the final _common_clean file
| Quadrant A | 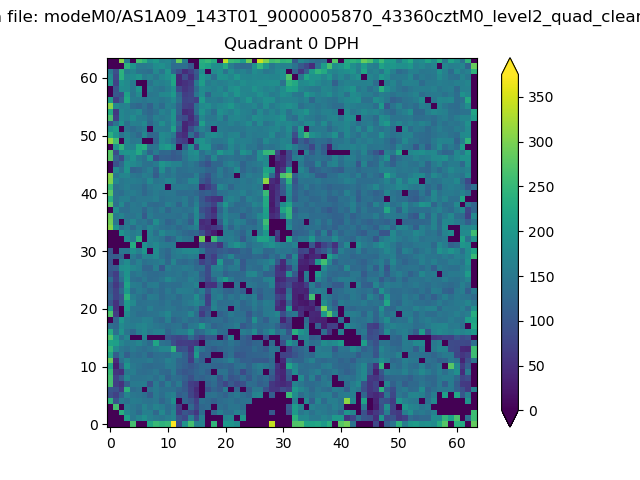 |
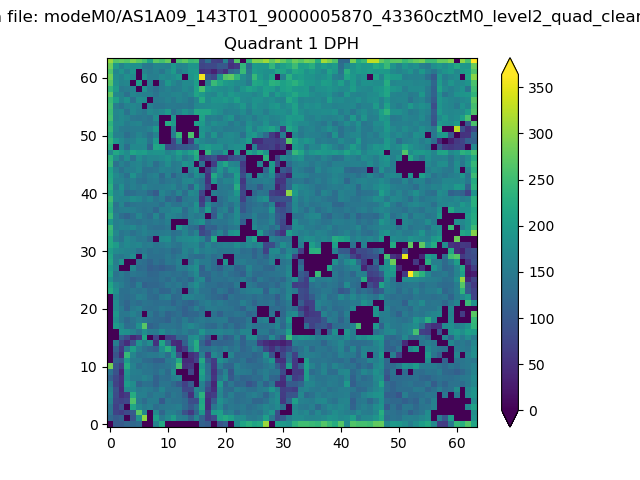 |
Quadrant B |
|---|---|---|---|
| Quadrant D | 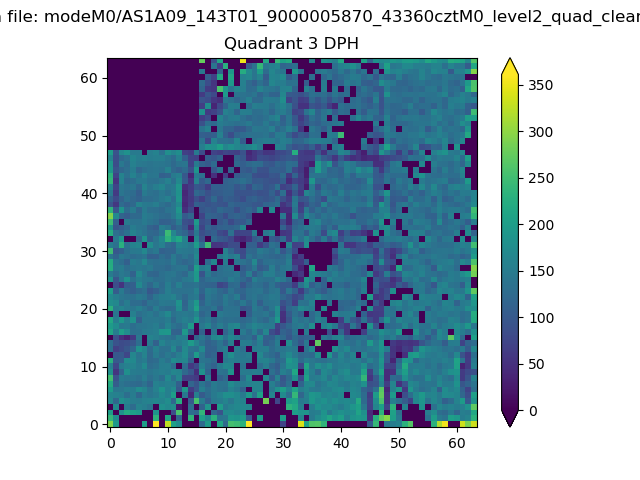 |
 |
Quadrant C |
| Plot type | Count rate plots | Images |
|---|---|---|
| Comparison with Poisson distribution Blue bars denote a histogram of data divided into 1 sec bins. Red curve is a Poisson curve with rate = median count rate of data. |
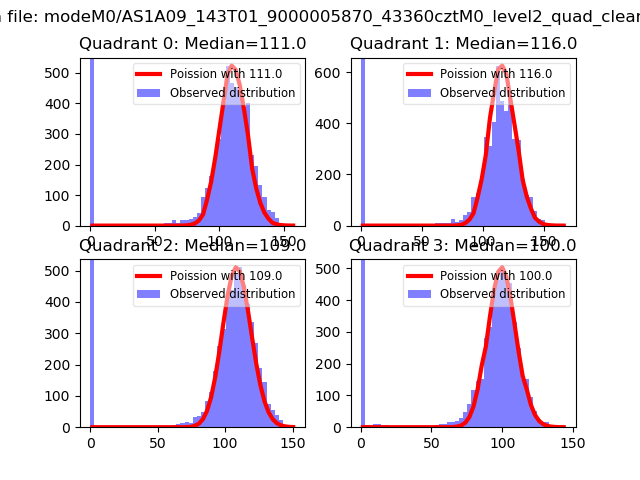 |
 |
| Quadrant-wise count rates Data is divided into 100 sec bins |
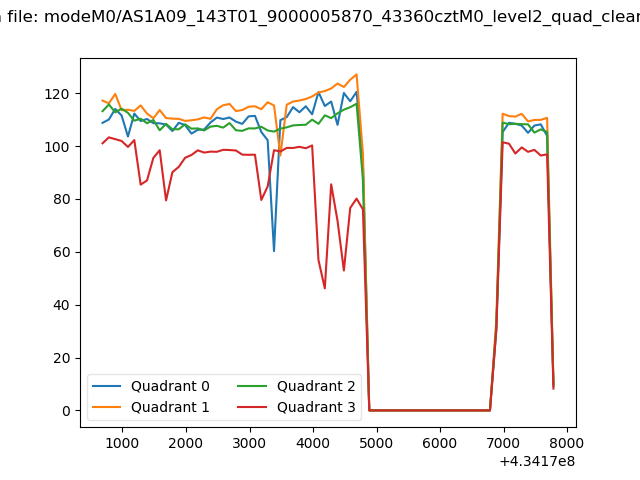 |
|
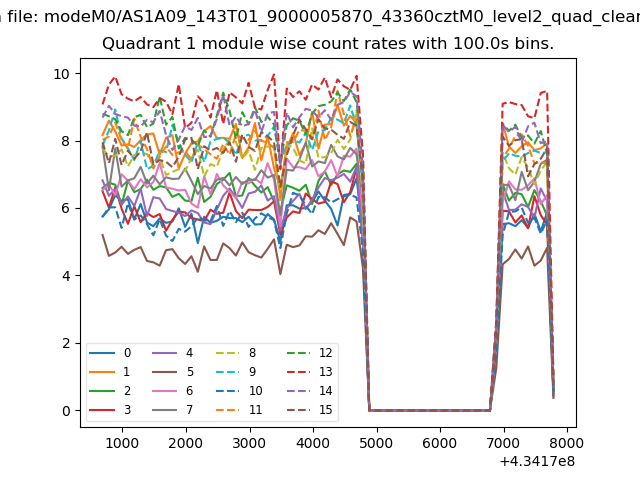
| Module-wise count rates for Quadrant A Data is divided into 100 sec bins |
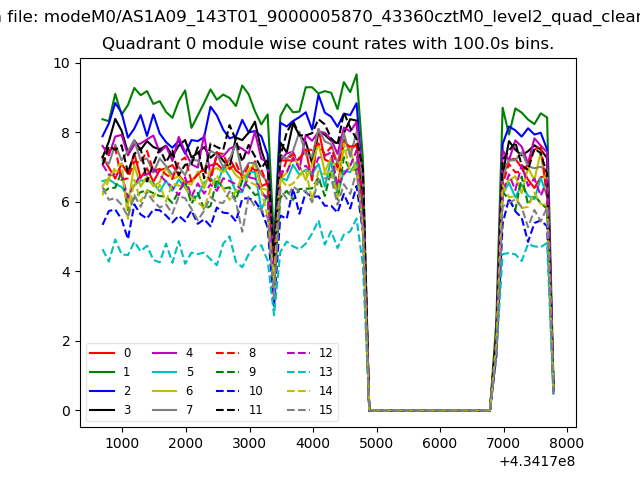 |
 |
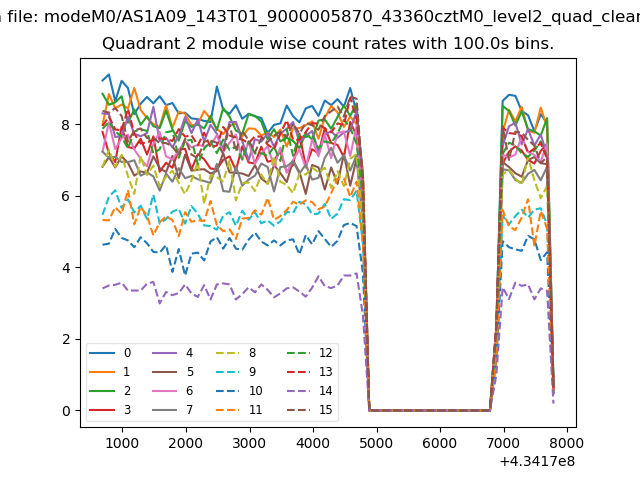
| Module-wise count rates for Quadrant B Data is divided into 100 sec bins |
 |
 |
| Module-wise count rates for Quadrant C Data is divided into 100 sec bins |
 |
 |
| Module-wise count rates for Quadrant D Data is divided into 100 sec bins |
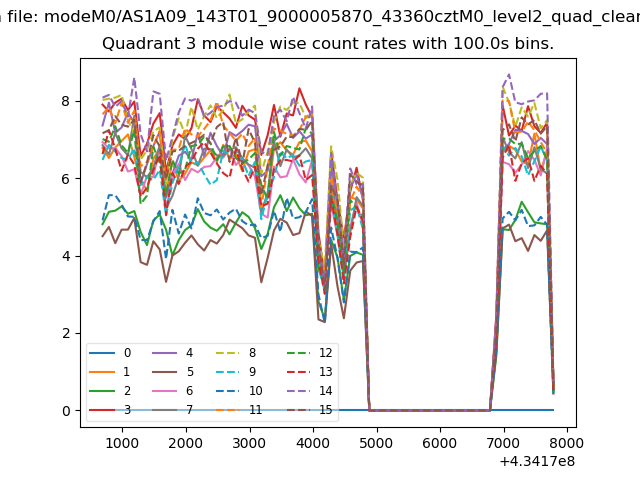 |
 |
| Parameter | Plot |
|---|---|
| CZT HV Monitor | 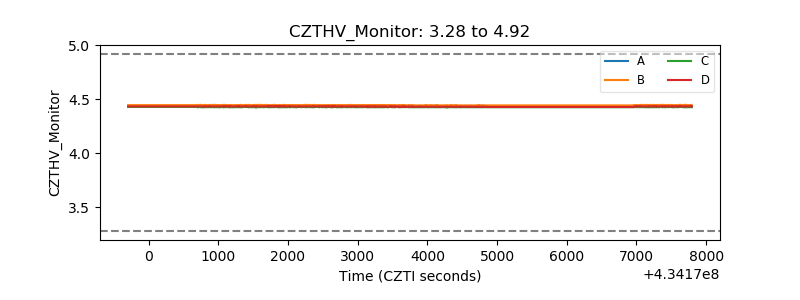 |
| D_VDD | 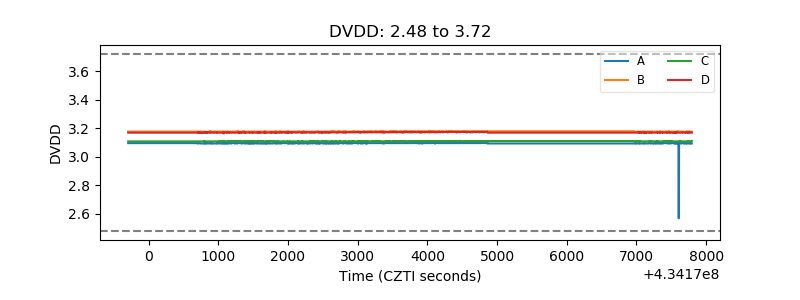 |
| Temperature 1 | 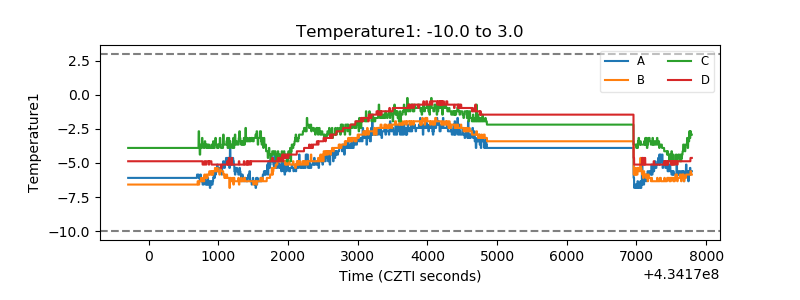 |
| Veto HV Monitor | 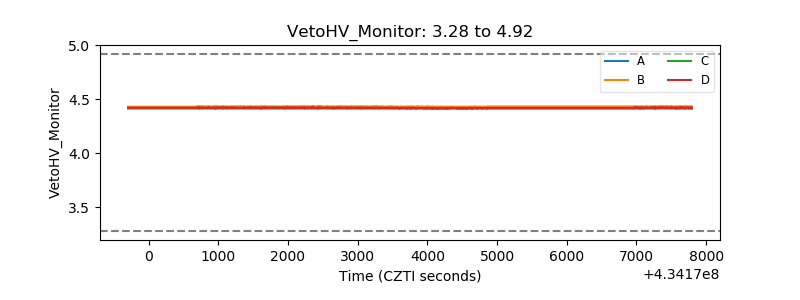 |
| Veto LLD | 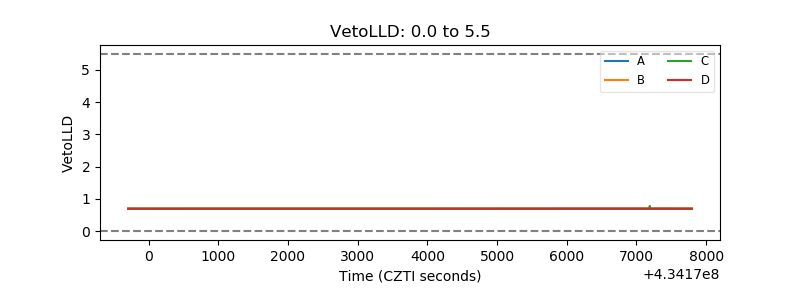 |
| Alpha Counter | 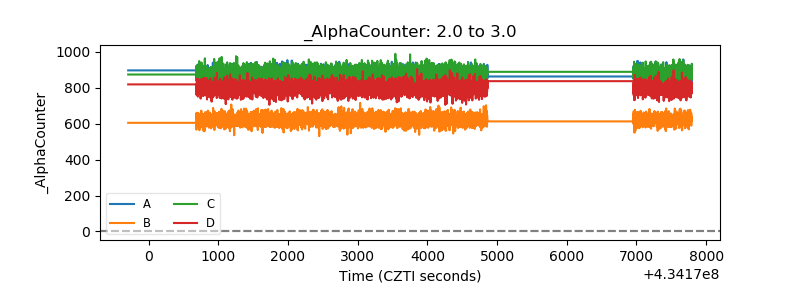 |
| _CPM_Rate | 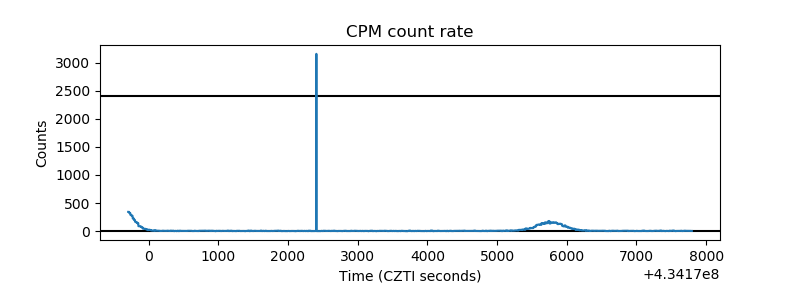 |
| CZT Counter | 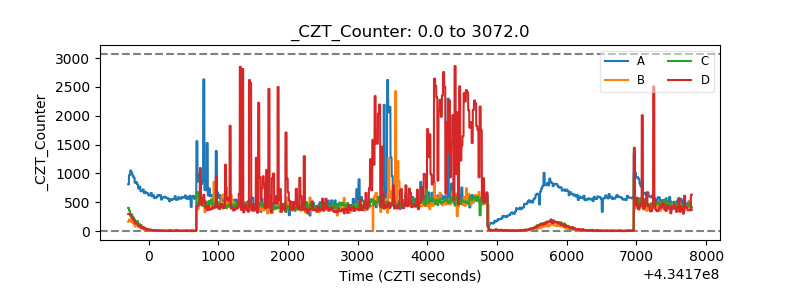 |
| +2.5 Volts monitor | 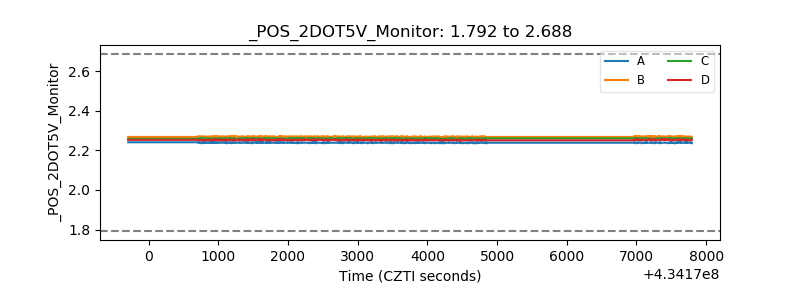 |
| +5 Volts monitor | 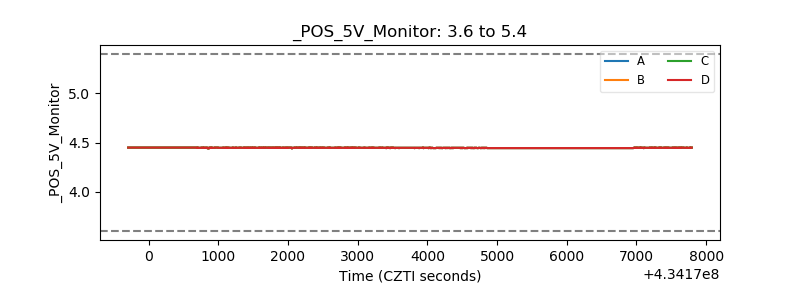 |
| _ROLL_ROT | 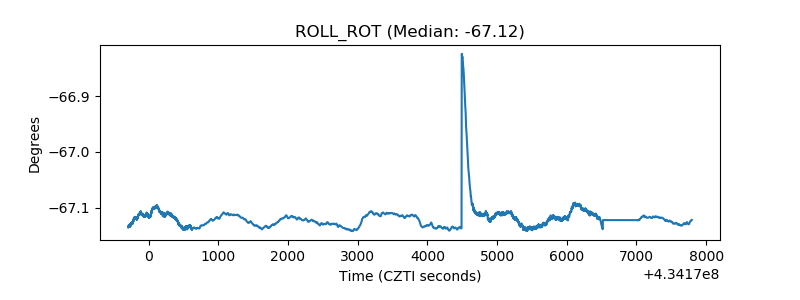 |
| _Roll_DEC | 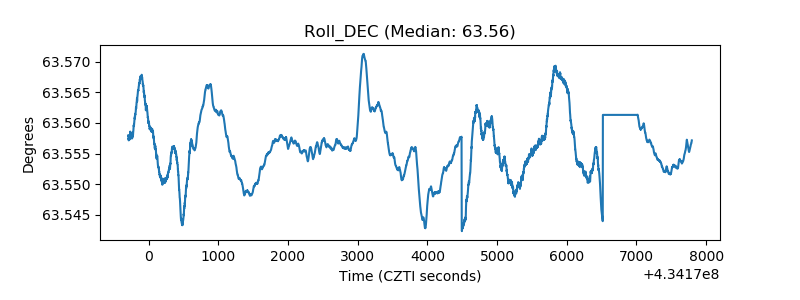 |
| _Roll_RA | 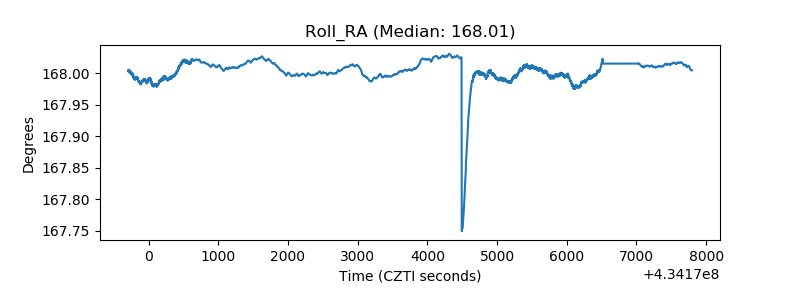 |
| Veto Counter | 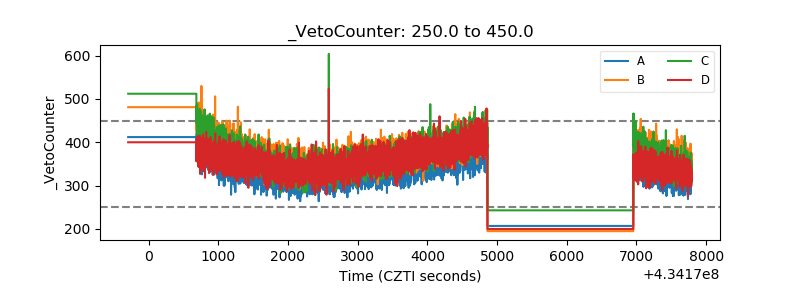 |