| Param | Original file | Final file |
|---|---|---|
| Filename | modeM0/AS1A09_143T01_9000005870_43361cztM0_level2.fits | modeM0/AS1A09_143T01_9000005870_43361cztM0_level2_quad_clean.evt |
| Size (bytes) | 316,160,640 | 83,986,560 |
| Size | 301.5 MB | 80.1 MB |
| Events in quadrant A | 3,079,768 | 561,578 |
| Events in quadrant B | 2,420,355 | 583,051 |
| Events in quadrant C | 2,403,626 | 552,872 |
| Events in quadrant D | 3,393,049 | 480,371 |
| Mode SS | |||
|---|---|---|---|
| Quadrant | BADHDUFLAG | Total packets | Discarded packets |
| A | 0 | 106 | 0 |
| B | 0 | 106 | 0 |
| C | 0 | 106 | 0 |
| D | 0 | 106 | 0 |
| Mode M9 | |||
|---|---|---|---|
| Quadrant | BADHDUFLAG | Total packets | Discarded packets |
| A | 0 | 19 | 0 |
| B | 0 | 19 | 0 |
| C | 0 | 19 | 0 |
| D | 0 | 19 | 0 |
| Mode M0 | |||
|---|---|---|---|
| Quadrant | BADHDUFLAG | Total packets | Discarded packets |
| A | 0 | 12281 | 1 |
| B | 0 | 10887 | 1 |
| C | 0 | 10514 | 1 |
| D | 0 | 14024 | 1 |
| Quadrant | Total seconds | Saturated seconds | Saturation percentage |
|---|---|---|---|
| A | 5213 | 82 | 1.572991% |
| B | 5213 | 15 | 0.287742% |
| C | 5214 | 2 | 0.038358% |
| D | 5214 | 322 | 6.175681% |
Noise dominated data is calculated using 1-second bins in cleaned event files. If a bin has >2000 counts, and if more than 50% of those come from <1% of pixels, then it is considered to be noise-dominated and hence unusable.
| Quadrant | # 1 sec bins | Bins with >0 counts | Bins with >2000 counts | High rate bins dominated by noise | Noise dominated (total time) | Noise dominated (detector-on time) | Marked lightcurve |
|---|---|---|---|---|---|---|---|
| A | 7097 | 5214 | 66 | 66 | 0.93% | 1.27% | 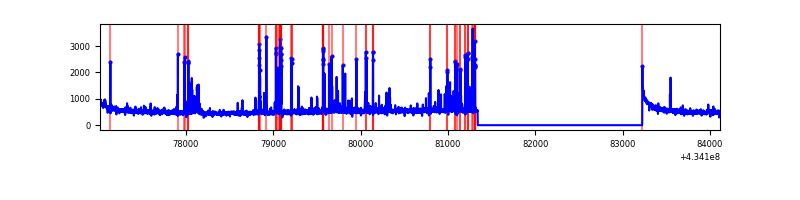 |
| B | 7097 | 5214 | 6 | 6 | 0.08% | 0.12% | 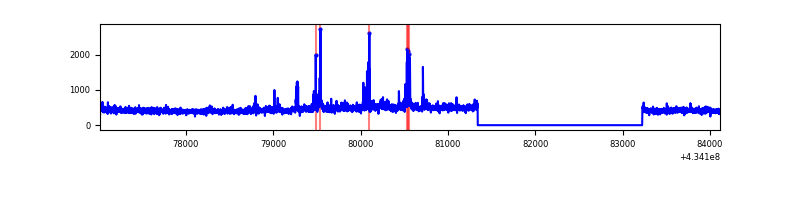 |
| C | 7098 | 5215 | 0 | 0 | 0.00% | 0.00% | 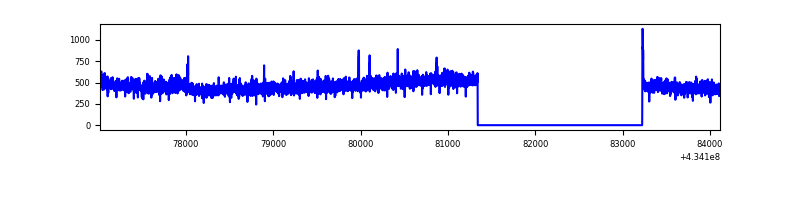 |
| D | 7098 | 5215 | 297 | 297 | 4.18% | 5.70% | 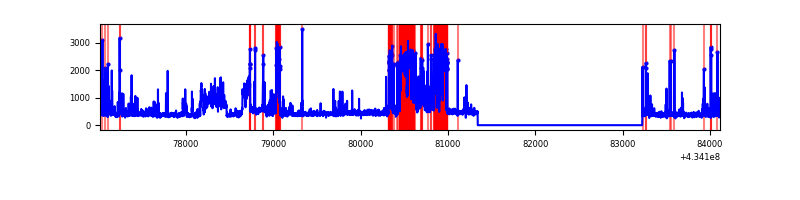 |
Top three noisy pixels from each quadrant. If the there are fewer than three noisy pixels in the level2.evt file, extra rows are filled as -1
| Pixel properties | Quadrant properties | ||||||
|---|---|---|---|---|---|---|---|
| Quadrant | DetID | PixID | Counts | Sigma | Mean | Median | Sigma |
| A | 10 | 83 | 539178 | 4806.74 | 552 | 542 | 112.1 |
| A | 15 | 237 | 233979 | 2083.17 | 552 | 542 | 112.1 |
| A | 13 | 248 | 146856 | 1305.69 | 552 | 542 | 112.1 |
| B | 0 | 189 | 129969 | 1218.77 | 549 | 531 | 106.2 |
| B | 15 | 85 | 40176 | 373.29 | 549 | 531 | 106.2 |
| B | 0 | 186 | 33469 | 310.14 | 549 | 531 | 106.2 |
| C | 15 | 214 | 215268 | 1713.67 | 537 | 539 | 125.3 |
| C | 3 | 233 | 79613 | 631.06 | 537 | 539 | 125.3 |
| C | 7 | 220 | 7329 | 54.19 | 537 | 539 | 125.3 |
| D | 10 | 118 | 772375 | 6099.06 | 518 | 502 | 126.6 |
| D | 13 | 249 | 345417 | 2725.4 | 518 | 502 | 126.6 |
| D | 7 | 96 | 96399 | 757.74 | 518 | 502 | 126.6 |
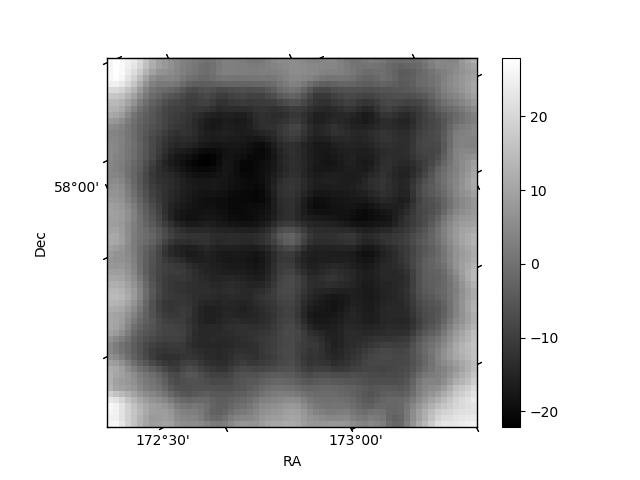
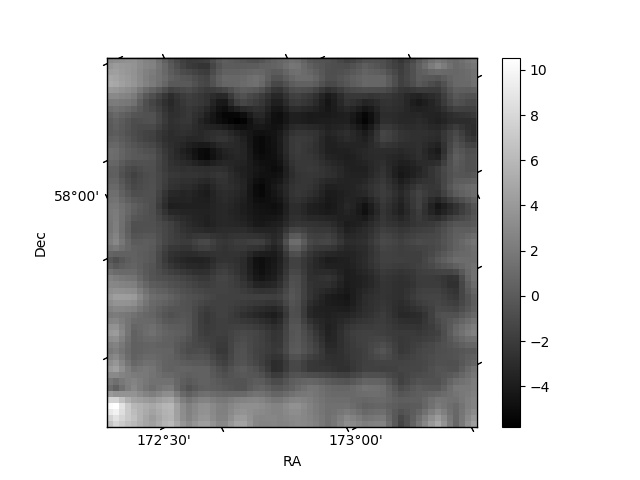
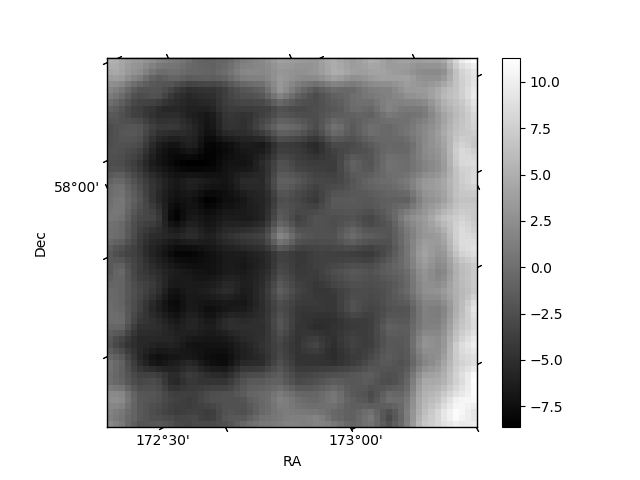
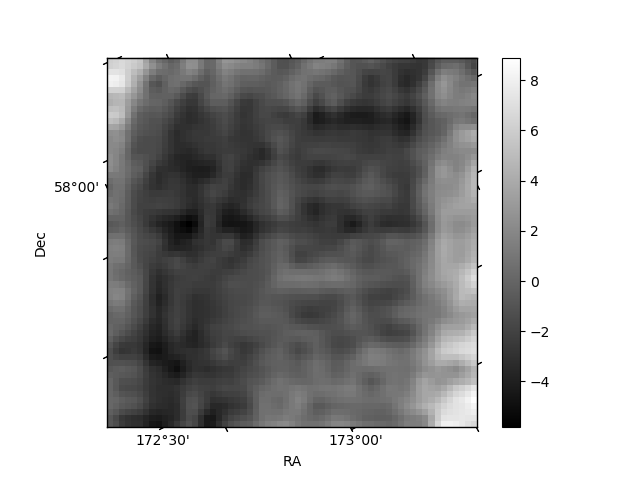
Histogram calculated using DETX and DETY for each event in the final _common_clean file
| Quadrant A | 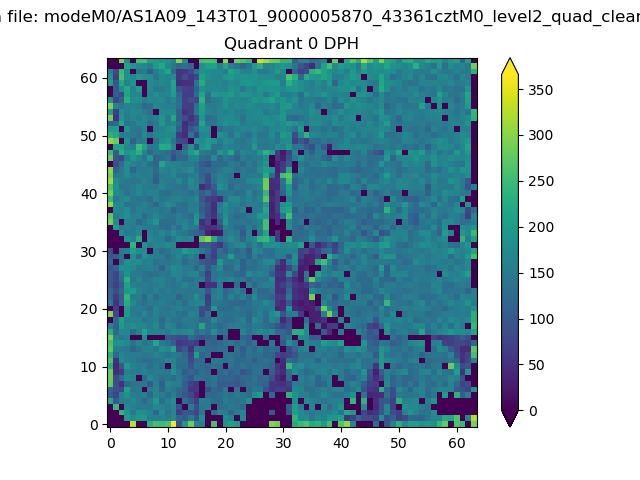 |
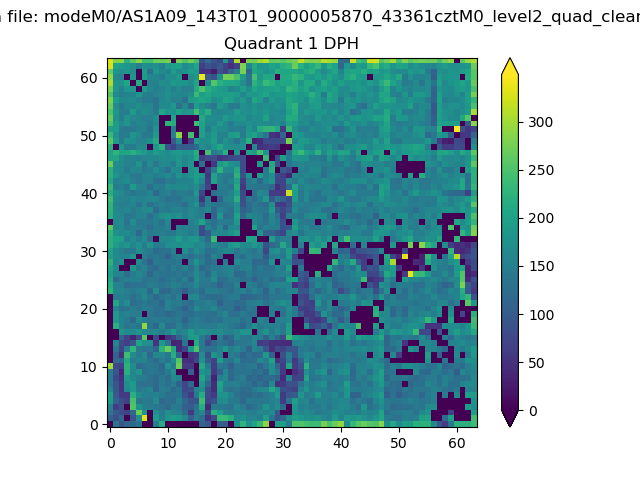 |
Quadrant B |
|---|---|---|---|
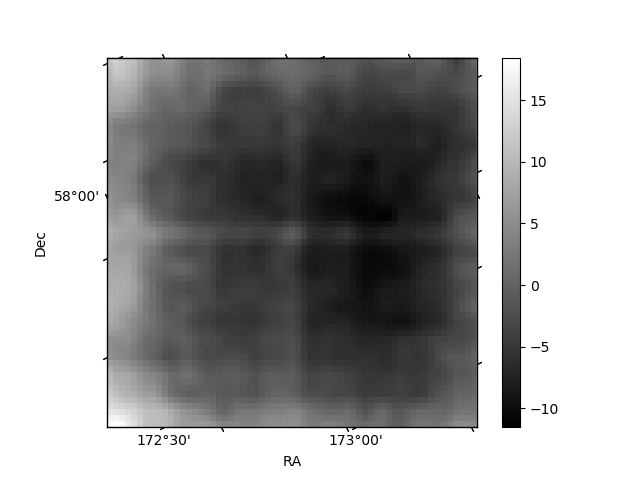
| Quadrant D | 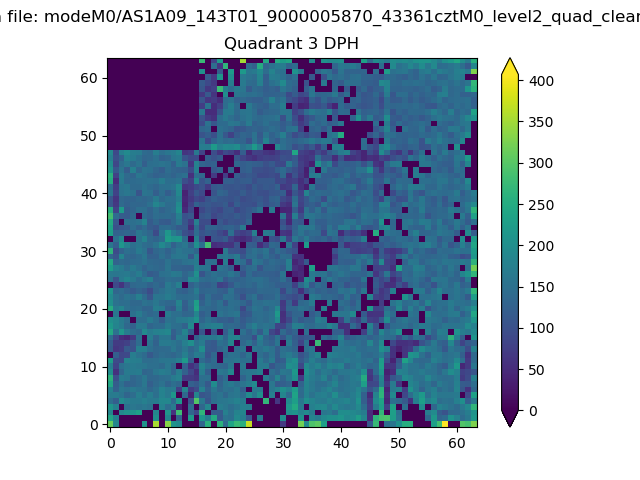 |
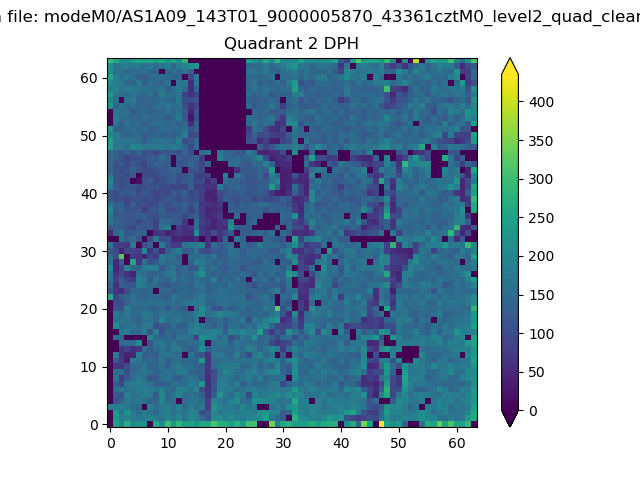 |
Quadrant C |
| Plot type | Count rate plots | Images |
|---|---|---|
| Comparison with Poisson distribution Blue bars denote a histogram of data divided into 1 sec bins. Red curve is a Poisson curve with rate = median count rate of data. |
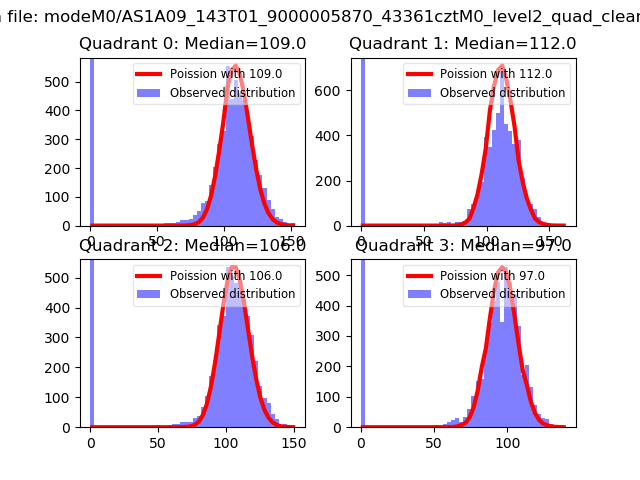 |
 |
| Quadrant-wise count rates Data is divided into 100 sec bins |
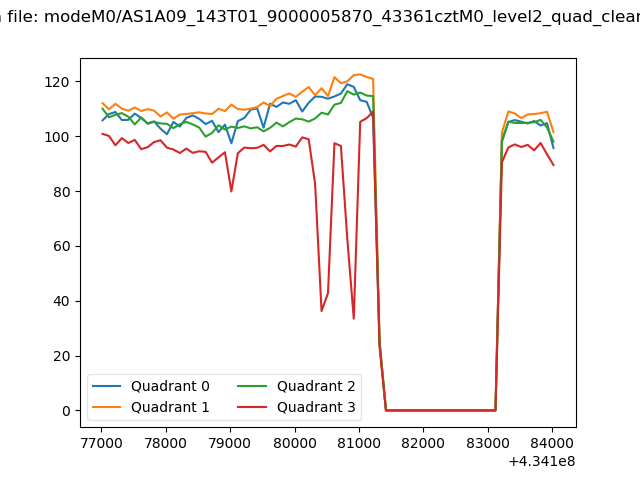 |
|
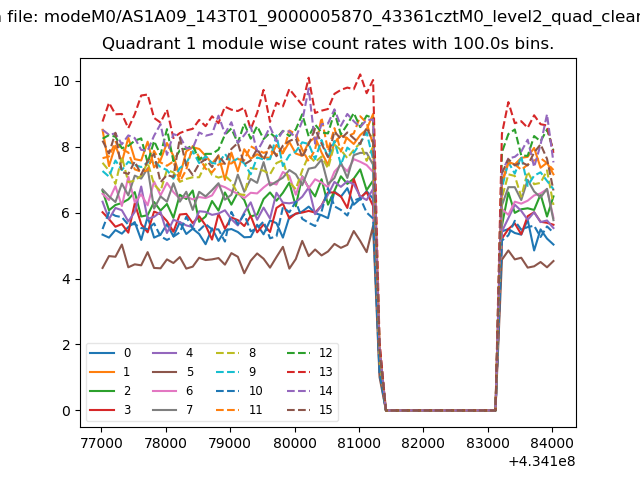
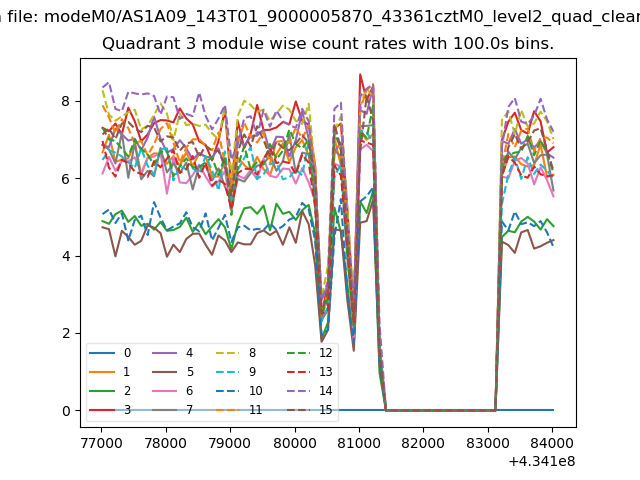
| Module-wise count rates for Quadrant A Data is divided into 100 sec bins |
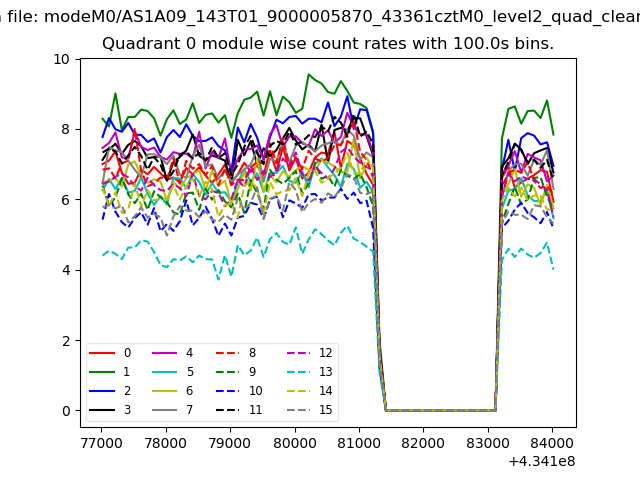 |
 |
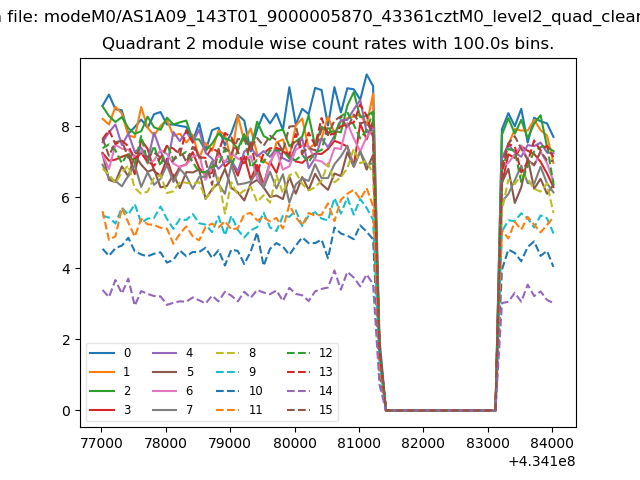
| Module-wise count rates for Quadrant B Data is divided into 100 sec bins |
 |
 |
| Module-wise count rates for Quadrant C Data is divided into 100 sec bins |
 |
 |
| Module-wise count rates for Quadrant D Data is divided into 100 sec bins |
 |
 |
| Parameter | Plot |
|---|---|
| CZT HV Monitor | 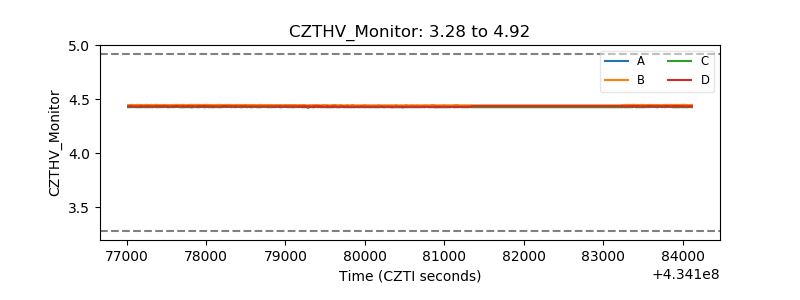 |
| D_VDD | 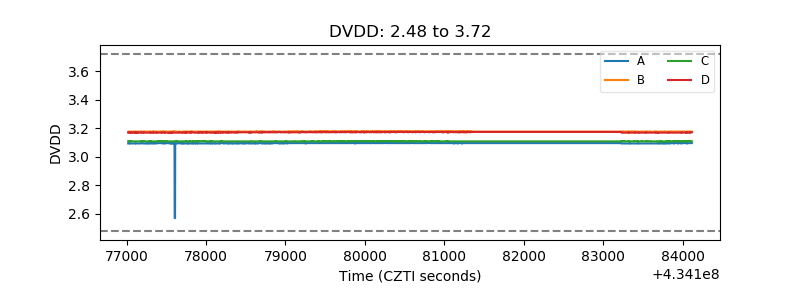 |
| Temperature 1 | 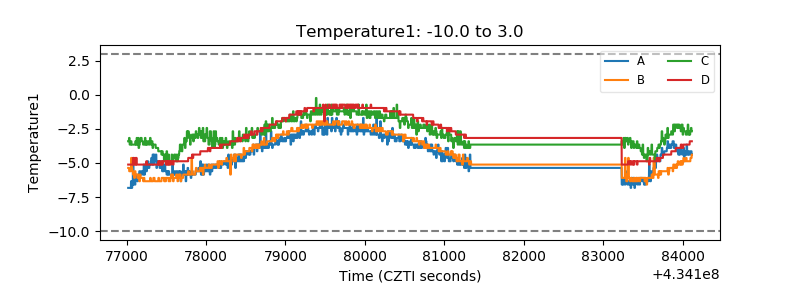 |
| Veto HV Monitor | 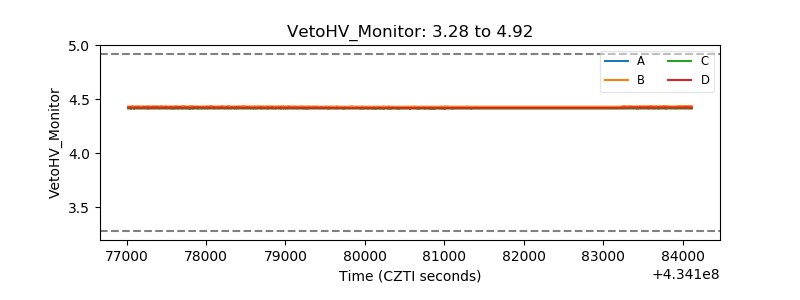 |
| Veto LLD | 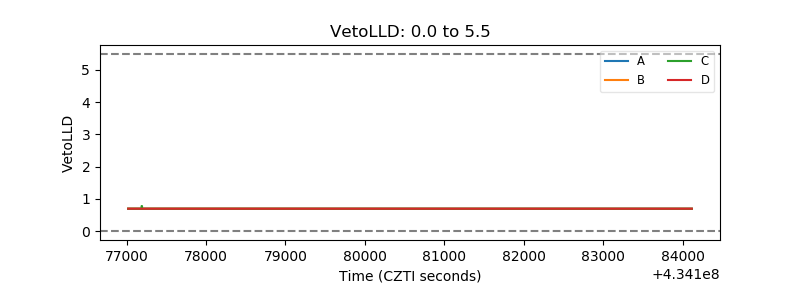 |
| Alpha Counter | 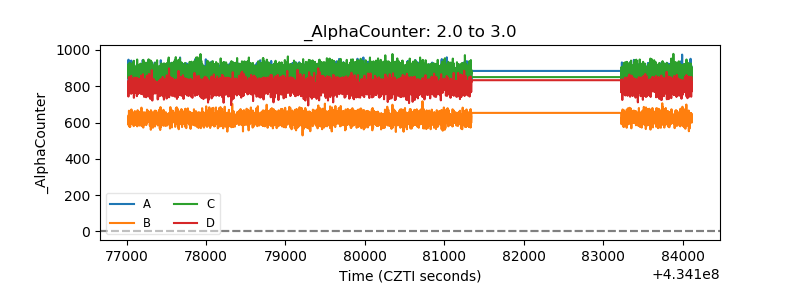 |
| _CPM_Rate | 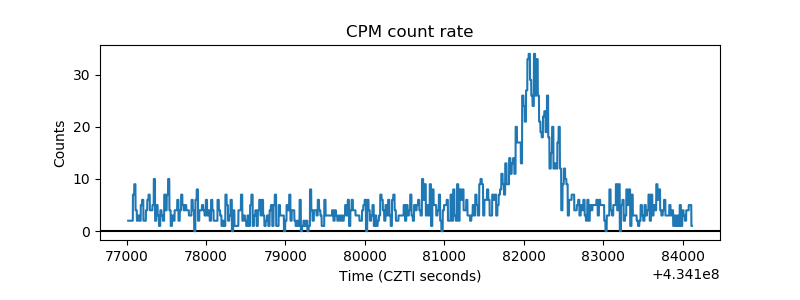 |
| CZT Counter | 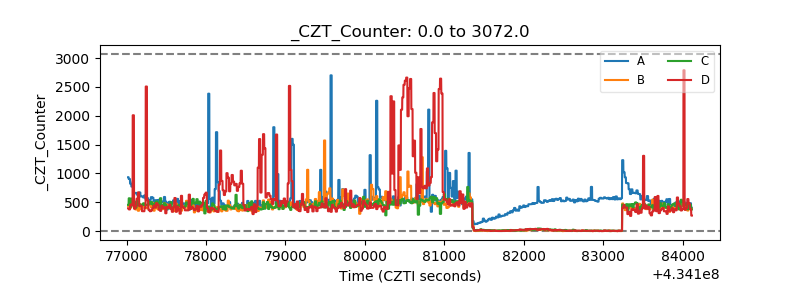 |
| +2.5 Volts monitor | 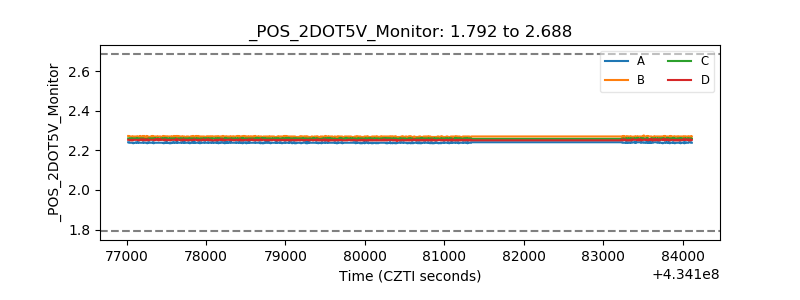 |
| +5 Volts monitor | 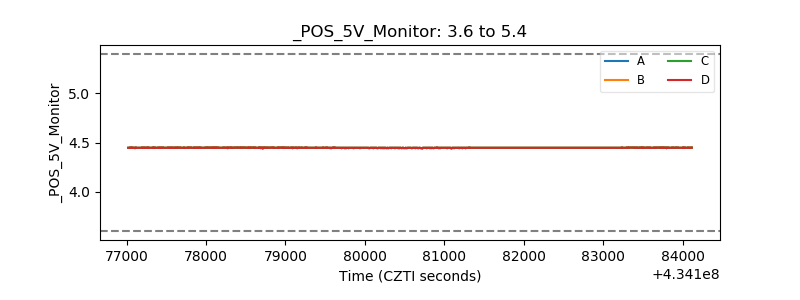 |
| _ROLL_ROT | 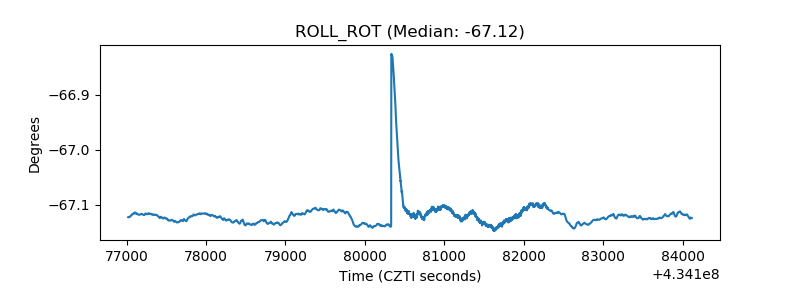 |
| _Roll_DEC |  |
| _Roll_RA | 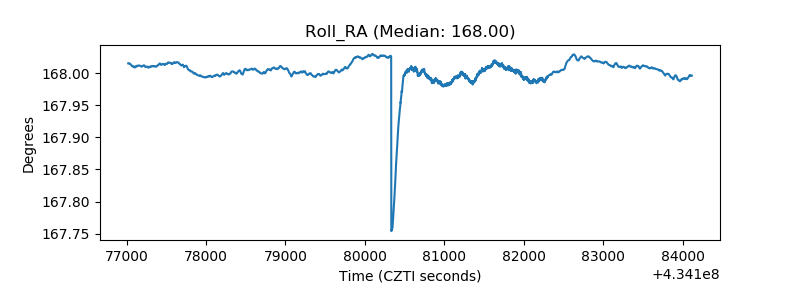 |
| Veto Counter | 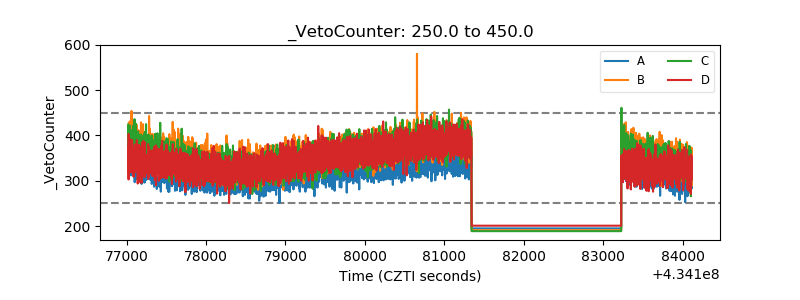 |