| Param | Original file | Final file |
|---|---|---|
| Filename | modeM0/AS1A09_143T01_9000005870_43362cztM0_level2.fits | modeM0/AS1A09_143T01_9000005870_43362cztM0_level2_quad_clean.evt |
| Size (bytes) | 337,147,200 | 89,328,960 |
| Size | 321.5 MB | 85.2 MB |
| Events in quadrant A | 3,205,486 | 602,794 |
| Events in quadrant B | 2,691,571 | 619,904 |
| Events in quadrant C | 2,583,963 | 588,026 |
| Events in quadrant D | 3,564,849 | 504,240 |
| Mode SS | |||
|---|---|---|---|
| Quadrant | BADHDUFLAG | Total packets | Discarded packets |
| A | 0 | 114 | 0 |
| B | 0 | 114 | 0 |
| C | 0 | 114 | 0 |
| D | 0 | 114 | 0 |
| Mode M9 | |||
|---|---|---|---|
| Quadrant | BADHDUFLAG | Total packets | Discarded packets |
| A | 0 | 18 | 0 |
| B | 0 | 19 | 0 |
| C | 0 | 19 | 0 |
| D | 0 | 19 | 0 |
| Mode M0 | |||
|---|---|---|---|
| Quadrant | BADHDUFLAG | Total packets | Discarded packets |
| A | 0 | 12772 | 2 |
| B | 0 | 11931 | 2 |
| C | 0 | 11285 | 2 |
| D | 0 | 14818 | 2 |
| Quadrant | Total seconds | Saturated seconds | Saturation percentage |
|---|---|---|---|
| A | 5570 | 64 | 1.149013% |
| B | 5570 | 20 | 0.359066% |
| C | 5570 | 4 | 0.071813% |
| D | 5570 | 444 | 7.971275% |
Noise dominated data is calculated using 1-second bins in cleaned event files. If a bin has >2000 counts, and if more than 50% of those come from <1% of pixels, then it is considered to be noise-dominated and hence unusable.
| Quadrant | # 1 sec bins | Bins with >0 counts | Bins with >2000 counts | High rate bins dominated by noise | Noise dominated (total time) | Noise dominated (detector-on time) | Marked lightcurve |
|---|---|---|---|---|---|---|---|
| A | 7092 | 5571 | 41 | 41 | 0.58% | 0.74% | 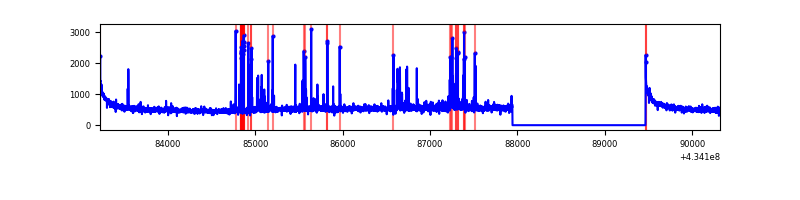 |
| B | 7092 | 5571 | 10 | 10 | 0.14% | 0.18% | 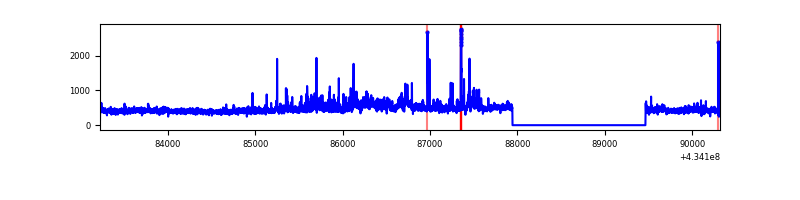 |
| C | 7092 | 5571 | 1 | 1 | 0.01% | 0.02% | 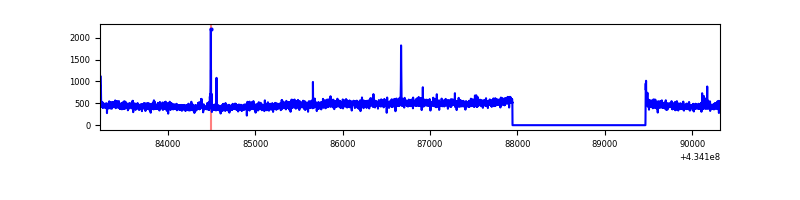 |
| D | 7092 | 5571 | 326 | 326 | 4.60% | 5.85% | 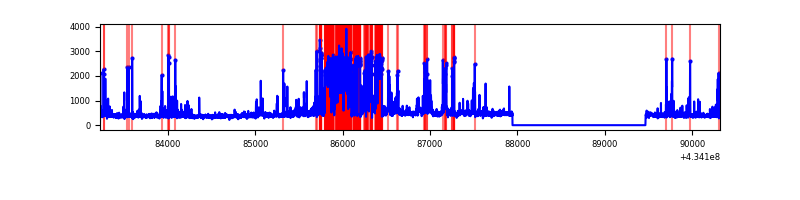 |
Top three noisy pixels from each quadrant. If the there are fewer than three noisy pixels in the level2.evt file, extra rows are filled as -1
| Pixel properties | Quadrant properties | ||||||
|---|---|---|---|---|---|---|---|
| Quadrant | DetID | PixID | Counts | Sigma | Mean | Median | Sigma |
| A | 10 | 83 | 623266 | 5045.05 | 596 | 583 | 123.4 |
| A | 15 | 237 | 197440 | 1594.96 | 596 | 583 | 123.4 |
| A | 13 | 248 | 61479 | 493.39 | 596 | 583 | 123.4 |
| B | 0 | 189 | 214803 | 1858.03 | 591 | 575 | 115.3 |
| B | 0 | 190 | 58498 | 502.37 | 591 | 575 | 115.3 |
| B | 5 | 172 | 35499 | 302.9 | 591 | 575 | 115.3 |
| C | 15 | 214 | 231846 | 1706.17 | 579 | 581 | 135.5 |
| C | 3 | 233 | 62163 | 454.32 | 579 | 581 | 135.5 |
| C | 15 | 111 | 22484 | 161.59 | 579 | 581 | 135.5 |
| D | 1 | 52 | 1071060 | 7959.16 | 547 | 529 | 134.5 |
| D | 12 | 218 | 102879 | 760.95 | 547 | 529 | 134.5 |
| D | 2 | 249 | 82369 | 608.46 | 547 | 529 | 134.5 |
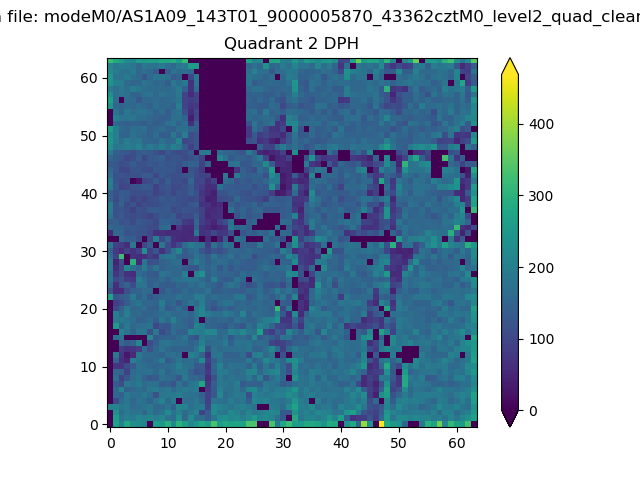
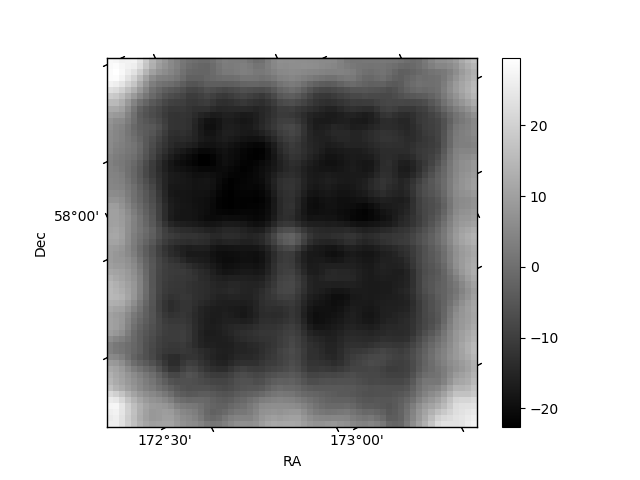
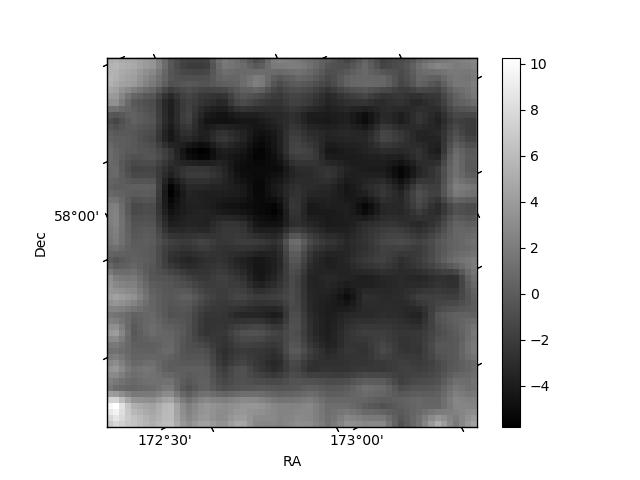
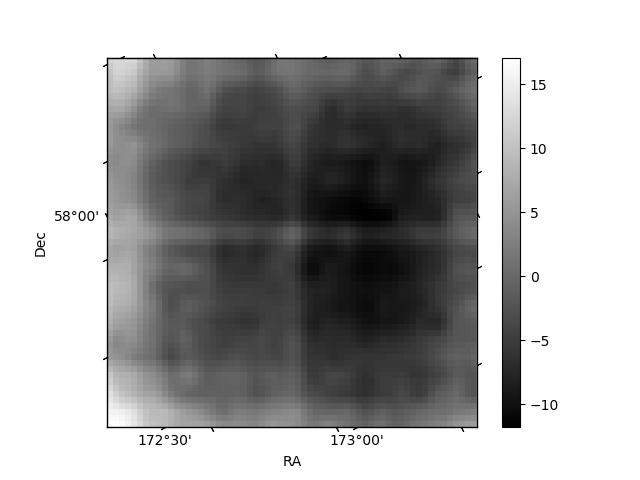
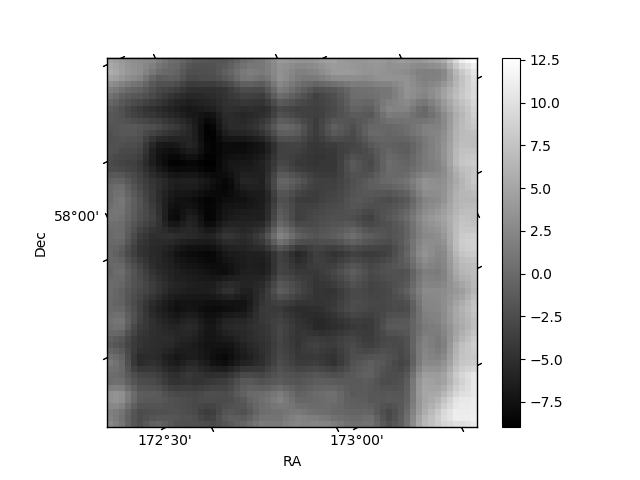
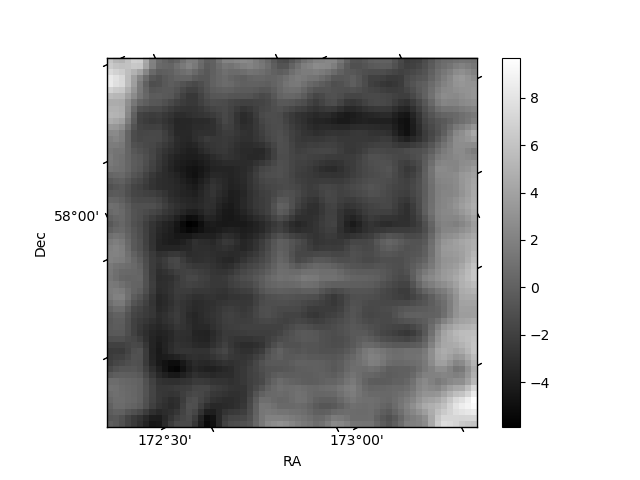
Histogram calculated using DETX and DETY for each event in the final _common_clean file
| Quadrant A | 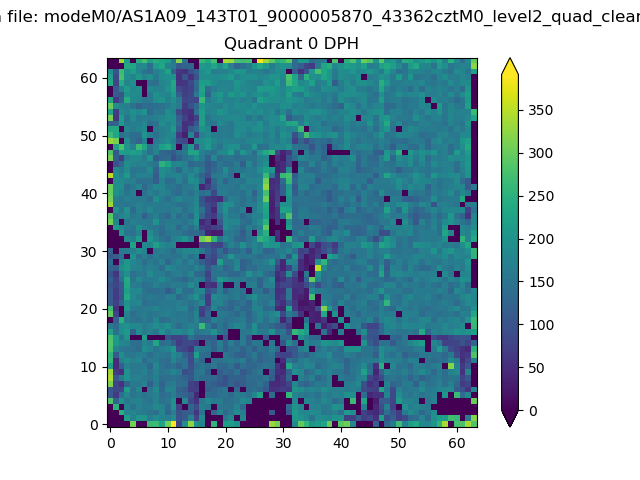 |
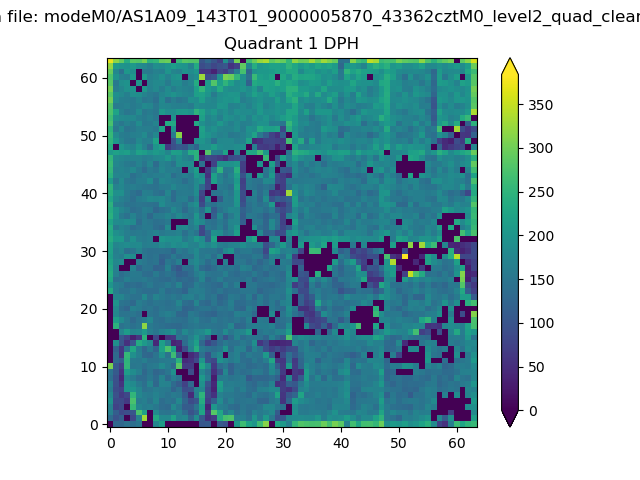 |
Quadrant B |
|---|---|---|---|
| Quadrant D | 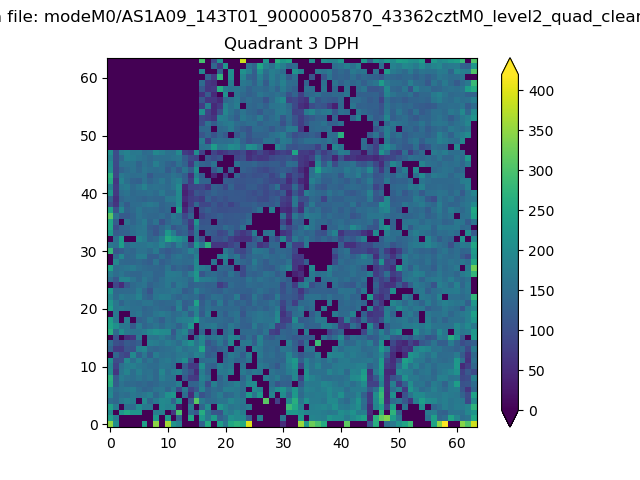 |
 |
Quadrant C |
| Plot type | Count rate plots | Images |
|---|---|---|
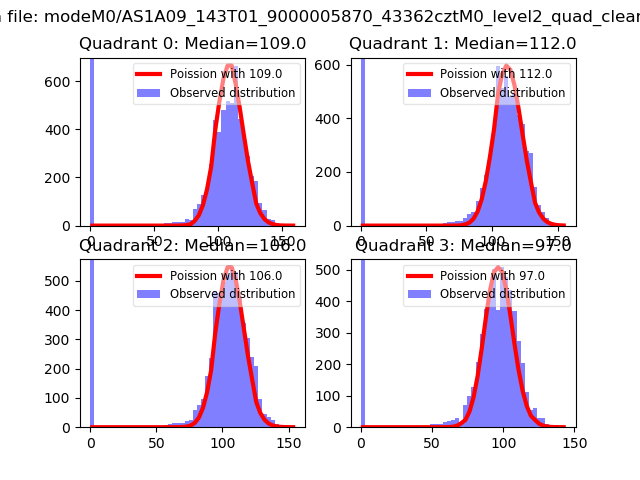
| Comparison with Poisson distribution Blue bars denote a histogram of data divided into 1 sec bins. Red curve is a Poisson curve with rate = median count rate of data. |
 |
 |
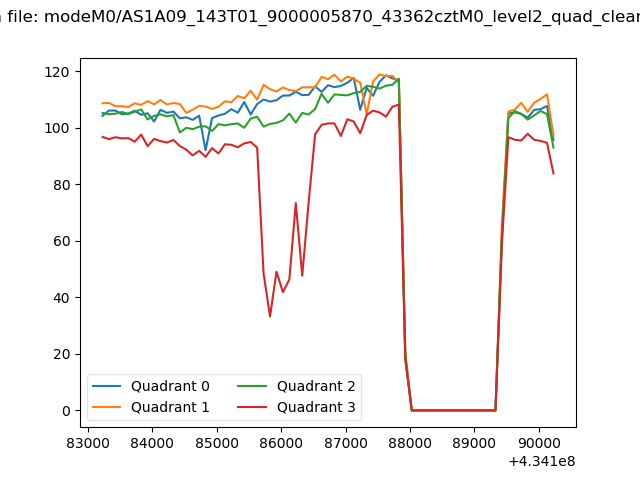
| Quadrant-wise count rates Data is divided into 100 sec bins |
 |
|
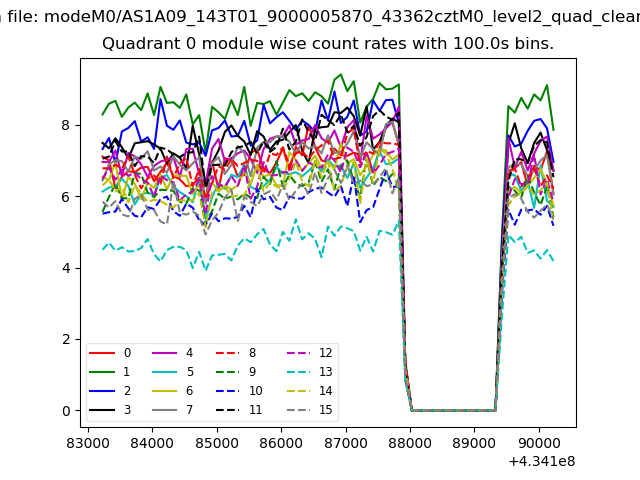
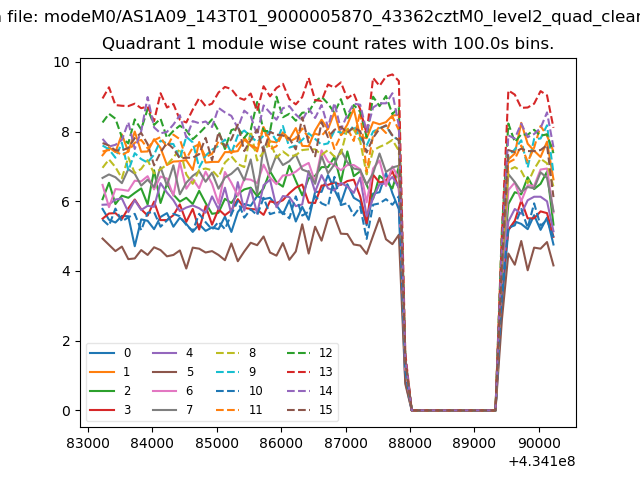
| Module-wise count rates for Quadrant A Data is divided into 100 sec bins |
 |
 |
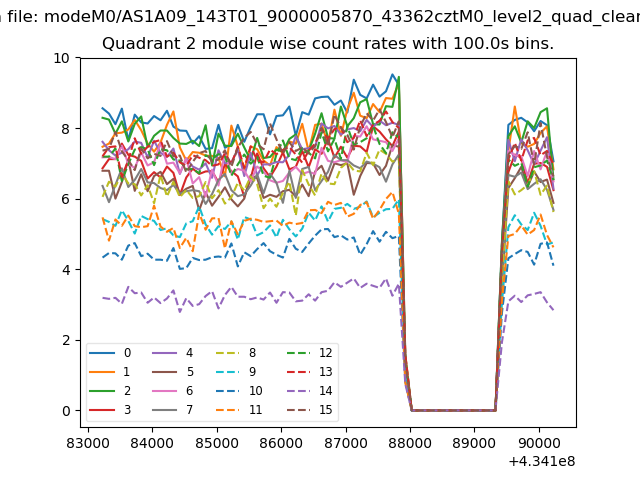
| Module-wise count rates for Quadrant B Data is divided into 100 sec bins |
 |
 |
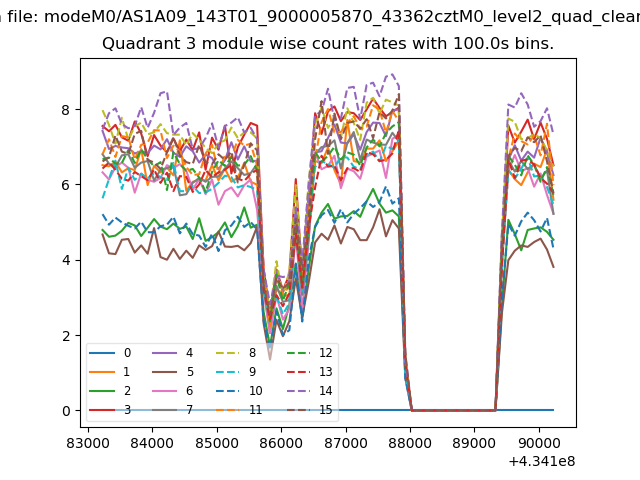
| Module-wise count rates for Quadrant C Data is divided into 100 sec bins |
 |
 |
| Module-wise count rates for Quadrant D Data is divided into 100 sec bins |
 |
 |
| Parameter | Plot |
|---|---|
| CZT HV Monitor | 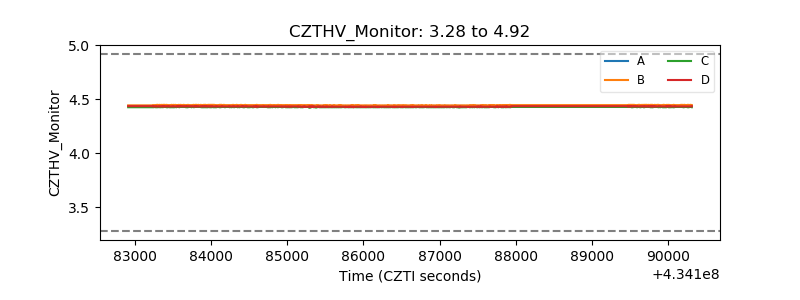 |
| D_VDD | 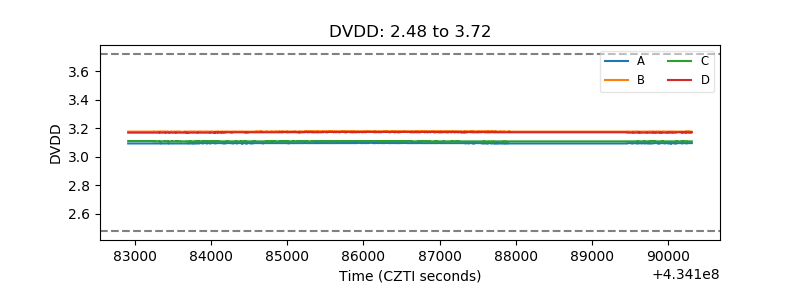 |
| Temperature 1 | 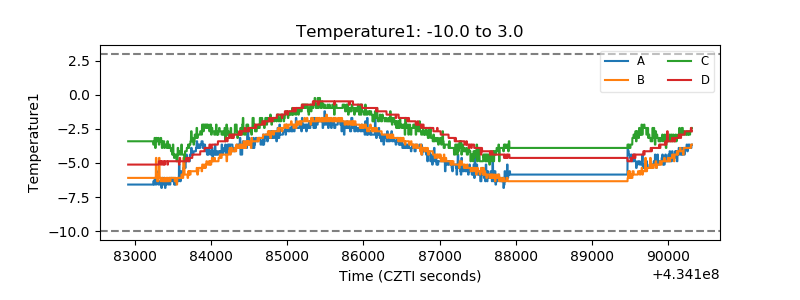 |
| Veto HV Monitor | 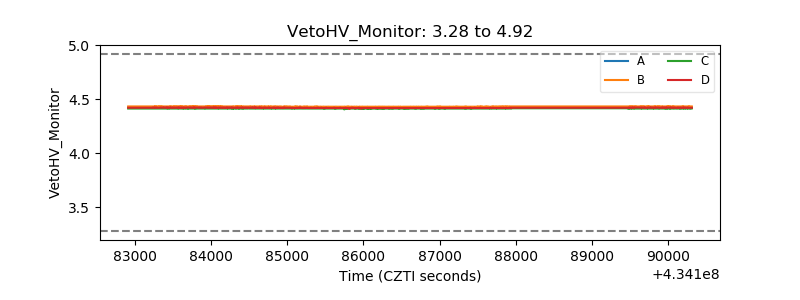 |
| Veto LLD | 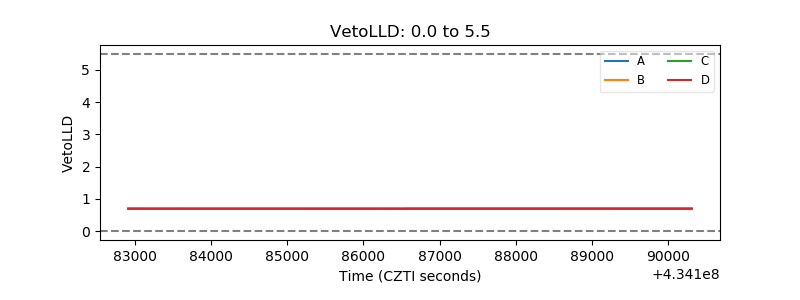 |
| Alpha Counter | 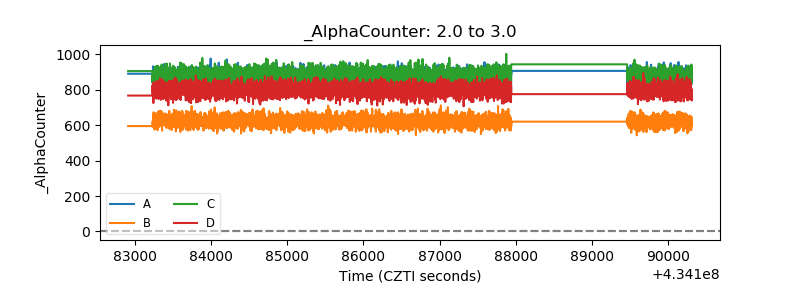 |
| _CPM_Rate | 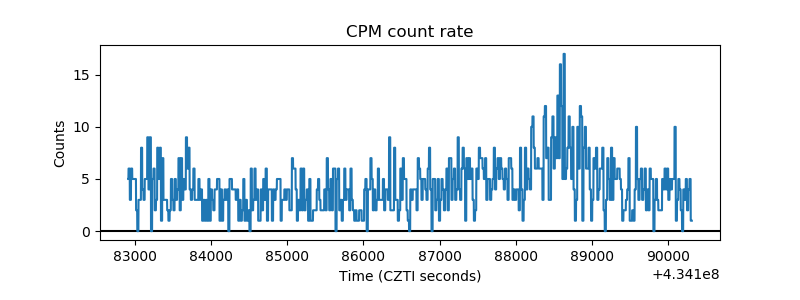 |
| CZT Counter | 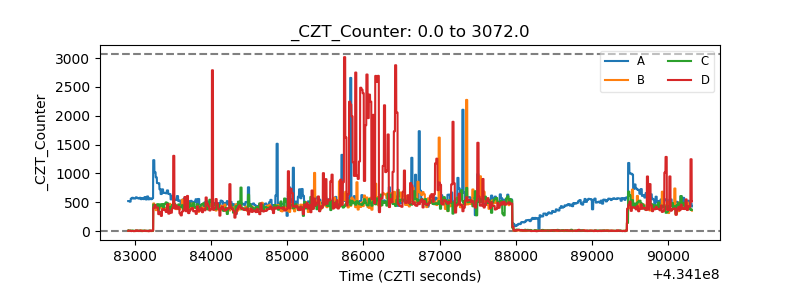 |
| +2.5 Volts monitor | 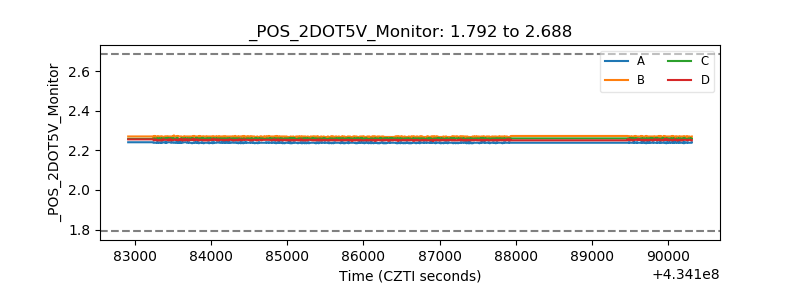 |
| +5 Volts monitor | 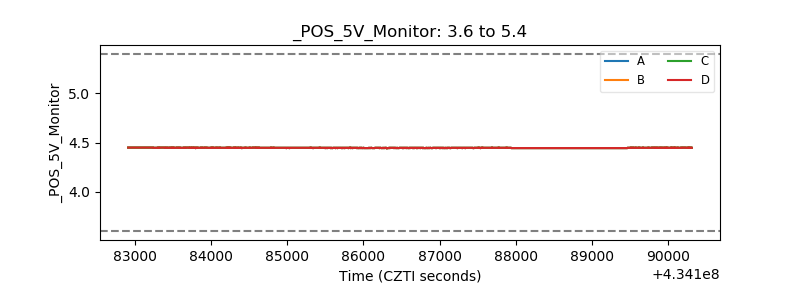 |
| _ROLL_ROT |  |
| _Roll_DEC | 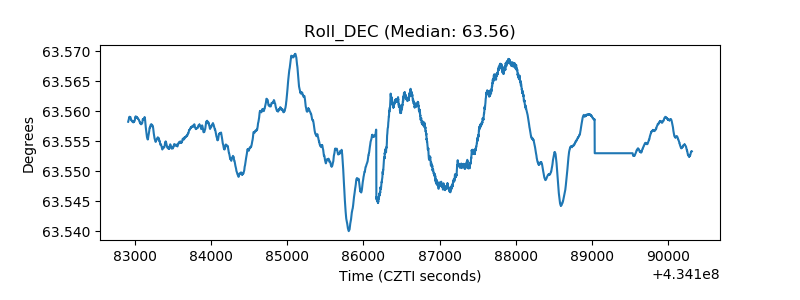 |
| _Roll_RA | 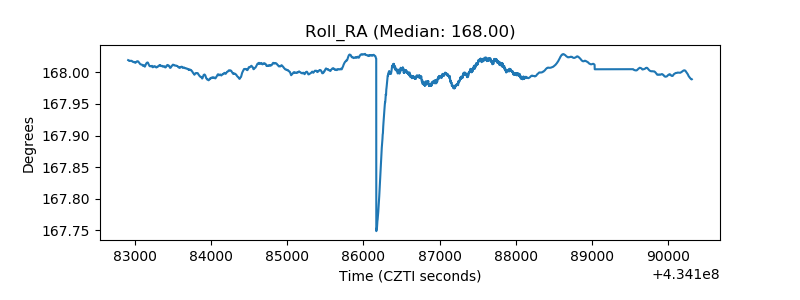 |
| Veto Counter | 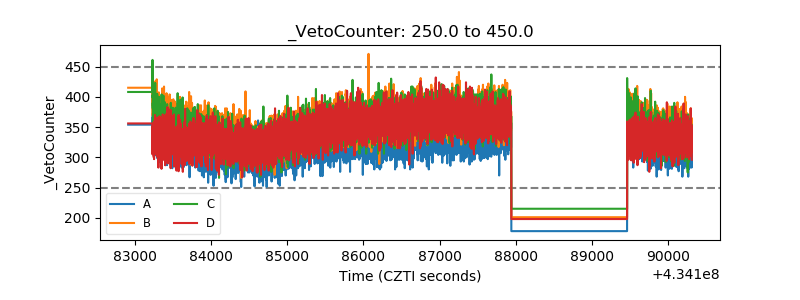 |