| Param | Original file | Final file |
|---|---|---|
| Filename | modeM0/AS1A09_143T01_9000005870_43364cztM0_level2.fits | modeM0/AS1A09_143T01_9000005870_43364cztM0_level2_quad_clean.evt |
| Size (bytes) | 367,384,320 | 95,832,000 |
| Size | 350.4 MB | 91.4 MB |
| Events in quadrant A | 3,533,151 | 635,115 |
| Events in quadrant B | 3,186,104 | 655,929 |
| Events in quadrant C | 3,337,557 | 622,309 |
| Events in quadrant D | 3,077,559 | 570,613 |
| Mode SS | |||
|---|---|---|---|
| Quadrant | BADHDUFLAG | Total packets | Discarded packets |
| A | 0 | 122 | 0 |
| B | 0 | 122 | 0 |
| C | 0 | 122 | 0 |
| D | 0 | 122 | 0 |
| Mode M9 | |||
|---|---|---|---|
| Quadrant | BADHDUFLAG | Total packets | Discarded packets |
| A | 0 | 17 | 0 |
| B | 0 | 18 | 0 |
| C | 0 | 18 | 0 |
| D | 0 | 18 | 0 |
| Mode M0 | |||
|---|---|---|---|
| Quadrant | BADHDUFLAG | Total packets | Discarded packets |
| A | 0 | 13885 | 2 |
| B | 0 | 13357 | 2 |
| C | 0 | 13506 | 2 |
| D | 0 | 13528 | 2 |
| Quadrant | Total seconds | Saturated seconds | Saturation percentage |
|---|---|---|---|
| A | 5976 | 99 | 1.656627% |
| B | 5976 | 71 | 1.188086% |
| C | 5976 | 14 | 0.234270% |
| D | 5976 | 60 | 1.004016% |
Noise dominated data is calculated using 1-second bins in cleaned event files. If a bin has >2000 counts, and if more than 50% of those come from <1% of pixels, then it is considered to be noise-dominated and hence unusable.
| Quadrant | # 1 sec bins | Bins with >0 counts | Bins with >2000 counts | High rate bins dominated by noise | Noise dominated (total time) | Noise dominated (detector-on time) | Marked lightcurve |
|---|---|---|---|---|---|---|---|
| A | 7288 | 5977 | 65 | 65 | 0.89% | 1.09% | 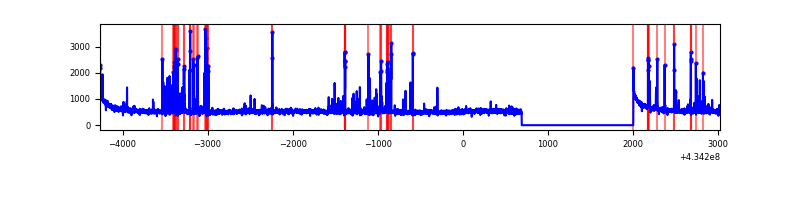 |
| B | 7288 | 5977 | 45 | 45 | 0.62% | 0.75% | 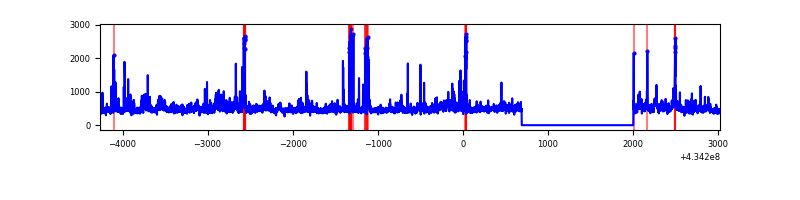 |
| C | 7288 | 5977 | 8 | 8 | 0.11% | 0.13% | 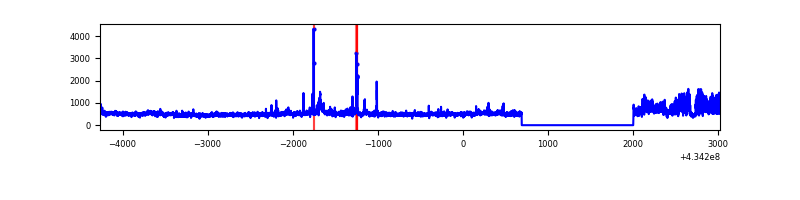 |
| D | 7288 | 5977 | 58 | 58 | 0.80% | 0.97% | 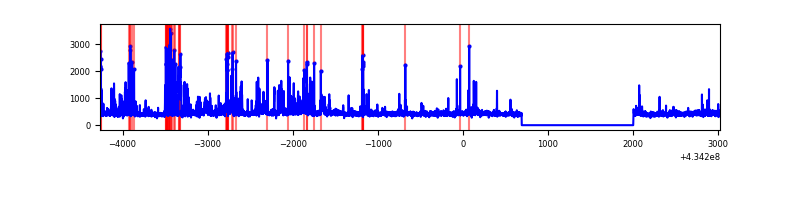 |
Top three noisy pixels from each quadrant. If the there are fewer than three noisy pixels in the level2.evt file, extra rows are filled as -1
| Pixel properties | Quadrant properties | ||||||
|---|---|---|---|---|---|---|---|
| Quadrant | DetID | PixID | Counts | Sigma | Mean | Median | Sigma |
| A | 10 | 83 | 652816 | 4840.53 | 646 | 631 | 134.7 |
| A | 15 | 237 | 340920 | 2525.63 | 646 | 631 | 134.7 |
| A | 13 | 6 | 20049 | 144.12 | 646 | 631 | 134.7 |
| B | 0 | 189 | 400094 | 3211.66 | 640 | 622 | 124.4 |
| B | 5 | 172 | 178401 | 1429.3 | 640 | 622 | 124.4 |
| B | 0 | 245 | 26774 | 210.26 | 640 | 622 | 124.4 |
| C | 8 | 229 | 308502 | 2099.9 | 628 | 631 | 146.6 |
| C | 15 | 214 | 248708 | 1692.06 | 628 | 631 | 146.6 |
| C | 3 | 233 | 232848 | 1583.88 | 628 | 631 | 146.6 |
| D | 12 | 218 | 249794 | 1610.5 | 630 | 611 | 154.7 |
| D | 12 | 233 | 133836 | 861.05 | 630 | 611 | 154.7 |
| D | 5 | 32 | 67315 | 431.12 | 630 | 611 | 154.7 |
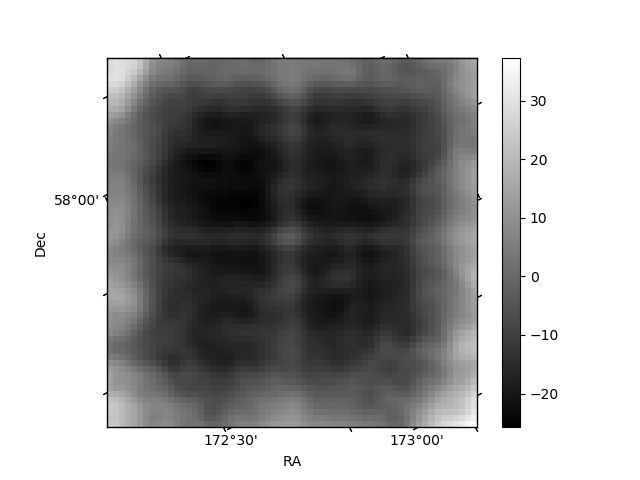
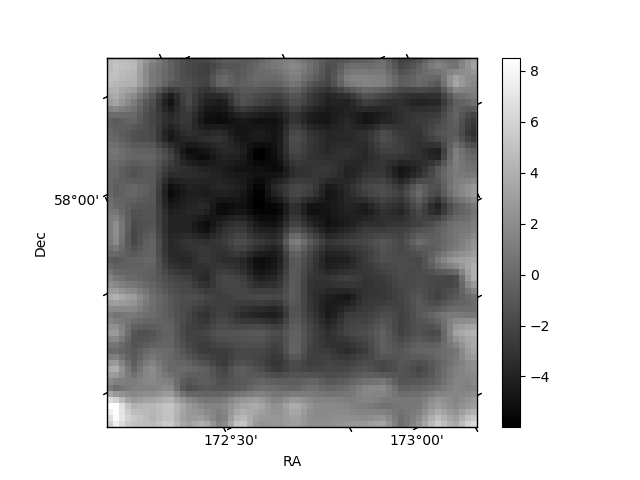
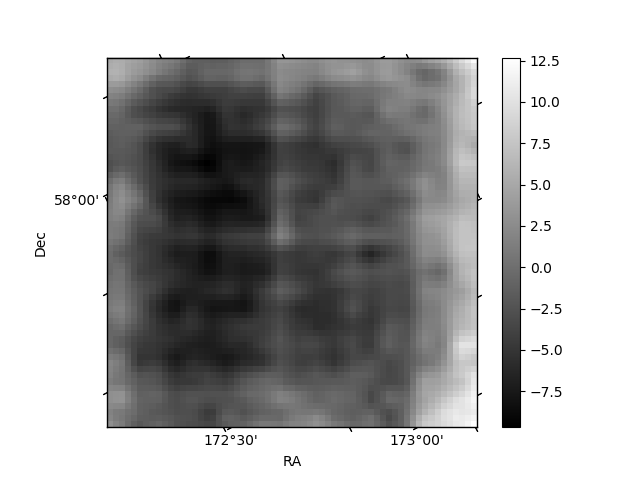
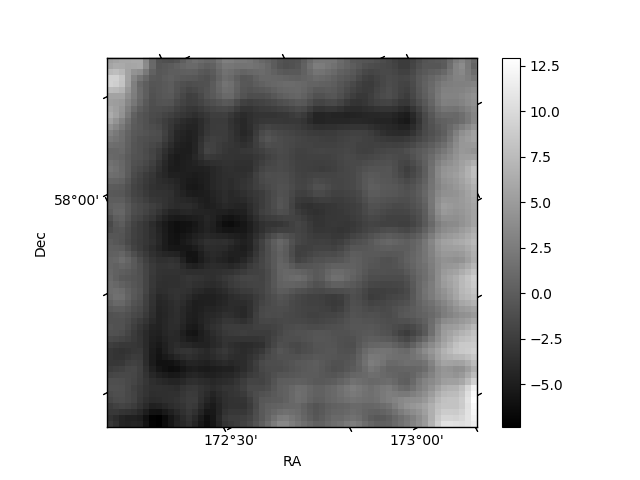
Histogram calculated using DETX and DETY for each event in the final _common_clean file
| Quadrant A | 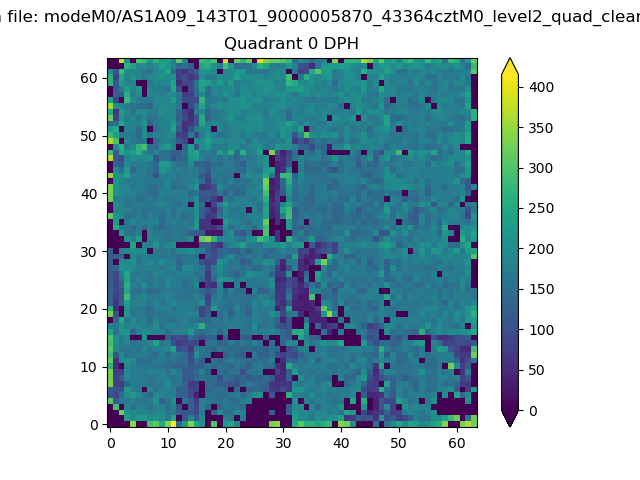 |
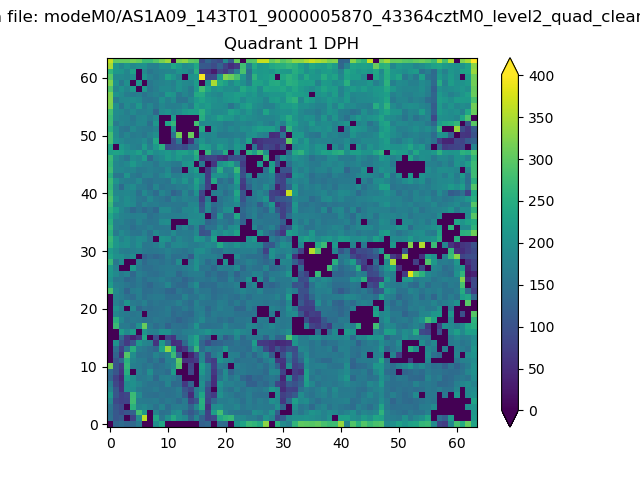 |
Quadrant B |
|---|---|---|---|
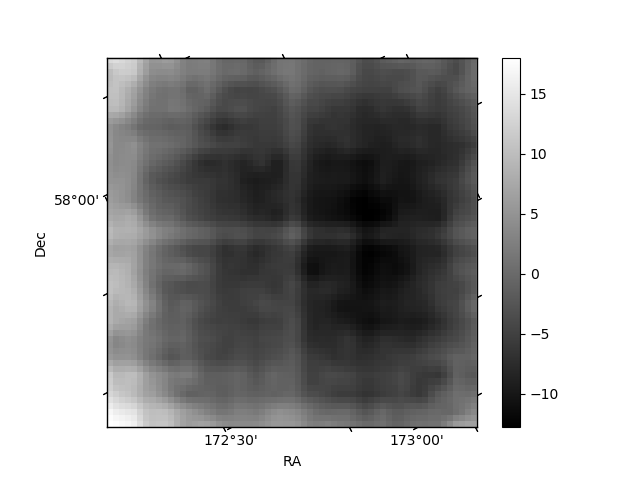
| Quadrant D | 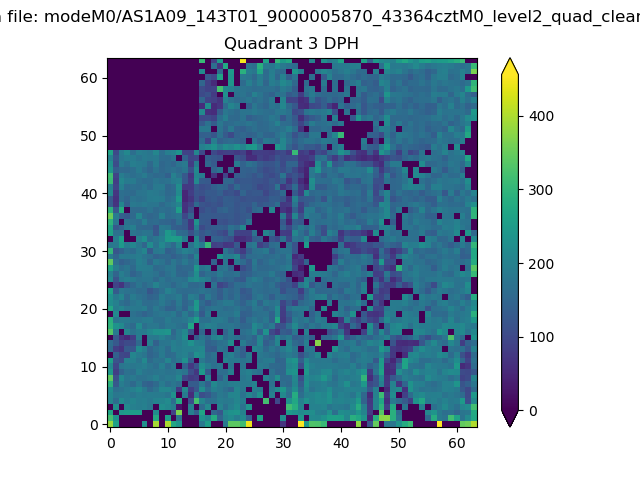 |
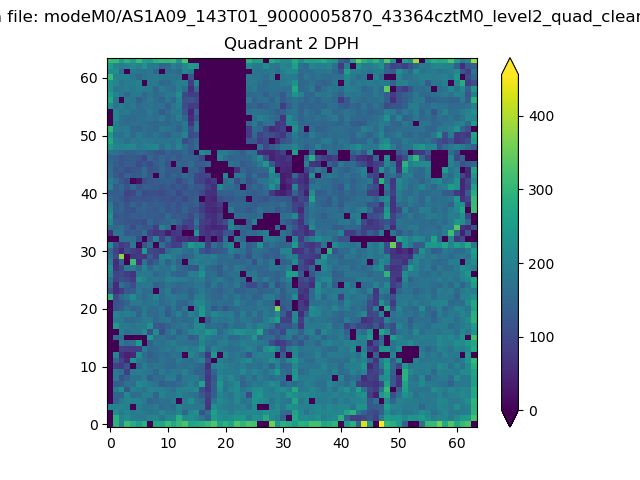 |
Quadrant C |
| Plot type | Count rate plots | Images |
|---|---|---|
| Comparison with Poisson distribution Blue bars denote a histogram of data divided into 1 sec bins. Red curve is a Poisson curve with rate = median count rate of data. |
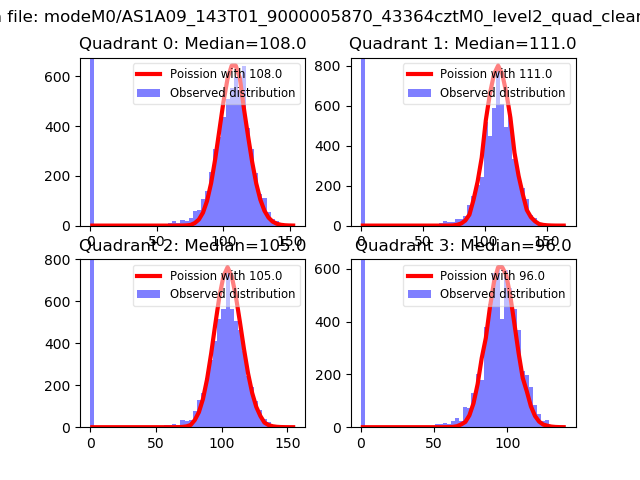 |
 |
| Quadrant-wise count rates Data is divided into 100 sec bins |
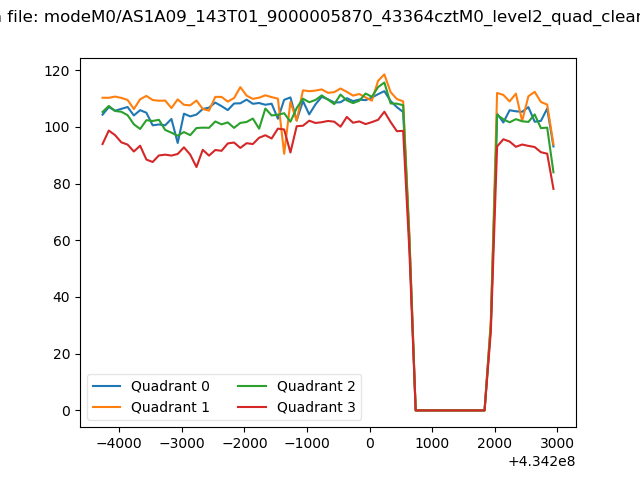 |
|
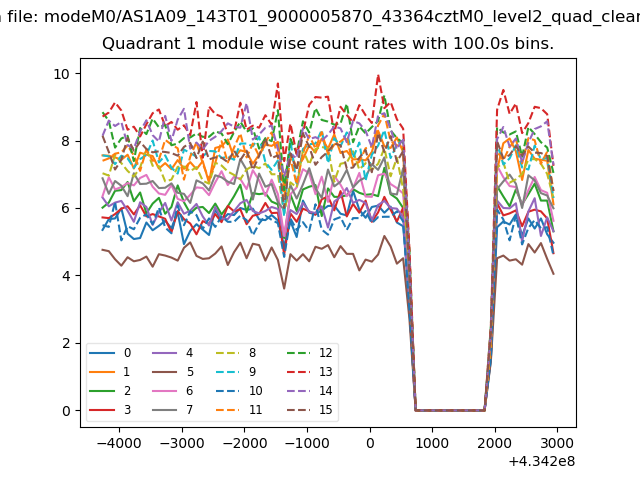
| Module-wise count rates for Quadrant A Data is divided into 100 sec bins |
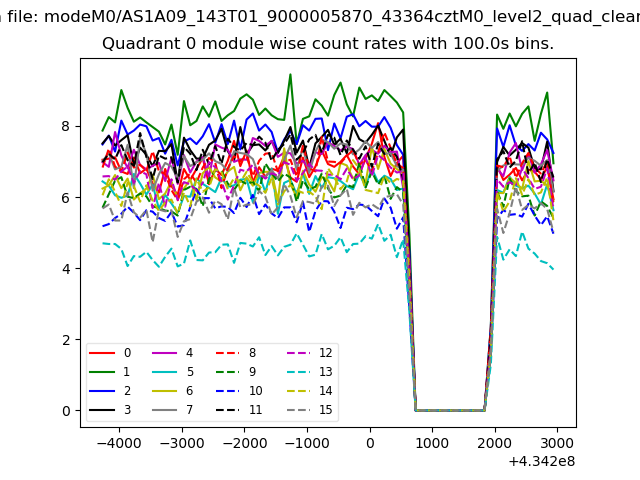 |
 |
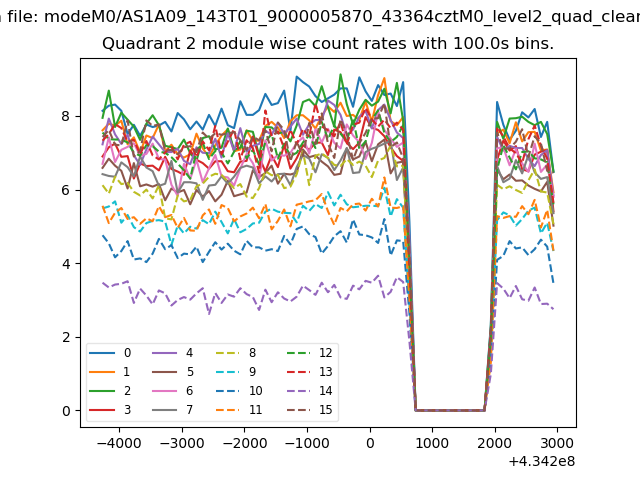
| Module-wise count rates for Quadrant B Data is divided into 100 sec bins |
 |
 |
| Module-wise count rates for Quadrant C Data is divided into 100 sec bins |
 |
 |
| Module-wise count rates for Quadrant D Data is divided into 100 sec bins |
 |
 |
| Parameter | Plot |
|---|---|
| CZT HV Monitor | 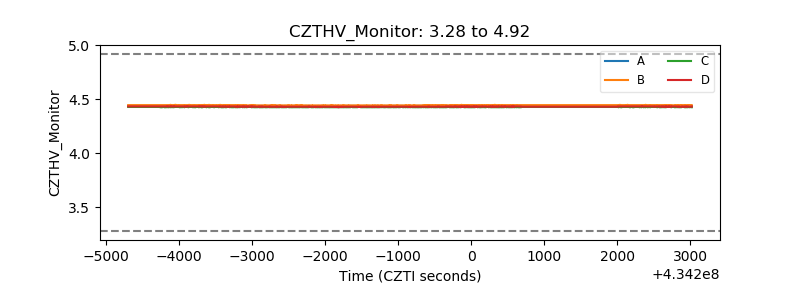 |
| D_VDD | 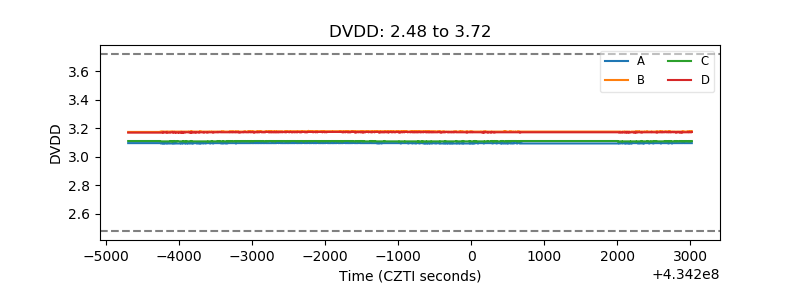 |
| Temperature 1 | 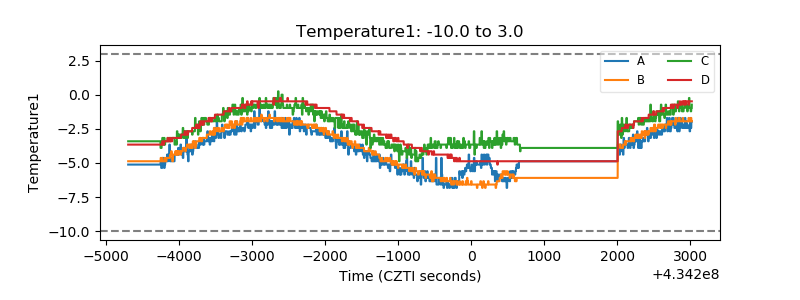 |
| Veto HV Monitor | 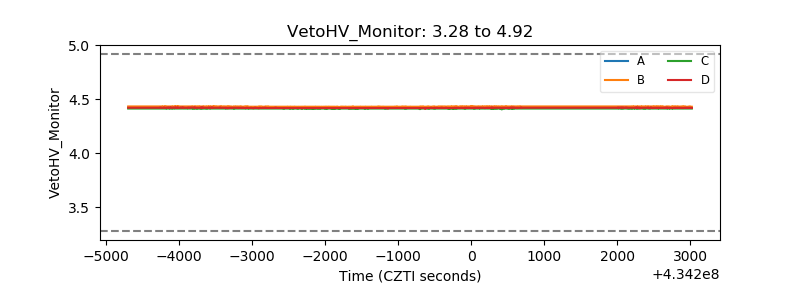 |
| Veto LLD | 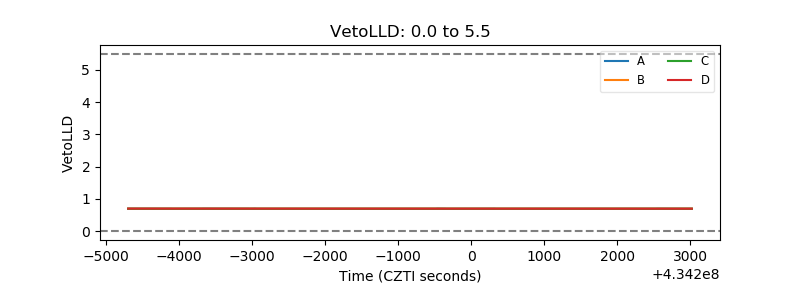 |
| Alpha Counter | 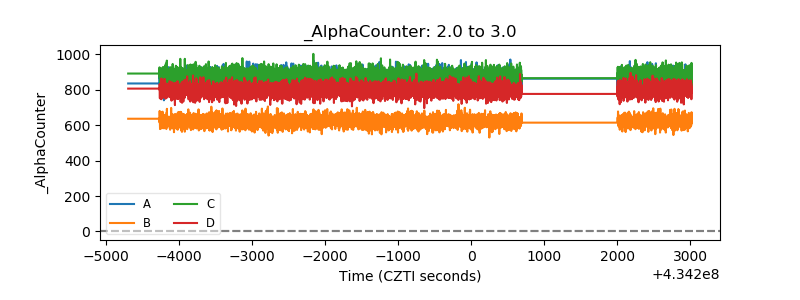 |
| _CPM_Rate | 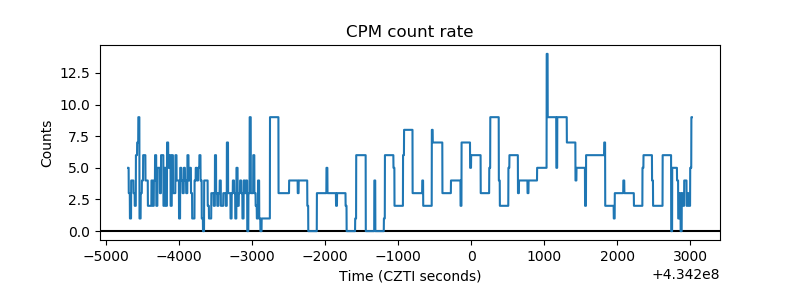 |
| CZT Counter | 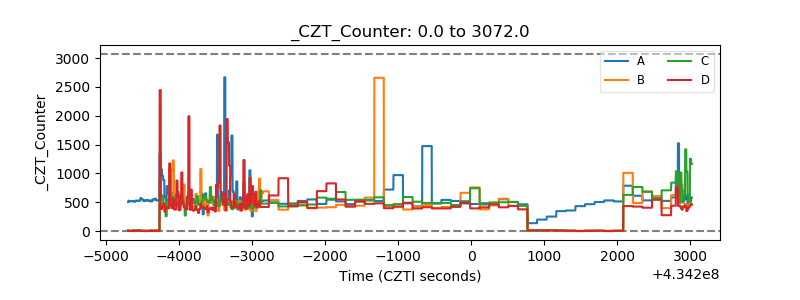 |
| +2.5 Volts monitor | 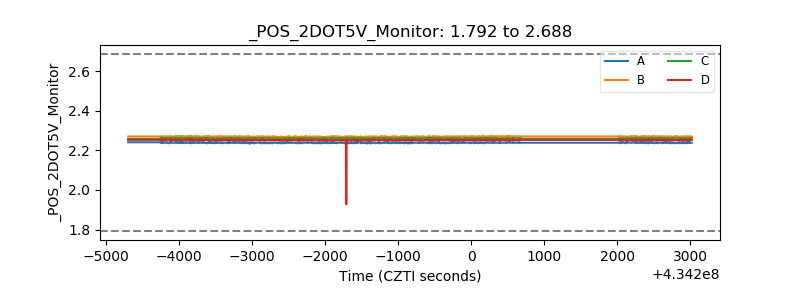 |
| +5 Volts monitor | 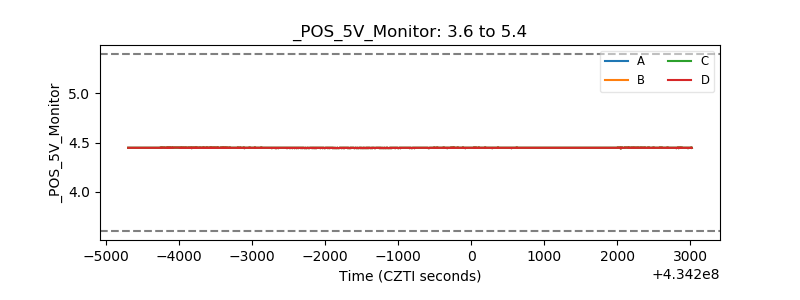 |
| _ROLL_ROT | 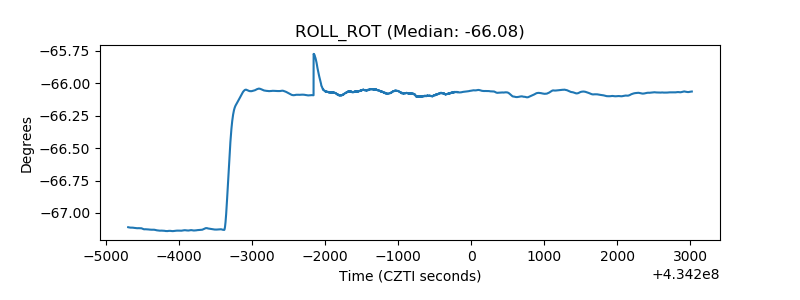 |
| _Roll_DEC | 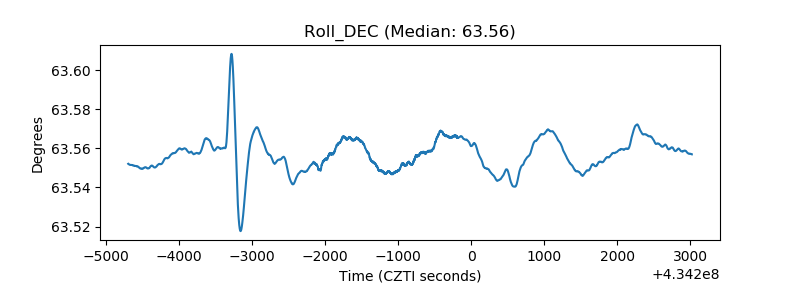 |
| _Roll_RA | 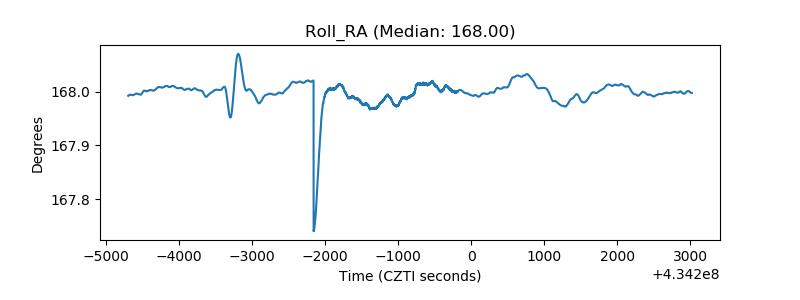 |
| Veto Counter |  |