| Param | Original file | Final file |
|---|---|---|
| Filename | modeM0/AS1A09_143T01_9000005870_43366cztM0_level2.fits | modeM0/AS1A09_143T01_9000005870_43366cztM0_level2_quad_clean.evt |
| Size (bytes) | 677,664,000 | 171,089,280 |
| Size | 646.3 MB | 163.2 MB |
| Events in quadrant A | 6,247,457 | 1,139,109 |
| Events in quadrant B | 5,306,291 | 1,174,192 |
| Events in quadrant C | 7,221,652 | 1,102,942 |
| Events in quadrant D | 5,476,833 | 1,019,616 |
| Mode SS | |||
|---|---|---|---|
| Quadrant | BADHDUFLAG | Total packets | Discarded packets |
| A | 0 | 220 | 0 |
| B | 0 | 220 | 0 |
| C | 0 | 220 | 0 |
| D | 0 | 220 | 0 |
| Mode M9 | |||
|---|---|---|---|
| Quadrant | BADHDUFLAG | Total packets | Discarded packets |
| A | 0 | 28 | 0 |
| B | 0 | 28 | 0 |
| C | 0 | 28 | 0 |
| D | 0 | 28 | 0 |
| Mode M0 | |||
|---|---|---|---|
| Quadrant | BADHDUFLAG | Total packets | Discarded packets |
| A | 0 | 24754 | 3 |
| B | 0 | 22751 | 3 |
| C | 0 | 28492 | 3 |
| D | 0 | 24186 | 3 |
| Quadrant | Total seconds | Saturated seconds | Saturation percentage |
|---|---|---|---|
| A | 10741 | 145 | 1.349967% |
| B | 10742 | 29 | 0.269968% |
| C | 10742 | 135 | 1.256749% |
| D | 10742 | 157 | 1.461553% |
Noise dominated data is calculated using 1-second bins in cleaned event files. If a bin has >2000 counts, and if more than 50% of those come from <1% of pixels, then it is considered to be noise-dominated and hence unusable.
| Quadrant | # 1 sec bins | Bins with >0 counts | Bins with >2000 counts | High rate bins dominated by noise | Noise dominated (total time) | Noise dominated (detector-on time) | Marked lightcurve |
|---|---|---|---|---|---|---|---|
| A | 13546 | 10743 | 107 | 107 | 0.79% | 1.00% | 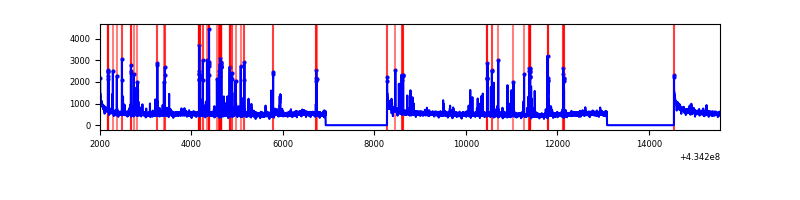 |
| B | 13547 | 10744 | 12 | 12 | 0.09% | 0.11% | 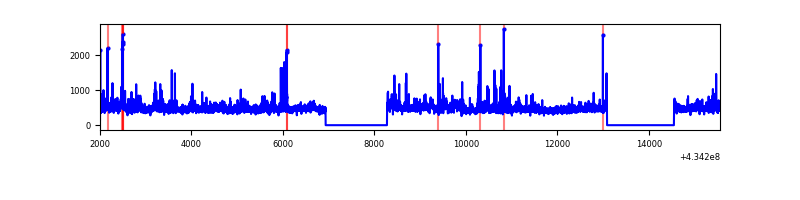 |
| C | 13547 | 10744 | 114 | 114 | 0.84% | 1.06% | 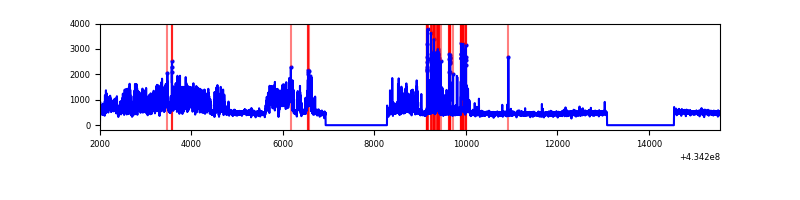 |
| D | 13547 | 10744 | 138 | 138 | 1.02% | 1.28% | 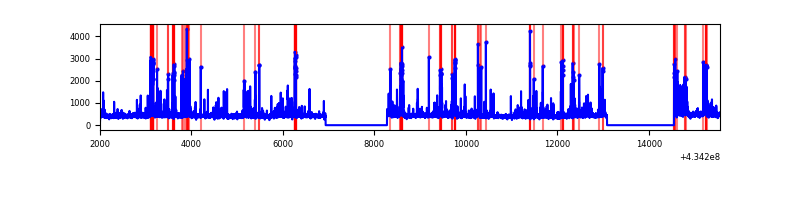 |
Top three noisy pixels from each quadrant. If the there are fewer than three noisy pixels in the level2.evt file, extra rows are filled as -1
| Pixel properties | Quadrant properties | ||||||
|---|---|---|---|---|---|---|---|
| Quadrant | DetID | PixID | Counts | Sigma | Mean | Median | Sigma |
| A | 10 | 83 | 1124941 | 4685.71 | 1167 | 1144 | 239.8 |
| A | 15 | 237 | 546687 | 2274.66 | 1167 | 1144 | 239.8 |
| A | 13 | 6 | 44752 | 181.83 | 1167 | 1144 | 239.8 |
| B | 0 | 189 | 510963 | 2272.62 | 1166 | 1130 | 224.3 |
| B | 0 | 186 | 46170 | 200.77 | 1166 | 1130 | 224.3 |
| B | 0 | 245 | 43266 | 187.82 | 1166 | 1130 | 224.3 |
| C | 8 | 229 | 1477198 | 5576.3 | 1137 | 1143 | 264.7 |
| C | 0 | 239 | 712596 | 2687.75 | 1137 | 1143 | 264.7 |
| C | 15 | 214 | 437987 | 1650.33 | 1137 | 1143 | 264.7 |
| D | 1 | 52 | 258756 | 922.7 | 1140 | 1105 | 279.2 |
| D | 12 | 233 | 132466 | 470.43 | 1140 | 1105 | 279.2 |
| D | 5 | 32 | 126533 | 449.18 | 1140 | 1105 | 279.2 |
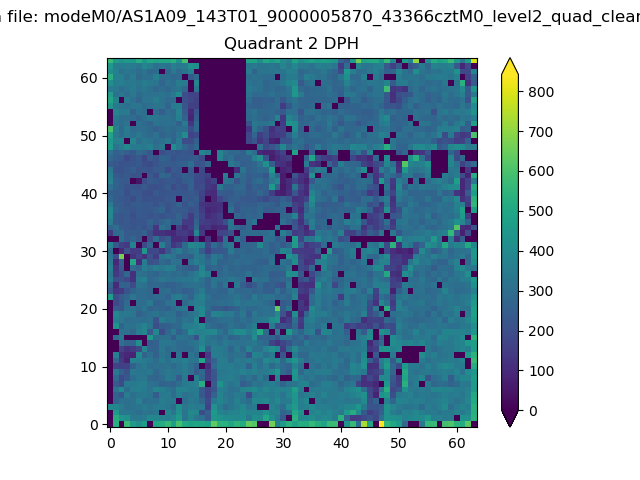
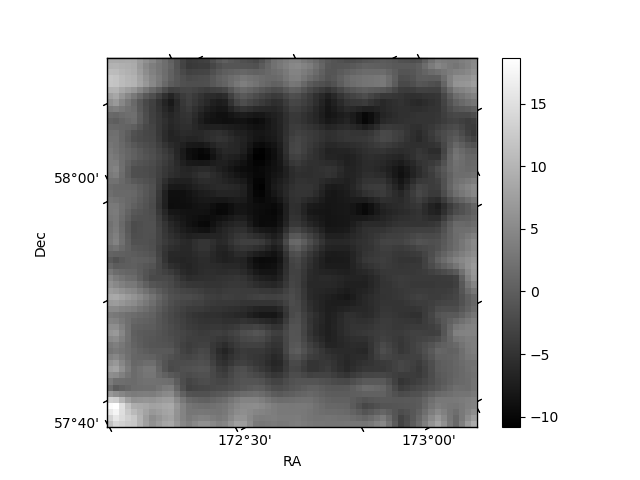
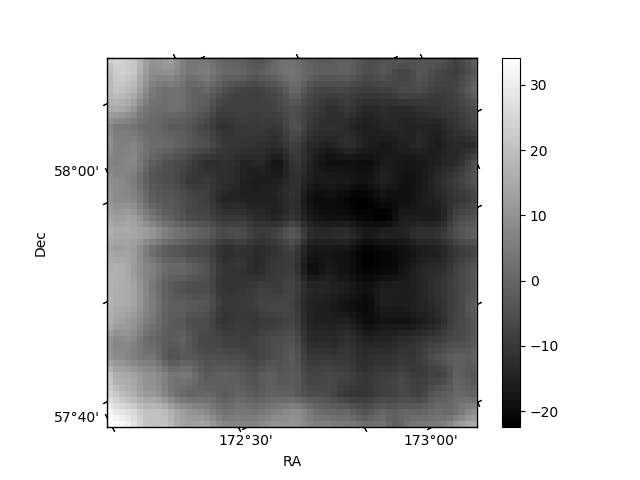
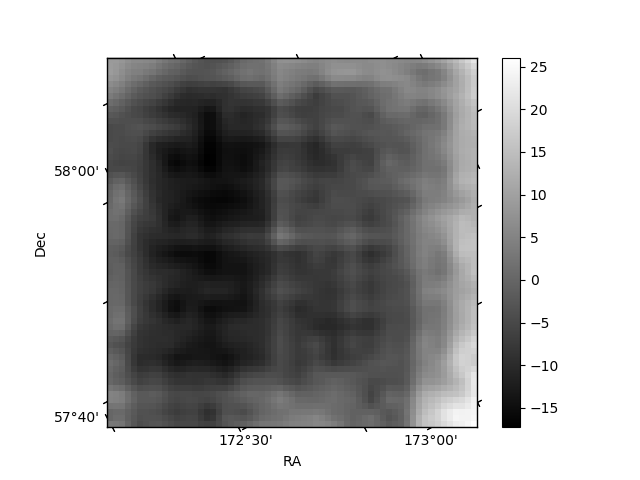
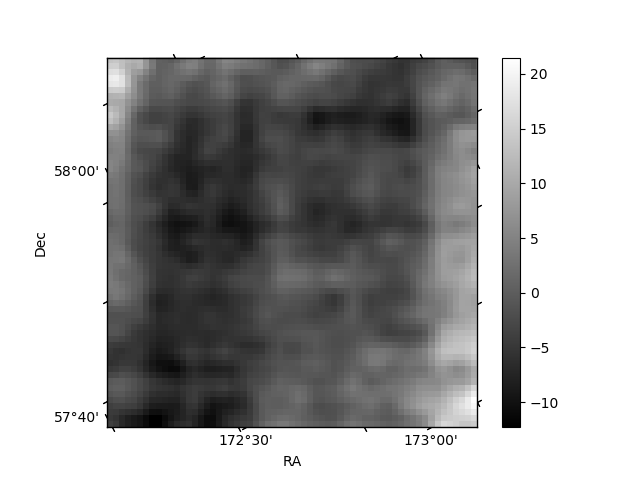
Histogram calculated using DETX and DETY for each event in the final _common_clean file
| Quadrant A | 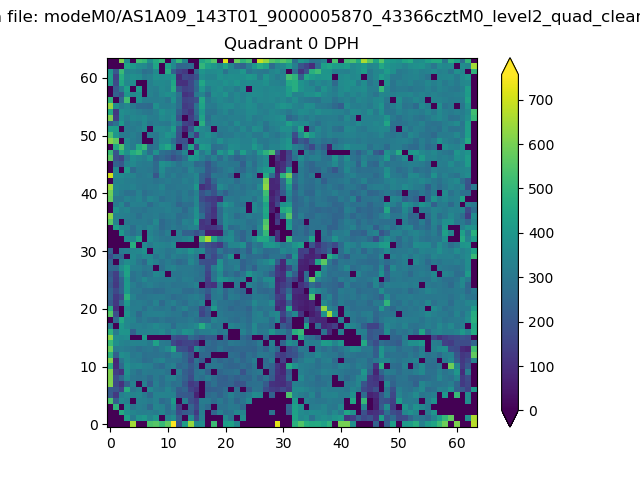 |
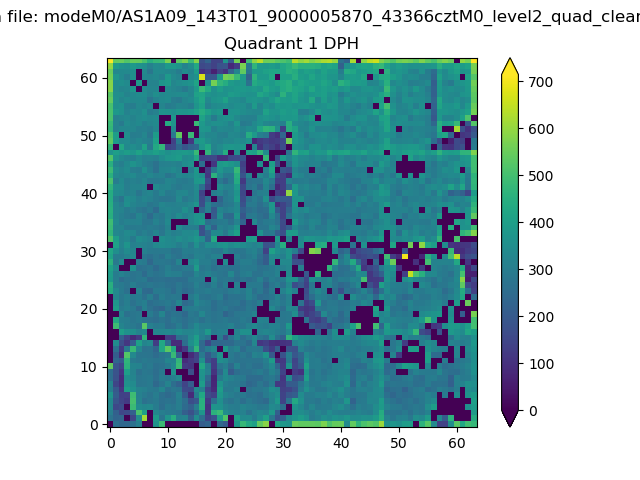 |
Quadrant B |
|---|---|---|---|
| Quadrant D | 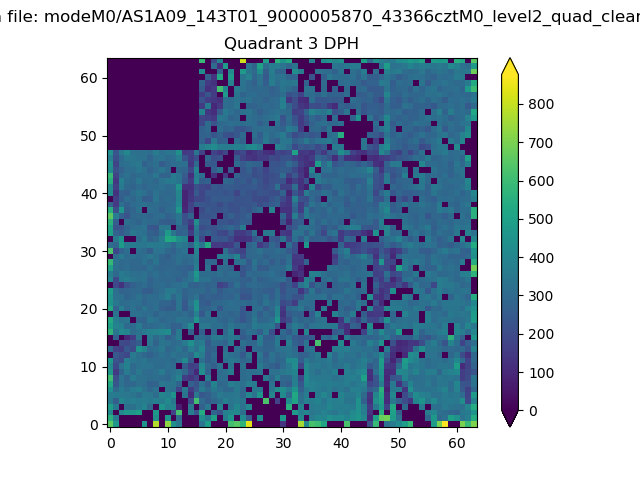 |
 |
Quadrant C |
| Plot type | Count rate plots | Images |
|---|---|---|
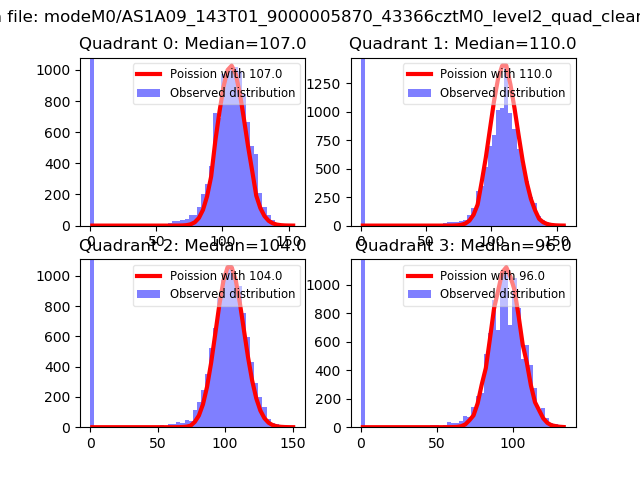
| Comparison with Poisson distribution Blue bars denote a histogram of data divided into 1 sec bins. Red curve is a Poisson curve with rate = median count rate of data. |
 |
 |
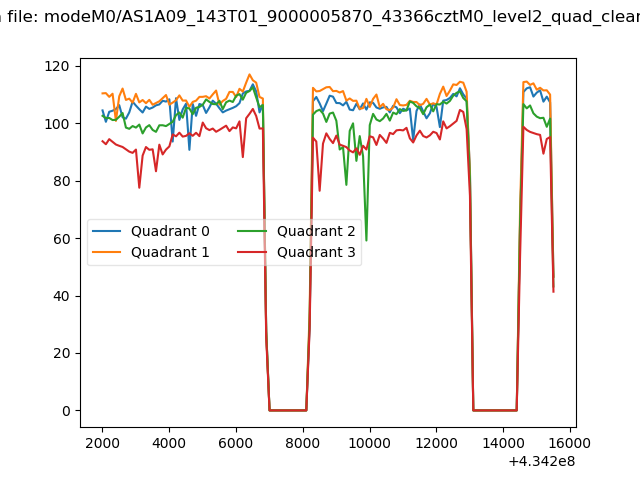
| Quadrant-wise count rates Data is divided into 100 sec bins |
 |
|
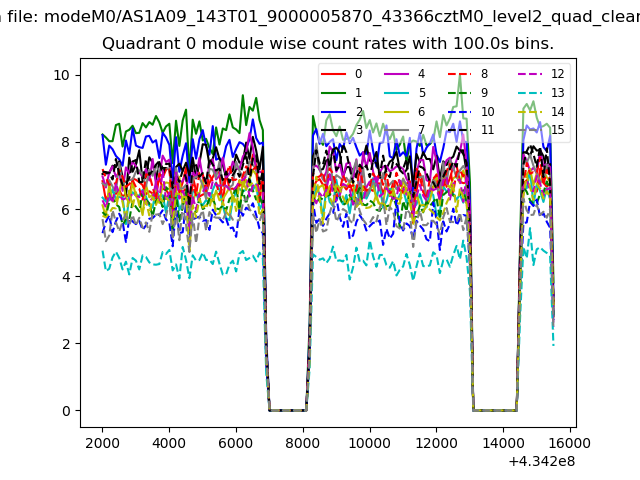
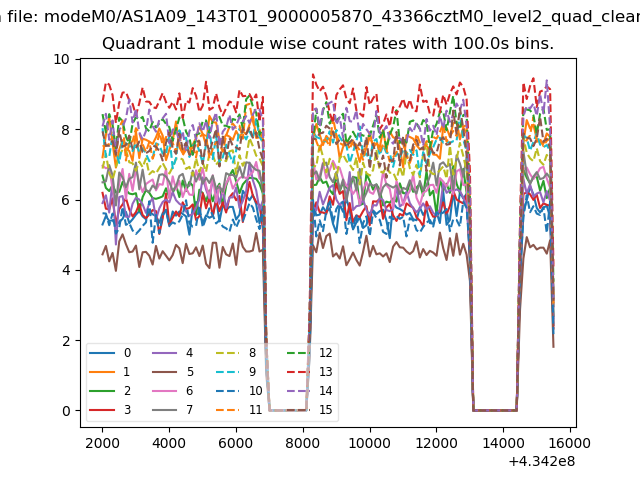
| Module-wise count rates for Quadrant A Data is divided into 100 sec bins |
 |
 |
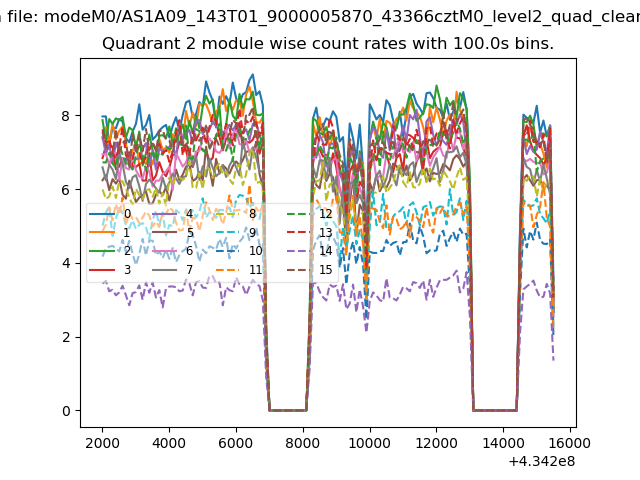
| Module-wise count rates for Quadrant B Data is divided into 100 sec bins |
 |
 |
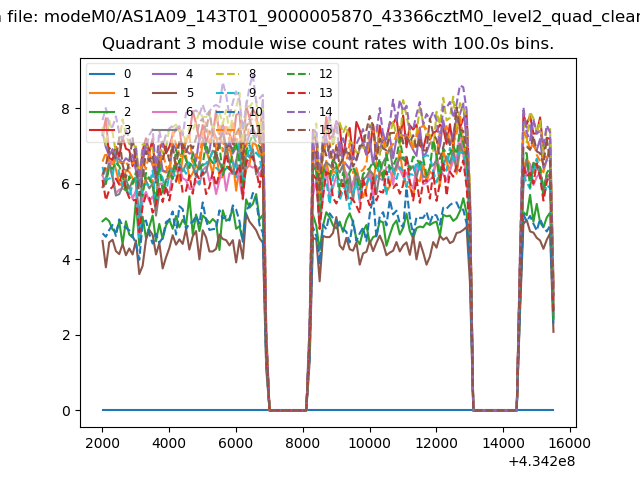
| Module-wise count rates for Quadrant C Data is divided into 100 sec bins |
 |
 |
| Module-wise count rates for Quadrant D Data is divided into 100 sec bins |
 |
 |
| Parameter | Plot |
|---|---|
| CZT HV Monitor | 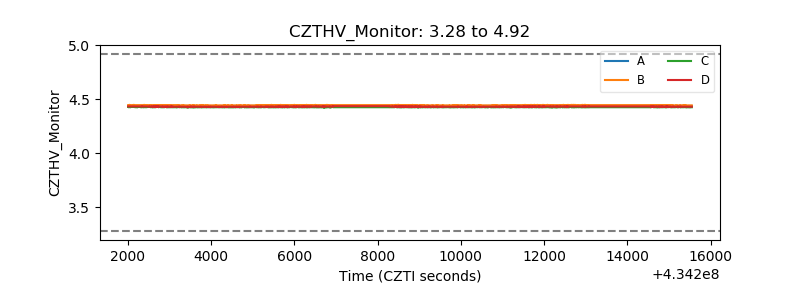 |
| D_VDD | 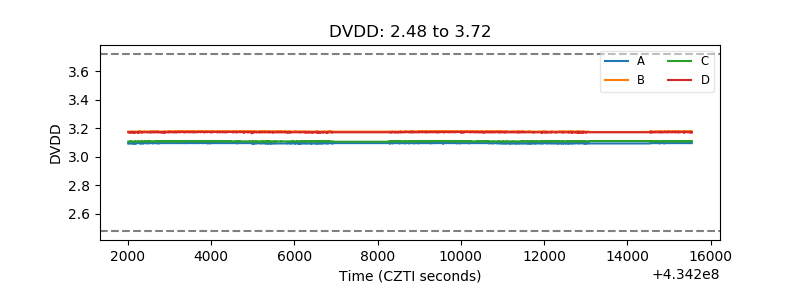 |
| Temperature 1 | 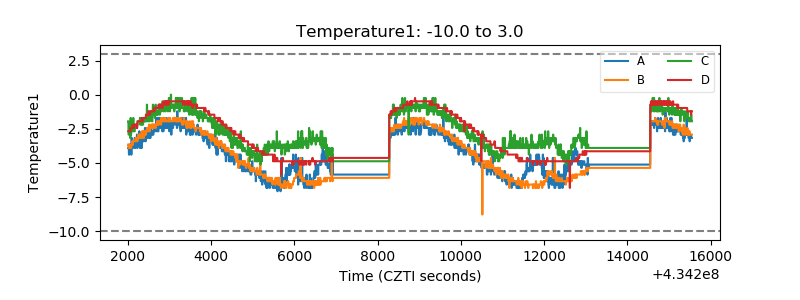 |
| Veto HV Monitor | 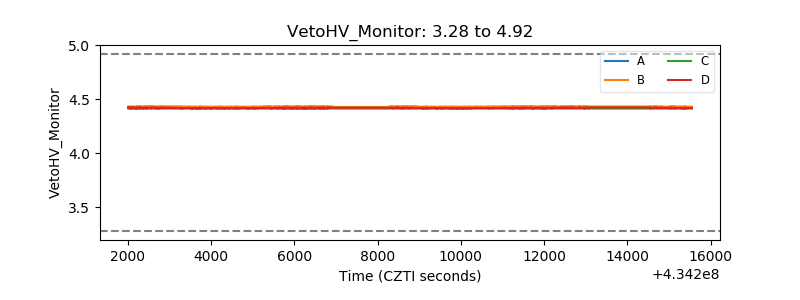 |
| Veto LLD | 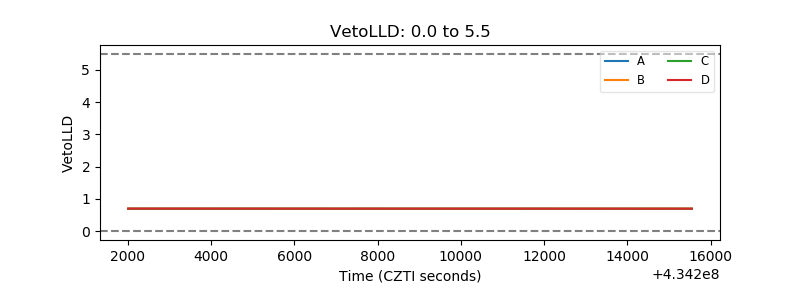 |
| Alpha Counter | 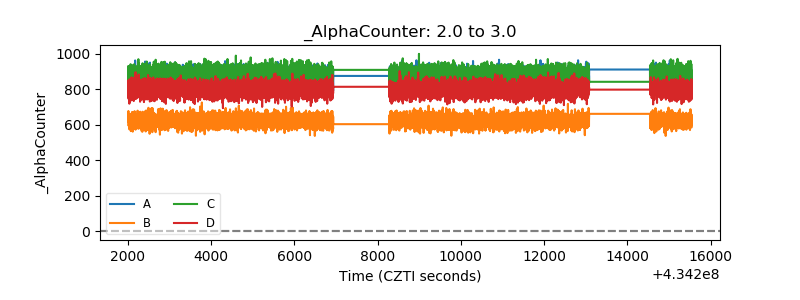 |
| _CPM_Rate | 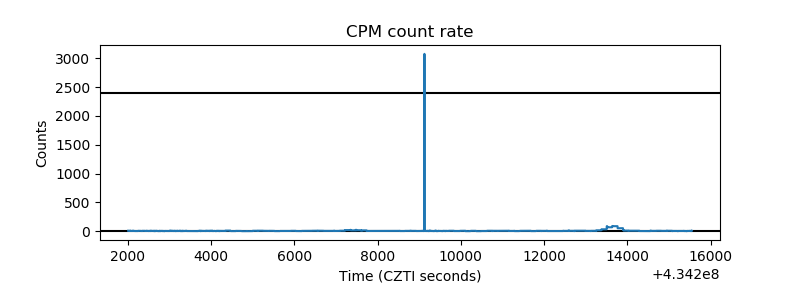 |
| CZT Counter | 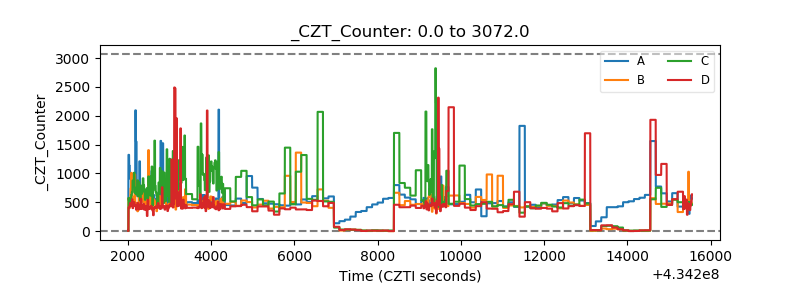 |
| +2.5 Volts monitor | 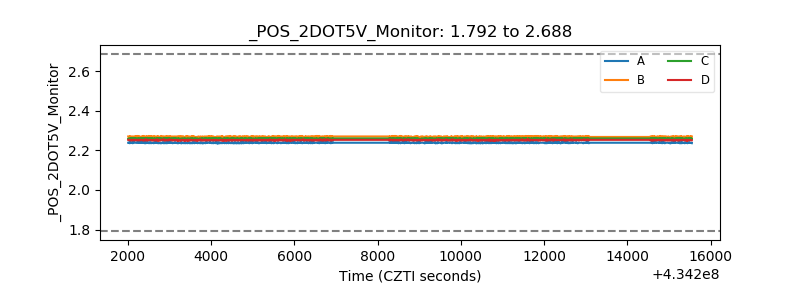 |
| +5 Volts monitor | 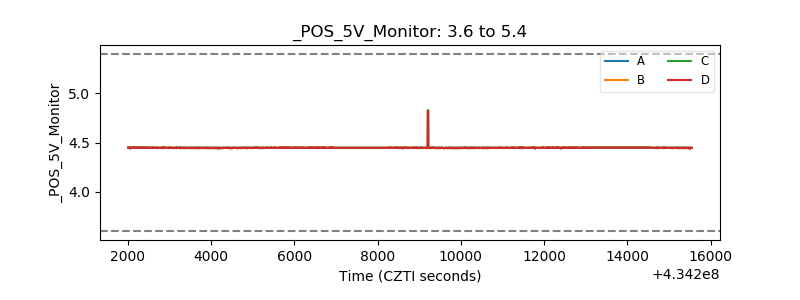 |
| _ROLL_ROT | 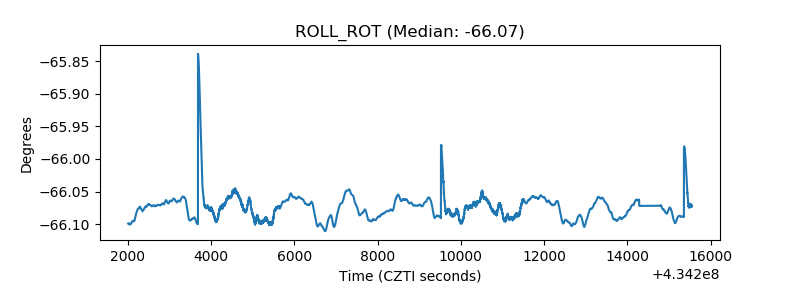 |
| _Roll_DEC | 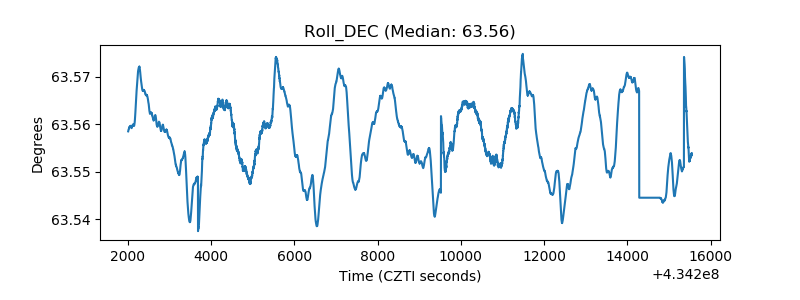 |
| _Roll_RA | 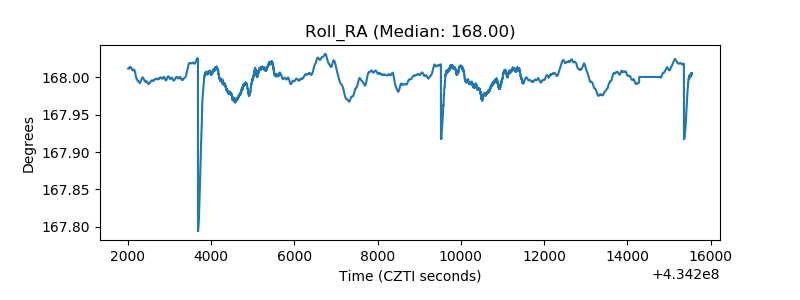 |
| Veto Counter | 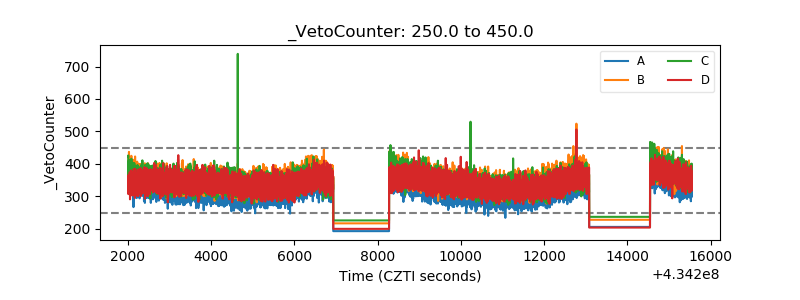 |