| Param | Original file | Final file |
|---|---|---|
| Filename | modeM0/AS1A09_143T01_9000005870_43368cztM0_level2.fits | modeM0/AS1A09_143T01_9000005870_43368cztM0_level2_quad_clean.evt |
| Size (bytes) | 321,232,320 | 91,886,400 |
| Size | 306.4 MB | 87.6 MB |
| Events in quadrant A | 3,241,872 | 609,511 |
| Events in quadrant B | 2,649,551 | 628,054 |
| Events in quadrant C | 2,789,053 | 601,211 |
| Events in quadrant D | 2,776,021 | 553,442 |
| Mode SS | |||
|---|---|---|---|
| Quadrant | BADHDUFLAG | Total packets | Discarded packets |
| A | 0 | 114 | 0 |
| B | 0 | 114 | 0 |
| C | 0 | 114 | 0 |
| D | 0 | 114 | 0 |
| Mode M9 | |||
|---|---|---|---|
| Quadrant | BADHDUFLAG | Total packets | Discarded packets |
| A | 0 | 23 | 0 |
| B | 0 | 24 | 0 |
| C | 0 | 24 | 0 |
| D | 0 | 24 | 0 |
| Mode M0 | |||
|---|---|---|---|
| Quadrant | BADHDUFLAG | Total packets | Discarded packets |
| A | 0 | 13084 | 2 |
| B | 0 | 11514 | 2 |
| C | 0 | 11788 | 2 |
| D | 0 | 12320 | 2 |
| Quadrant | Total seconds | Saturated seconds | Saturation percentage |
|---|---|---|---|
| A | 5575 | 81 | 1.452915% |
| B | 5575 | 16 | 0.286996% |
| C | 5574 | 35 | 0.627915% |
| D | 5574 | 42 | 0.753498% |
Noise dominated data is calculated using 1-second bins in cleaned event files. If a bin has >2000 counts, and if more than 50% of those come from <1% of pixels, then it is considered to be noise-dominated and hence unusable.
| Quadrant | # 1 sec bins | Bins with >0 counts | Bins with >2000 counts | High rate bins dominated by noise | Noise dominated (total time) | Noise dominated (detector-on time) | Marked lightcurve |
|---|---|---|---|---|---|---|---|
| A | 7246 | 5576 | 68 | 68 | 0.94% | 1.22% | 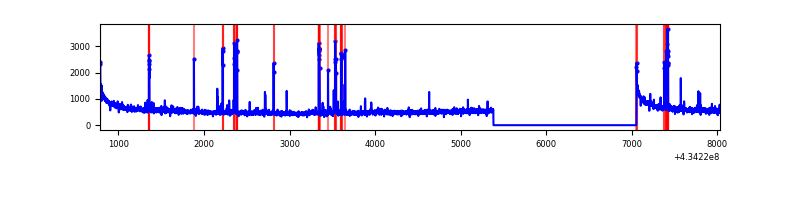 |
| B | 7246 | 5576 | 6 | 6 | 0.08% | 0.11% | 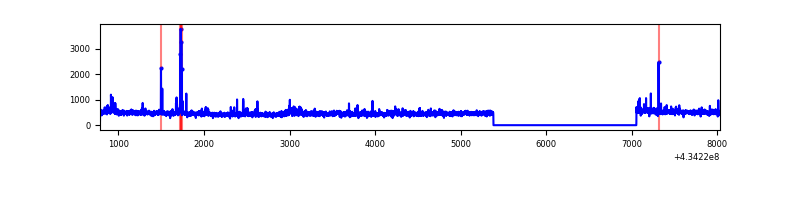 |
| C | 7245 | 5575 | 30 | 30 | 0.41% | 0.54% | 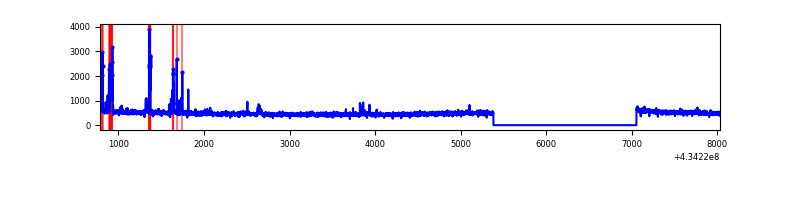 |
| D | 7245 | 5575 | 41 | 41 | 0.57% | 0.74% | 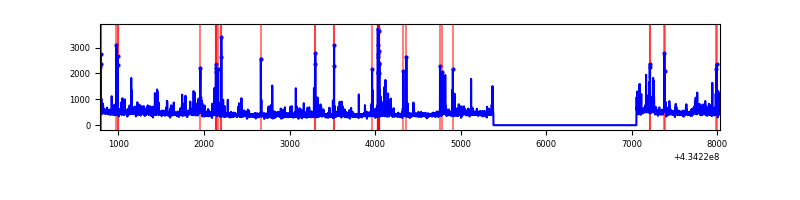 |
Top three noisy pixels from each quadrant. If the there are fewer than three noisy pixels in the level2.evt file, extra rows are filled as -1
| Pixel properties | Quadrant properties | ||||||
|---|---|---|---|---|---|---|---|
| Quadrant | DetID | PixID | Counts | Sigma | Mean | Median | Sigma |
| A | 10 | 83 | 622392 | 4898.21 | 608 | 594 | 126.9 |
| A | 15 | 237 | 229273 | 1801.42 | 608 | 594 | 126.9 |
| A | 13 | 248 | 14707 | 111.18 | 608 | 594 | 126.9 |
| B | 0 | 189 | 87185 | 732.81 | 608 | 591 | 118.2 |
| B | 3 | 112 | 71457 | 599.71 | 608 | 591 | 118.2 |
| B | 0 | 245 | 33734 | 280.48 | 608 | 591 | 118.2 |
| C | 15 | 214 | 229781 | 1610.0 | 601 | 603 | 142.3 |
| C | 15 | 111 | 73248 | 510.34 | 601 | 603 | 142.3 |
| C | 0 | 239 | 59936 | 416.82 | 601 | 603 | 142.3 |
| D | 12 | 218 | 101720 | 689.57 | 599 | 581 | 146.7 |
| D | 5 | 32 | 89426 | 605.75 | 599 | 581 | 146.7 |
| D | 12 | 233 | 74351 | 502.96 | 599 | 581 | 146.7 |
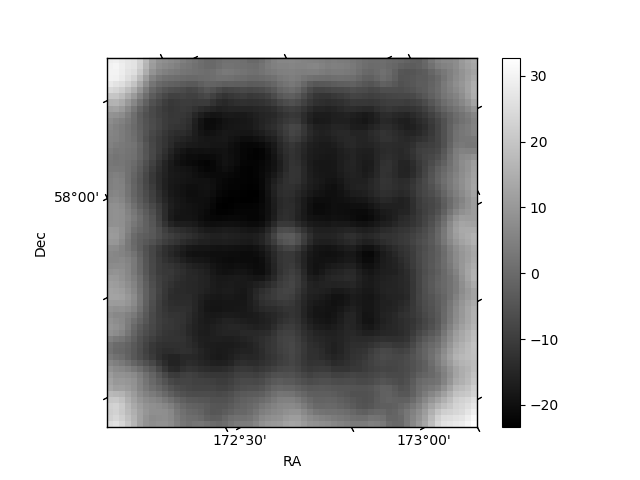
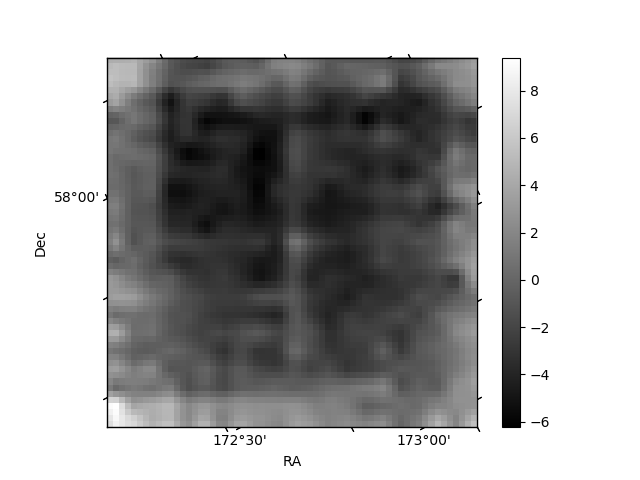
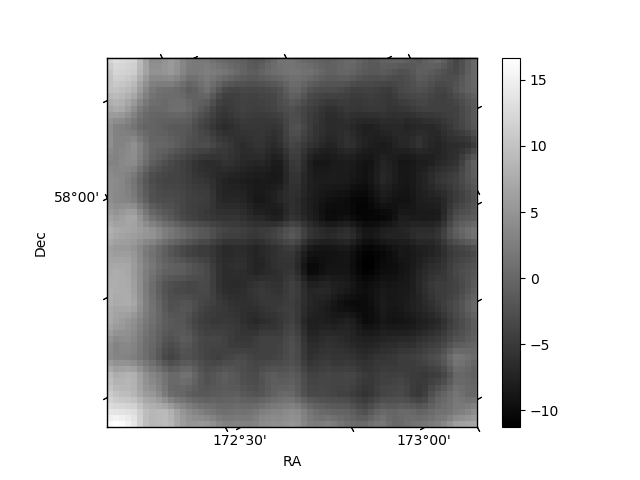
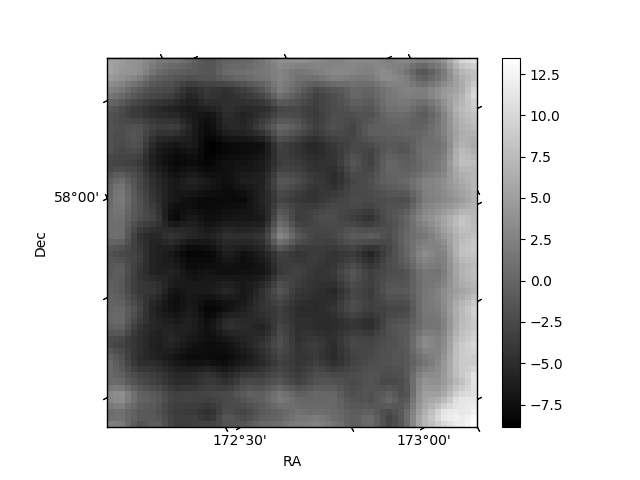
Histogram calculated using DETX and DETY for each event in the final _common_clean file
| Quadrant A |  |
 |
Quadrant B |
|---|---|---|---|
| Quadrant D |  |
 |
Quadrant C |
| Plot type | Count rate plots | Images |
|---|---|---|
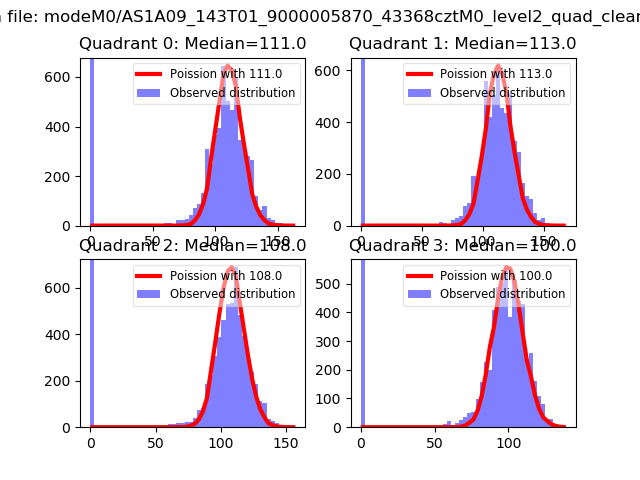
| Comparison with Poisson distribution Blue bars denote a histogram of data divided into 1 sec bins. Red curve is a Poisson curve with rate = median count rate of data. |
 |
 |
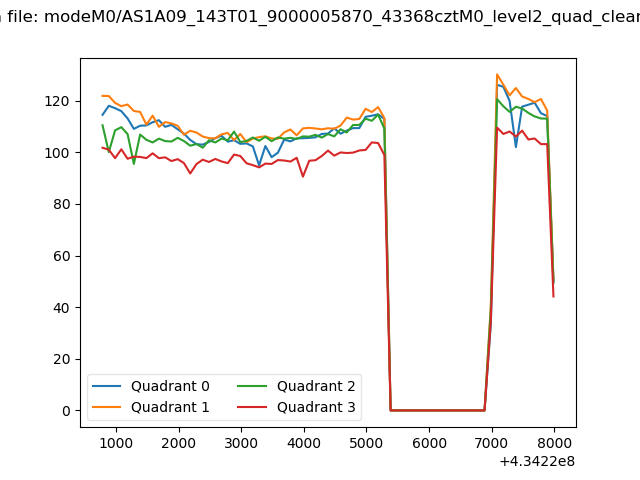
| Quadrant-wise count rates Data is divided into 100 sec bins |
 |
|
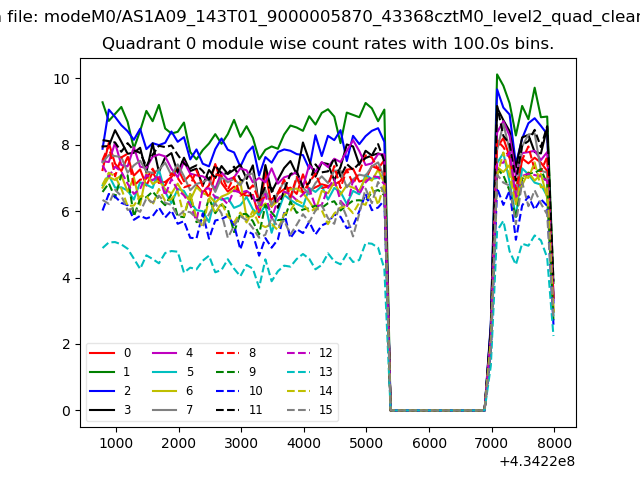
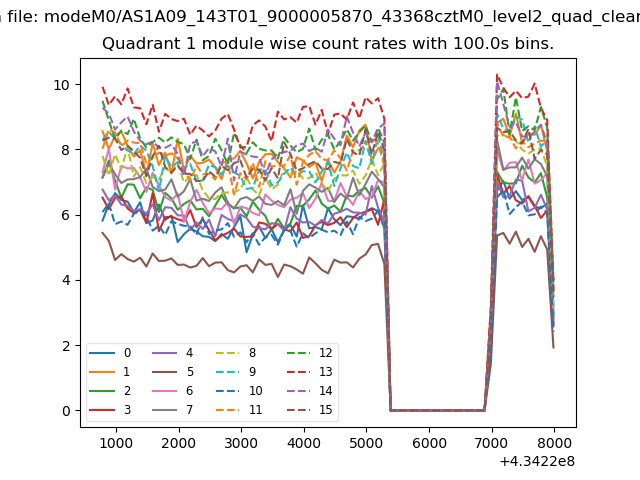
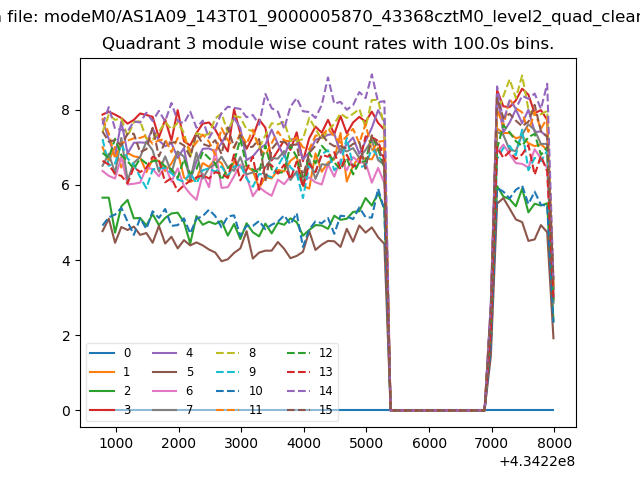
| Module-wise count rates for Quadrant A Data is divided into 100 sec bins |
 |
 |
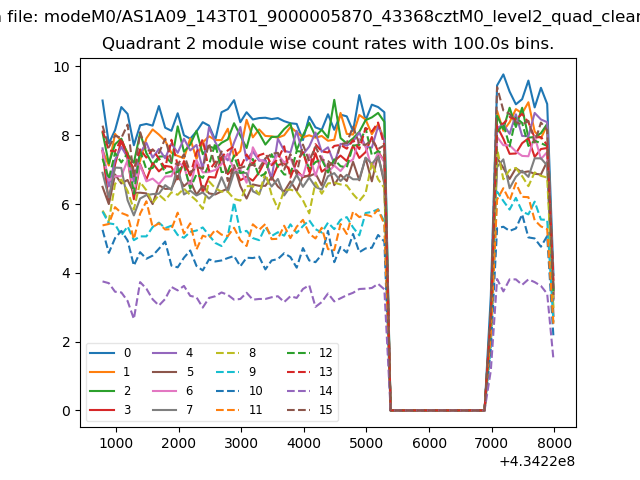
| Module-wise count rates for Quadrant B Data is divided into 100 sec bins |
 |
 |
| Module-wise count rates for Quadrant C Data is divided into 100 sec bins |
 |
 |
| Module-wise count rates for Quadrant D Data is divided into 100 sec bins |
 |
 |
| Parameter | Plot |
|---|---|
| CZT HV Monitor | 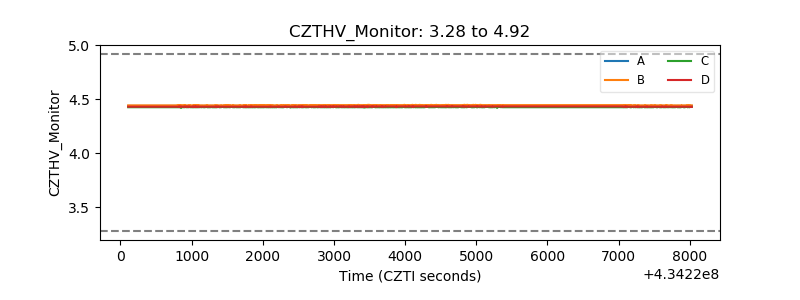 |
| D_VDD | 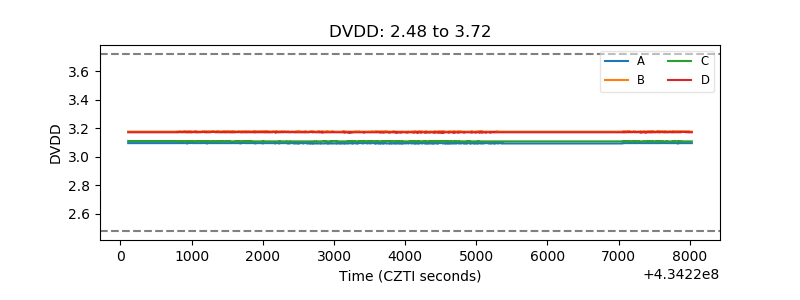 |
| Temperature 1 | 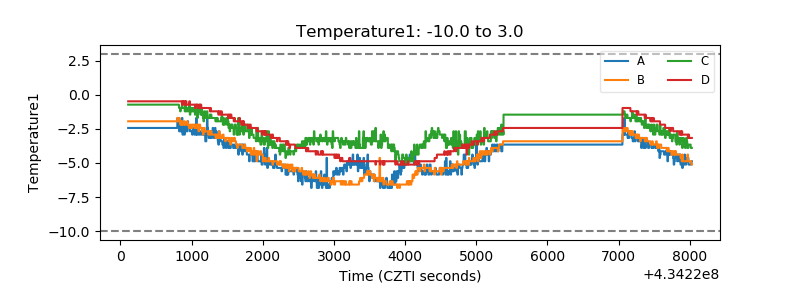 |
| Veto HV Monitor | 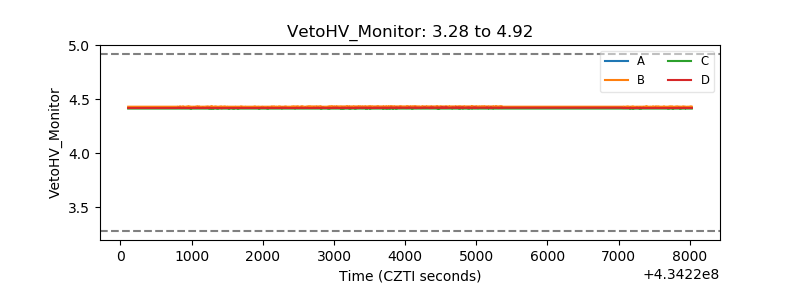 |
| Veto LLD | 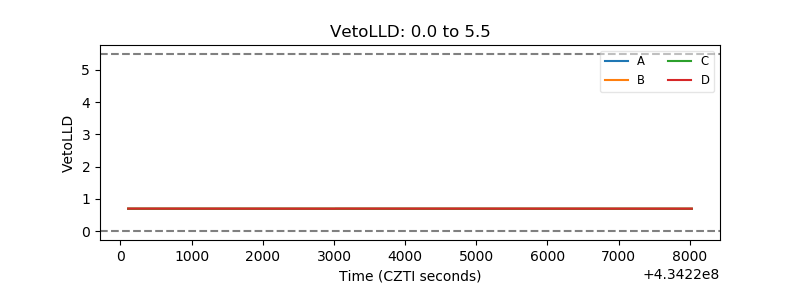 |
| Alpha Counter | 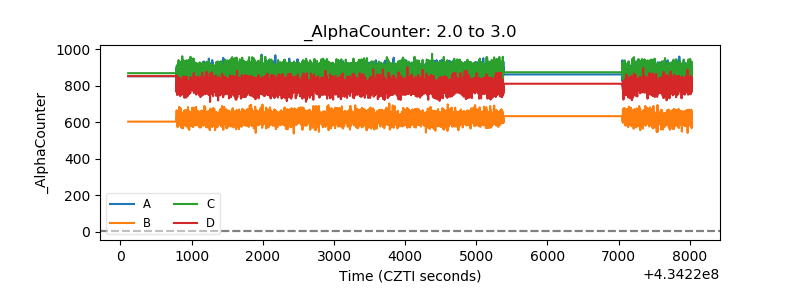 |
| _CPM_Rate | 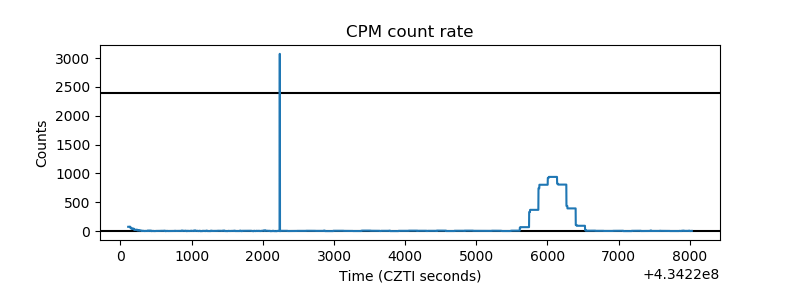 |
| CZT Counter | 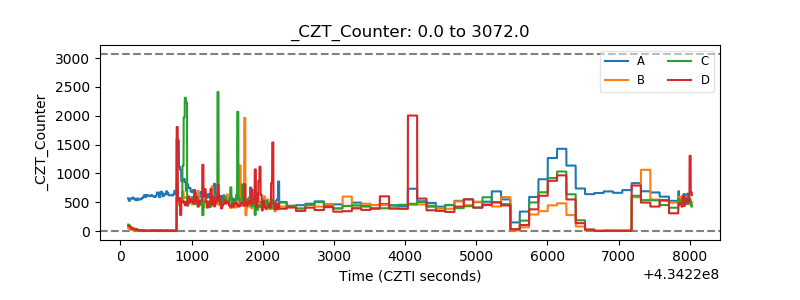 |
| +2.5 Volts monitor | 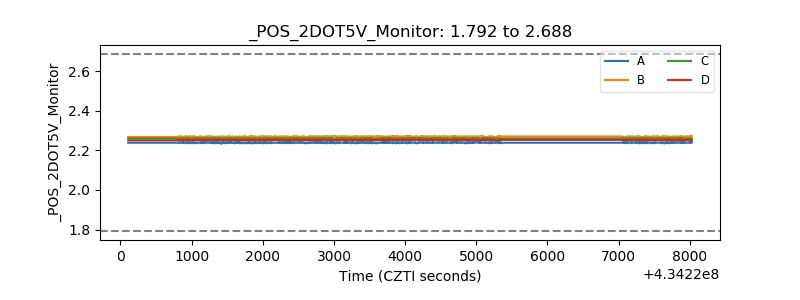 |
| +5 Volts monitor | 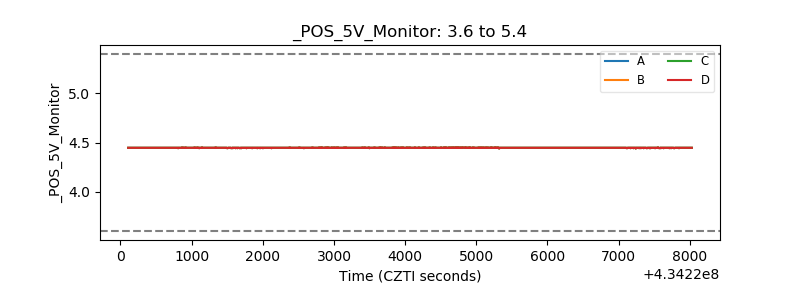 |
| _ROLL_ROT | 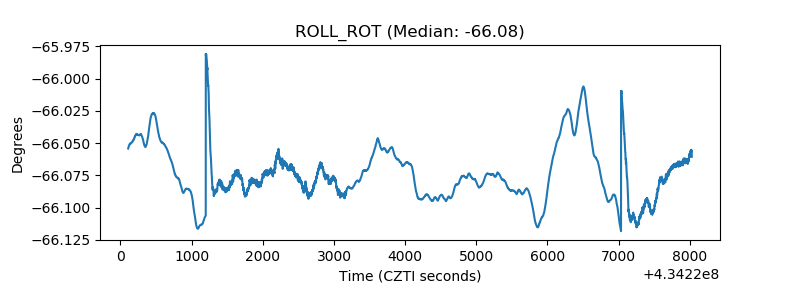 |
| _Roll_DEC |  |
| _Roll_RA | 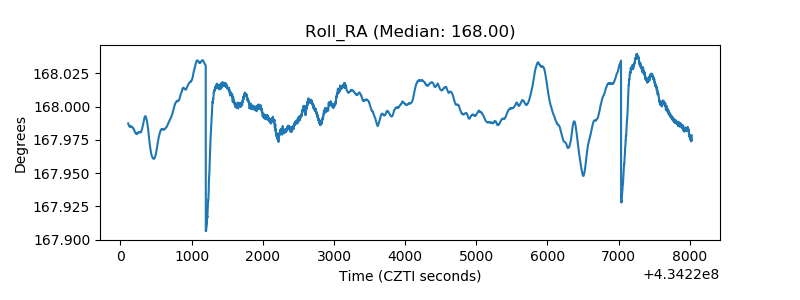 |
| Veto Counter | 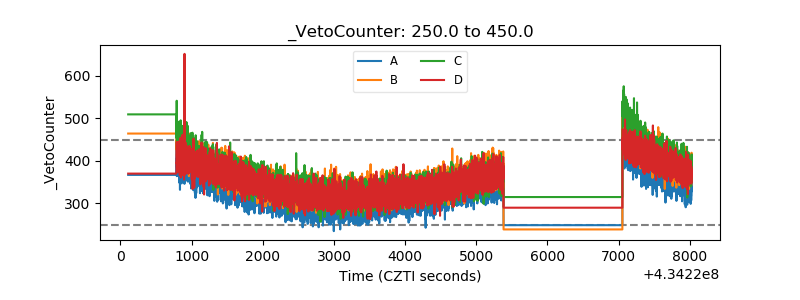 |