| Param | Original file | Final file |
|---|---|---|
| Filename | modeM0/AS1A09_143T01_9000005870_43370cztM0_level2.fits | modeM0/AS1A09_143T01_9000005870_43370cztM0_level2_quad_clean.evt |
| Size (bytes) | 299,413,440 | 90,126,720 |
| Size | 285.5 MB | 86.0 MB |
| Events in quadrant A | 3,056,747 | 598,170 |
| Events in quadrant B | 2,513,825 | 615,317 |
| Events in quadrant C | 2,537,232 | 597,155 |
| Events in quadrant D | 2,562,014 | 547,581 |
| Mode SS | |||
|---|---|---|---|
| Quadrant | BADHDUFLAG | Total packets | Discarded packets |
| A | 0 | 106 | 0 |
| B | 0 | 106 | 0 |
| C | 0 | 106 | 0 |
| D | 0 | 106 | 0 |
| Mode M9 | |||
|---|---|---|---|
| Quadrant | BADHDUFLAG | Total packets | Discarded packets |
| A | 0 | 20 | 0 |
| B | 0 | 21 | 0 |
| C | 0 | 21 | 0 |
| D | 0 | 21 | 0 |
| Mode M0 | |||
|---|---|---|---|
| Quadrant | BADHDUFLAG | Total packets | Discarded packets |
| A | 0 | 12416 | 2 |
| B | 0 | 11004 | 2 |
| C | 0 | 10938 | 2 |
| D | 0 | 11593 | 2 |
| Quadrant | Total seconds | Saturated seconds | Saturation percentage |
|---|---|---|---|
| A | 5303 | 65 | 1.225721% |
| B | 5303 | 8 | 0.150858% |
| C | 5302 | 4 | 0.075443% |
| D | 5302 | 43 | 0.811015% |
Noise dominated data is calculated using 1-second bins in cleaned event files. If a bin has >2000 counts, and if more than 50% of those come from <1% of pixels, then it is considered to be noise-dominated and hence unusable.
| Quadrant | # 1 sec bins | Bins with >0 counts | Bins with >2000 counts | High rate bins dominated by noise | Noise dominated (total time) | Noise dominated (detector-on time) | Marked lightcurve |
|---|---|---|---|---|---|---|---|
| A | 7126 | 5304 | 51 | 51 | 0.72% | 0.96% | 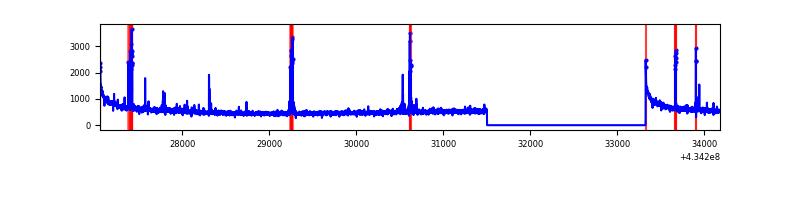 |
| B | 7126 | 5304 | 1 | 1 | 0.01% | 0.02% | 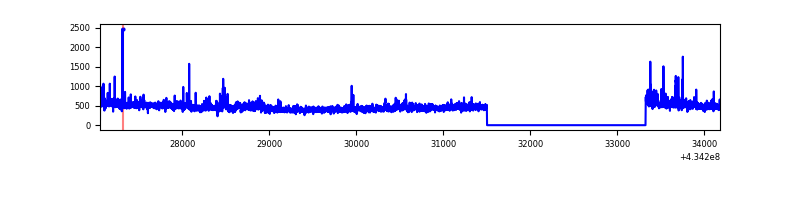 |
| C | 7125 | 5303 | 0 | 0 | 0.00% | 0.00% | 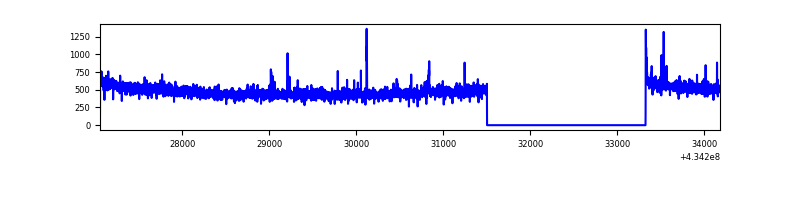 |
| D | 7125 | 5303 | 30 | 30 | 0.42% | 0.57% | 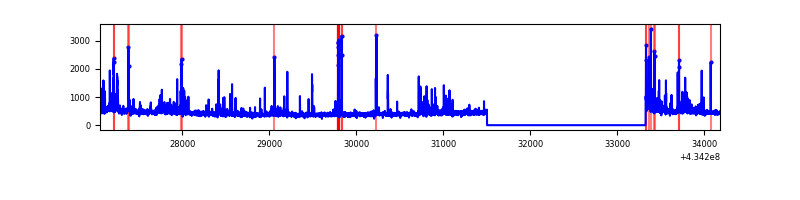 |
Top three noisy pixels from each quadrant. If the there are fewer than three noisy pixels in the level2.evt file, extra rows are filled as -1
| Pixel properties | Quadrant properties | ||||||
|---|---|---|---|---|---|---|---|
| Quadrant | DetID | PixID | Counts | Sigma | Mean | Median | Sigma |
| A | 10 | 83 | 588561 | 4870.31 | 583 | 570 | 120.7 |
| A | 15 | 237 | 104333 | 859.47 | 583 | 570 | 120.7 |
| A | 13 | 248 | 92579 | 762.11 | 583 | 570 | 120.7 |
| B | 0 | 189 | 125246 | 1115.77 | 583 | 567 | 111.7 |
| B | 3 | 112 | 50103 | 443.3 | 583 | 567 | 111.7 |
| B | 4 | 173 | 17395 | 150.6 | 583 | 567 | 111.7 |
| C | 15 | 214 | 219457 | 1614.93 | 577 | 580 | 135.5 |
| C | 0 | 207 | 29408 | 212.7 | 577 | 580 | 135.5 |
| C | 3 | 233 | 28399 | 205.26 | 577 | 580 | 135.5 |
| D | 12 | 6 | 73525 | 526.34 | 574 | 558 | 138.6 |
| D | 12 | 233 | 47467 | 338.37 | 574 | 558 | 138.6 |
| D | 7 | 96 | 46805 | 333.6 | 574 | 558 | 138.6 |
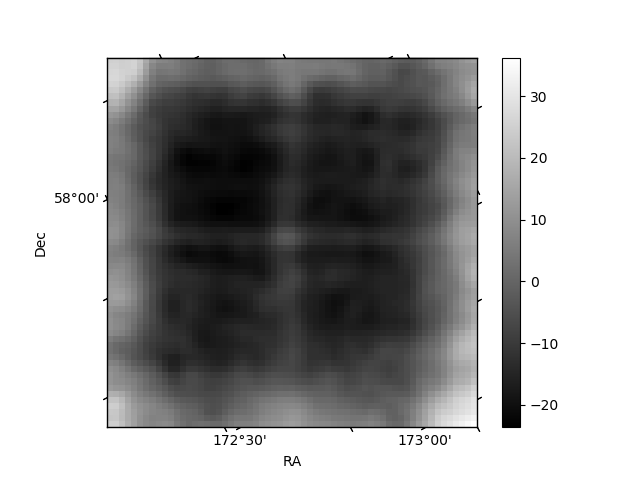
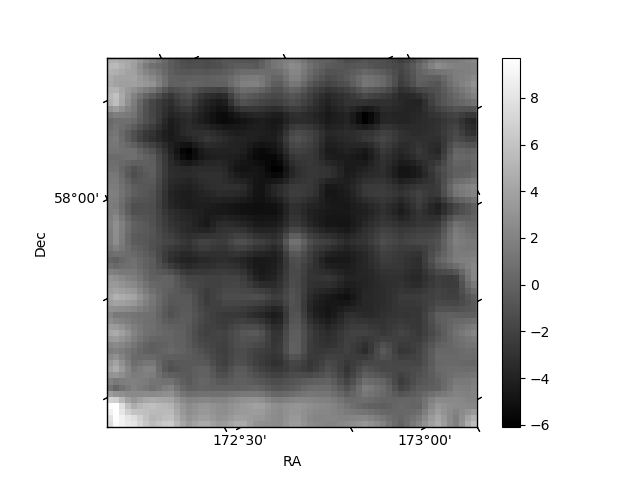
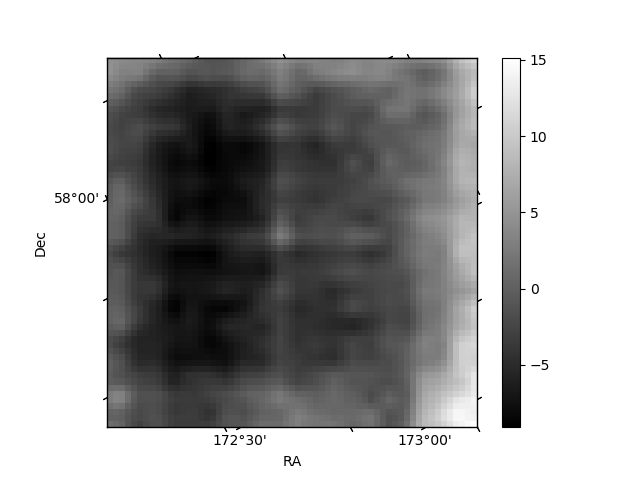
Histogram calculated using DETX and DETY for each event in the final _common_clean file
| Quadrant A | 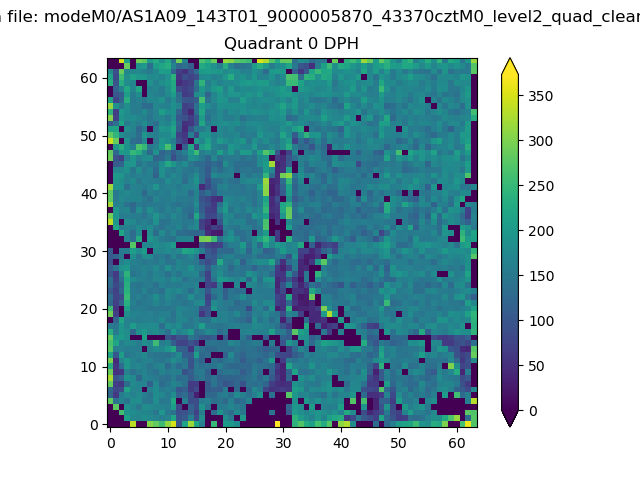 |
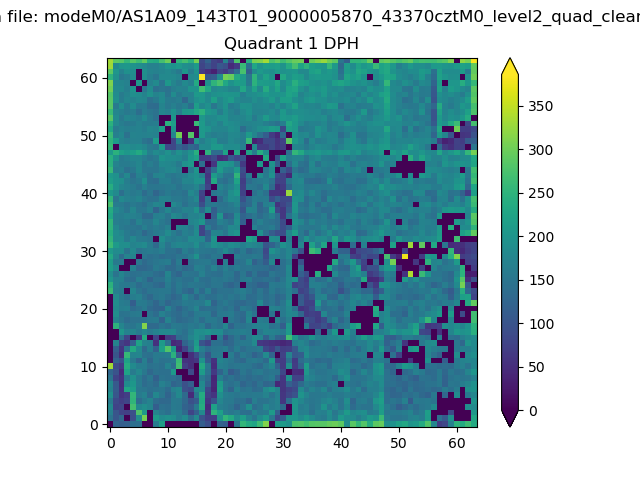 |
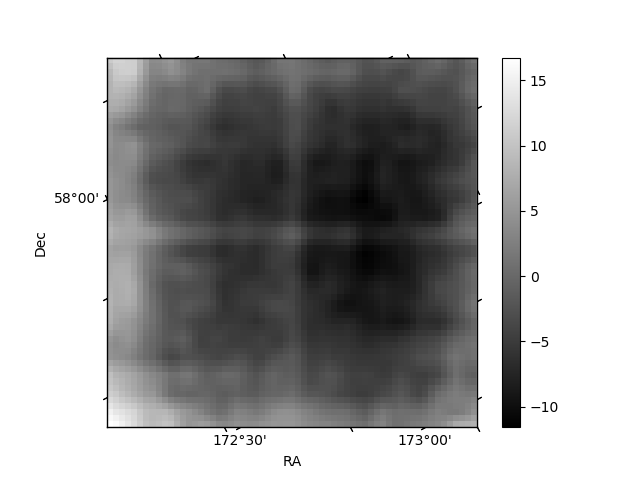
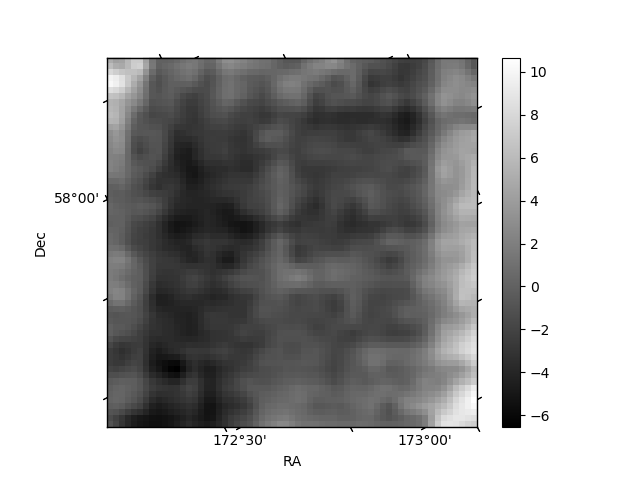
Quadrant B |
|---|---|---|---|
| Quadrant D | 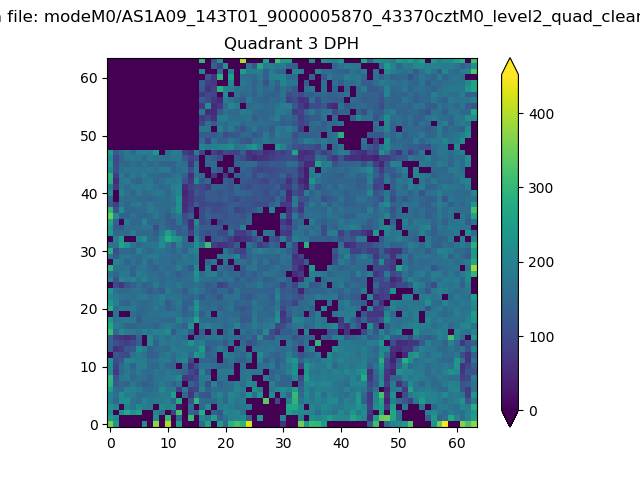 |
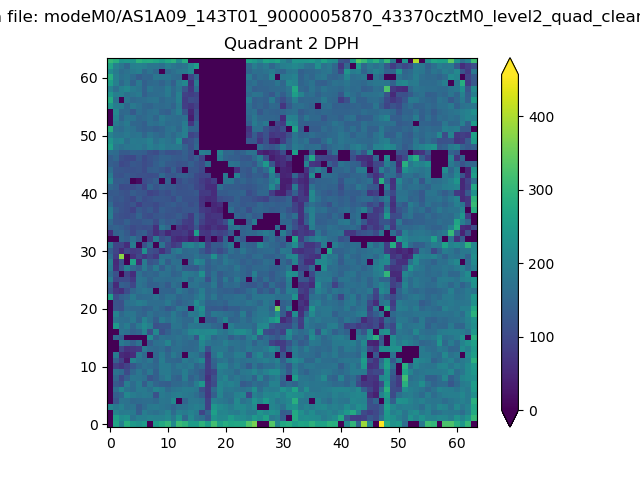 |
Quadrant C |
| Plot type | Count rate plots | Images |
|---|---|---|
| Comparison with Poisson distribution Blue bars denote a histogram of data divided into 1 sec bins. Red curve is a Poisson curve with rate = median count rate of data. |
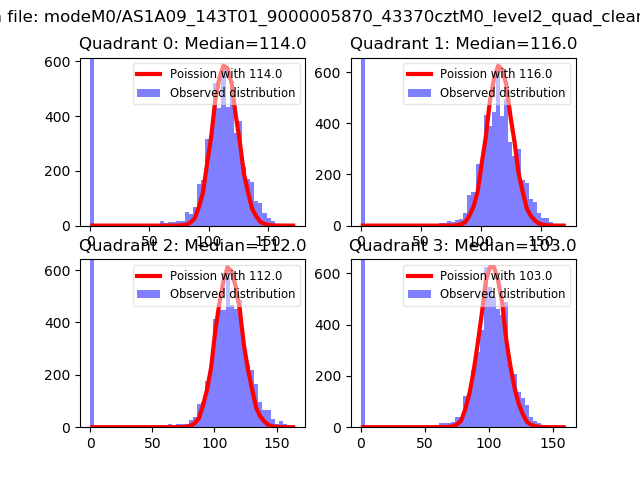 |
 |
| Quadrant-wise count rates Data is divided into 100 sec bins |
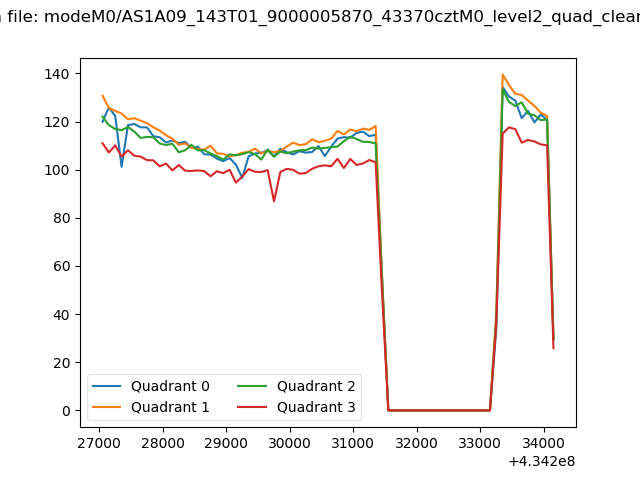 |
|
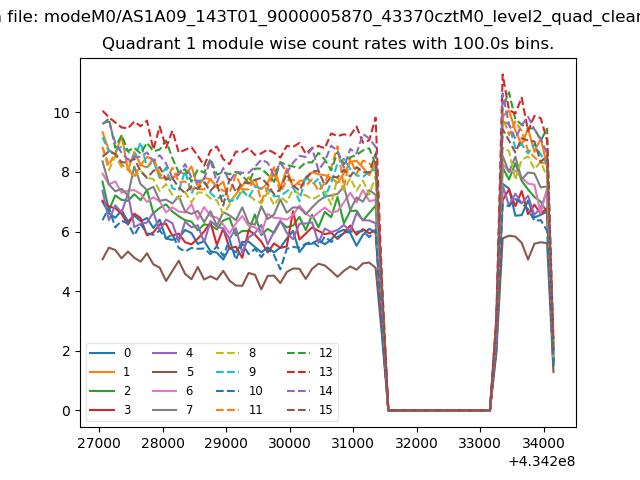
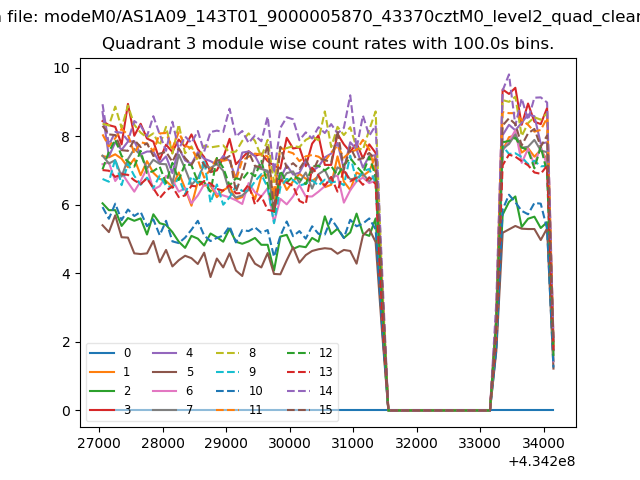
| Module-wise count rates for Quadrant A Data is divided into 100 sec bins |
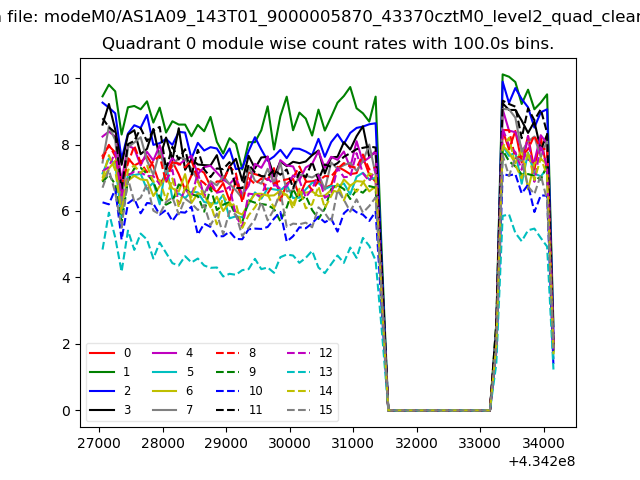 |
 |
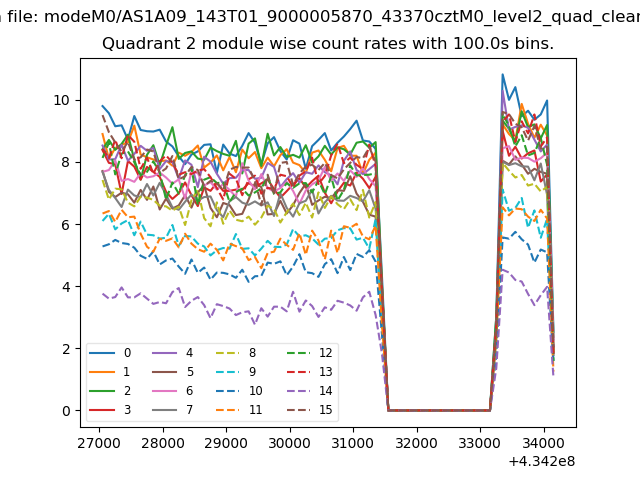
| Module-wise count rates for Quadrant B Data is divided into 100 sec bins |
 |
 |
| Module-wise count rates for Quadrant C Data is divided into 100 sec bins |
 |
 |
| Module-wise count rates for Quadrant D Data is divided into 100 sec bins |
 |
 |
| Parameter | Plot |
|---|---|
| CZT HV Monitor | 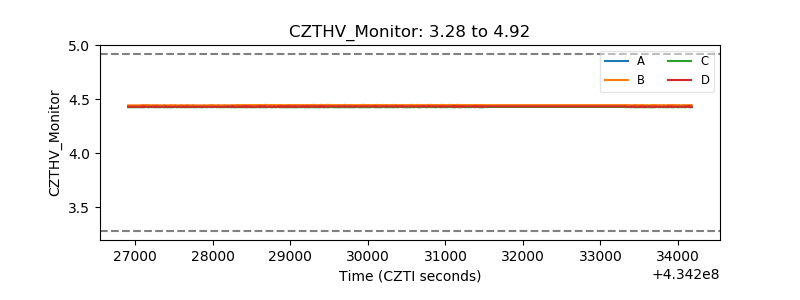 |
| D_VDD | 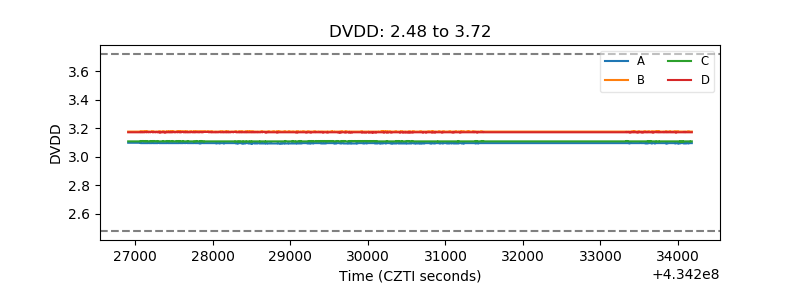 |
| Temperature 1 | 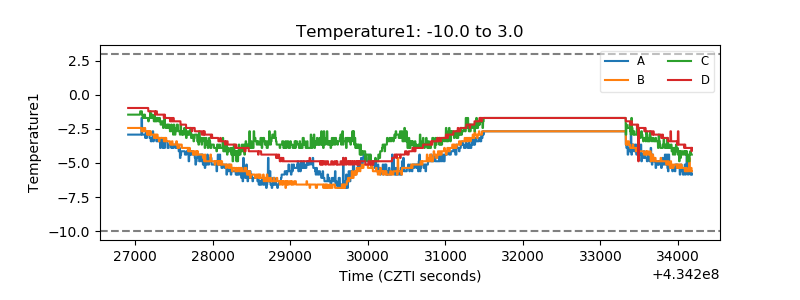 |
| Veto HV Monitor | 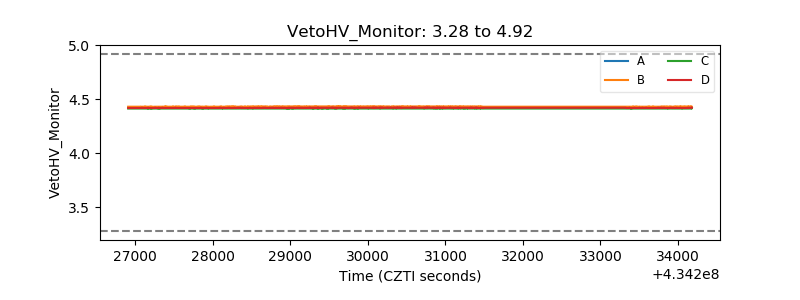 |
| Veto LLD | 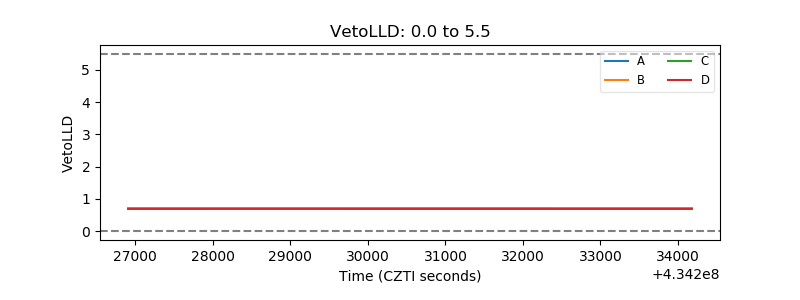 |
| Alpha Counter | 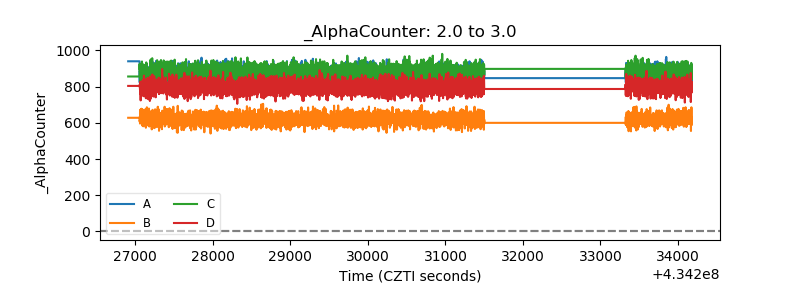 |
| _CPM_Rate | 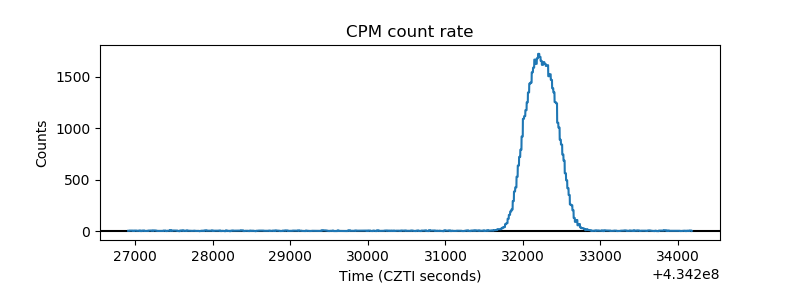 |
| CZT Counter | 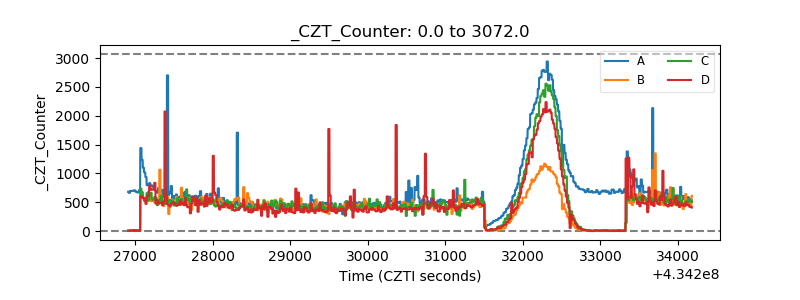 |
| +2.5 Volts monitor | 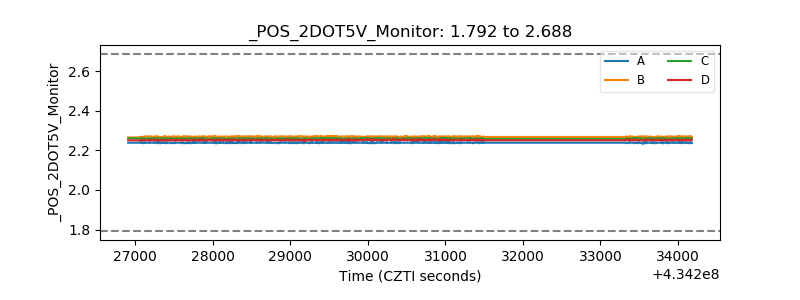 |
| +5 Volts monitor | 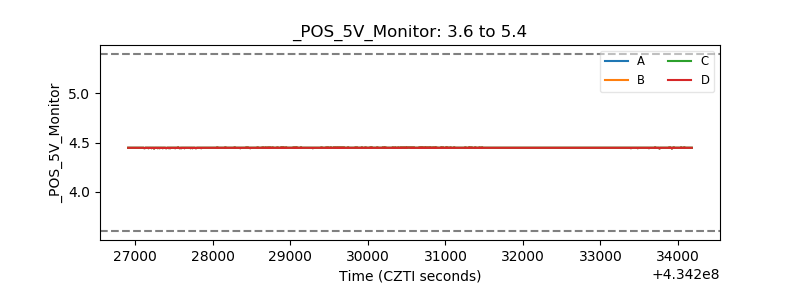 |
| _ROLL_ROT | 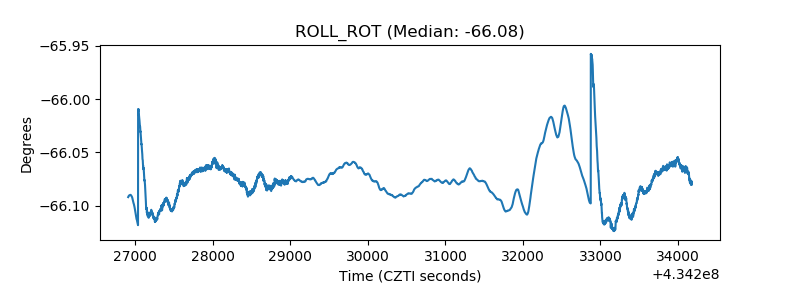 |
| _Roll_DEC | 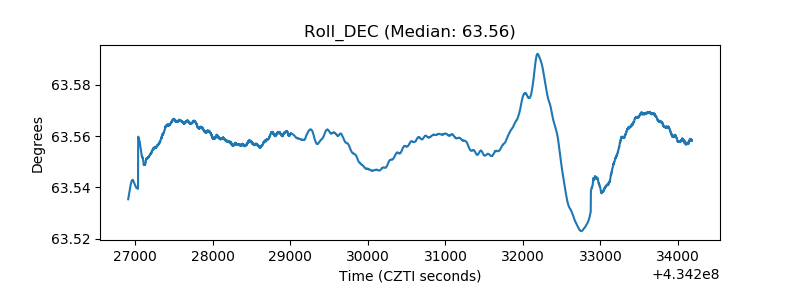 |
| _Roll_RA | 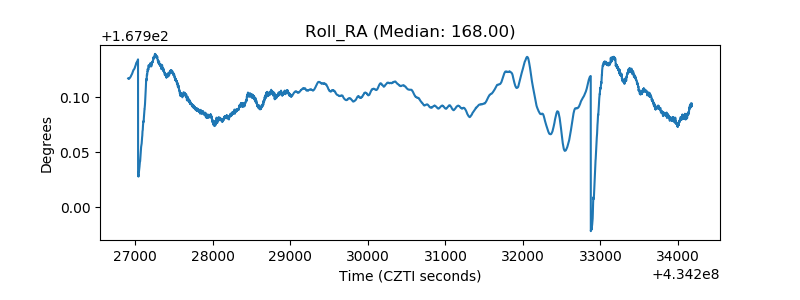 |
| Veto Counter | 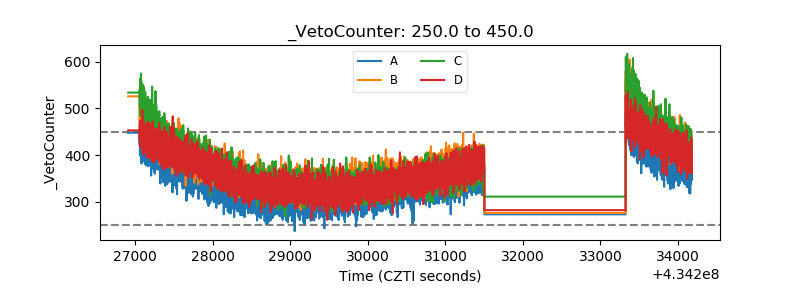 |