| Param | Original file | Final file |
|---|---|---|
| Filename | modeM0/AS1A09_143T01_9000005870_43371cztM0_level2.fits | modeM0/AS1A09_143T01_9000005870_43371cztM0_level2_quad_clean.evt |
| Size (bytes) | 287,818,560 | 88,934,400 |
| Size | 274.5 MB | 84.8 MB |
| Events in quadrant A | 2,931,992 | 590,676 |
| Events in quadrant B | 2,485,170 | 612,165 |
| Events in quadrant C | 2,498,905 | 592,878 |
| Events in quadrant D | 2,343,235 | 542,385 |
| Mode SS | |||
|---|---|---|---|
| Quadrant | BADHDUFLAG | Total packets | Discarded packets |
| A | 0 | 104 | 0 |
| B | 0 | 104 | 0 |
| C | 0 | 104 | 0 |
| D | 0 | 104 | 0 |
| Mode M9 | |||
|---|---|---|---|
| Quadrant | BADHDUFLAG | Total packets | Discarded packets |
| A | 0 | 25 | 0 |
| B | 0 | 26 | 0 |
| C | 0 | 26 | 0 |
| D | 0 | 26 | 0 |
| Mode M0 | |||
|---|---|---|---|
| Quadrant | BADHDUFLAG | Total packets | Discarded packets |
| A | 0 | 11827 | 2 |
| B | 0 | 10620 | 2 |
| C | 0 | 10574 | 2 |
| D | 0 | 10729 | 2 |
| Quadrant | Total seconds | Saturated seconds | Saturation percentage |
|---|---|---|---|
| A | 5061 | 70 | 1.383126% |
| B | 5061 | 10 | 0.197589% |
| C | 5061 | 20 | 0.395179% |
| D | 5060 | 23 | 0.454545% |
Noise dominated data is calculated using 1-second bins in cleaned event files. If a bin has >2000 counts, and if more than 50% of those come from <1% of pixels, then it is considered to be noise-dominated and hence unusable.
| Quadrant | # 1 sec bins | Bins with >0 counts | Bins with >2000 counts | High rate bins dominated by noise | Noise dominated (total time) | Noise dominated (detector-on time) | Marked lightcurve |
|---|---|---|---|---|---|---|---|
| A | 7003 | 5062 | 51 | 51 | 0.73% | 1.01% | 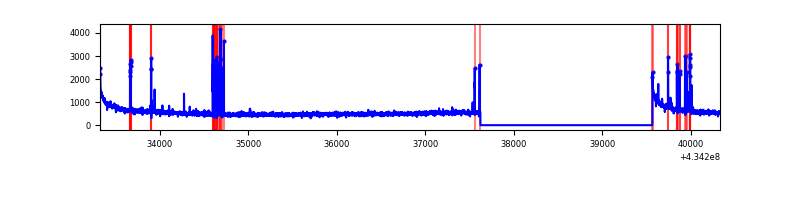 |
| B | 7003 | 5062 | 3 | 3 | 0.04% | 0.06% | 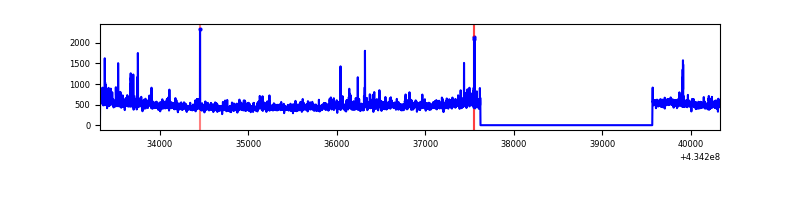 |
| C | 7003 | 5062 | 16 | 16 | 0.23% | 0.32% | 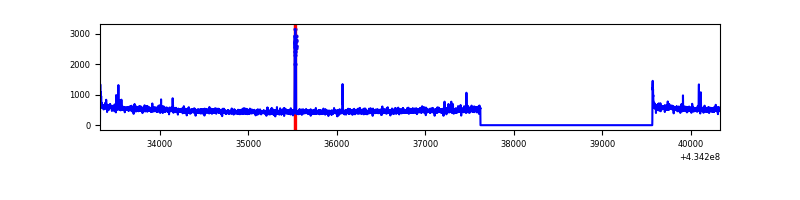 |
| D | 7002 | 5061 | 16 | 16 | 0.23% | 0.32% | 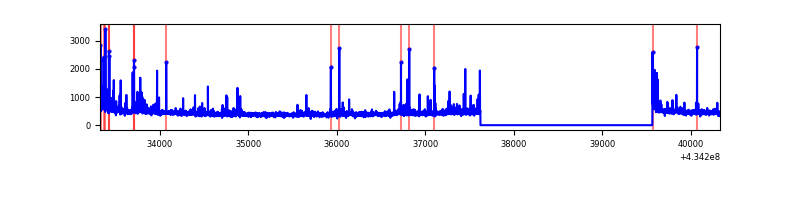 |
Top three noisy pixels from each quadrant. If the there are fewer than three noisy pixels in the level2.evt file, extra rows are filled as -1
| Pixel properties | Quadrant properties | ||||||
|---|---|---|---|---|---|---|---|
| Quadrant | DetID | PixID | Counts | Sigma | Mean | Median | Sigma |
| A | 10 | 83 | 550900 | 4736.25 | 563 | 550 | 116.2 |
| A | 15 | 237 | 176300 | 1512.48 | 563 | 550 | 116.2 |
| A | 13 | 6 | 12555 | 103.31 | 563 | 550 | 116.2 |
| B | 0 | 189 | 201253 | 1852.13 | 565 | 550 | 108.4 |
| B | 4 | 173 | 27135 | 245.33 | 565 | 550 | 108.4 |
| B | 3 | 112 | 18959 | 169.88 | 565 | 550 | 108.4 |
| C | 15 | 214 | 209719 | 1599.06 | 559 | 562 | 130.8 |
| C | 0 | 207 | 61144 | 463.16 | 559 | 562 | 130.8 |
| C | 3 | 233 | 37992 | 286.16 | 559 | 562 | 130.8 |
| D | 1 | 47 | 38007 | 280.63 | 553 | 538 | 133.5 |
| D | 12 | 233 | 34364 | 253.34 | 553 | 538 | 133.5 |
| D | 5 | 32 | 32191 | 237.07 | 553 | 538 | 133.5 |
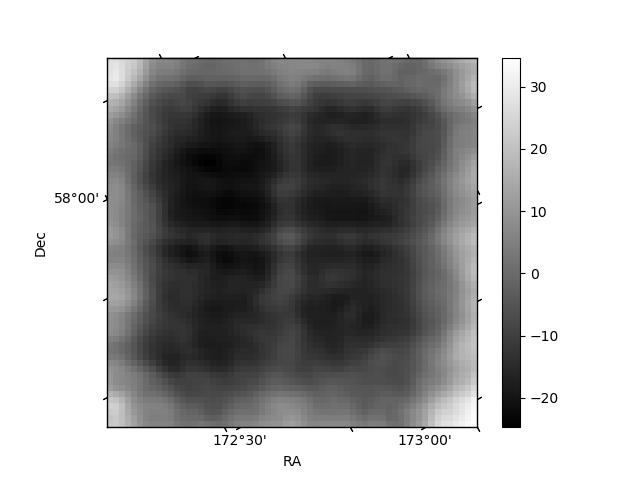
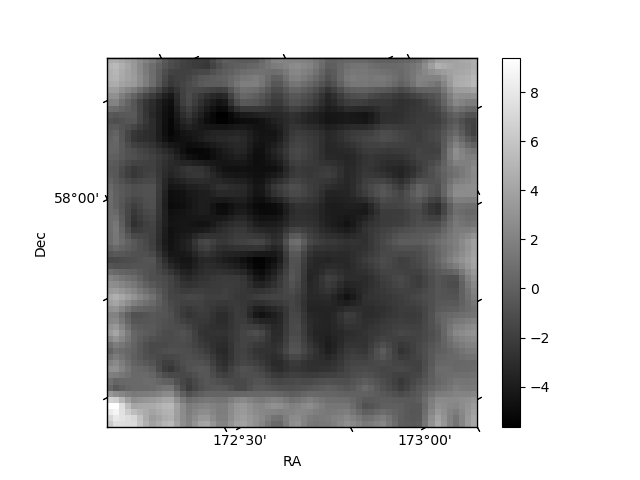
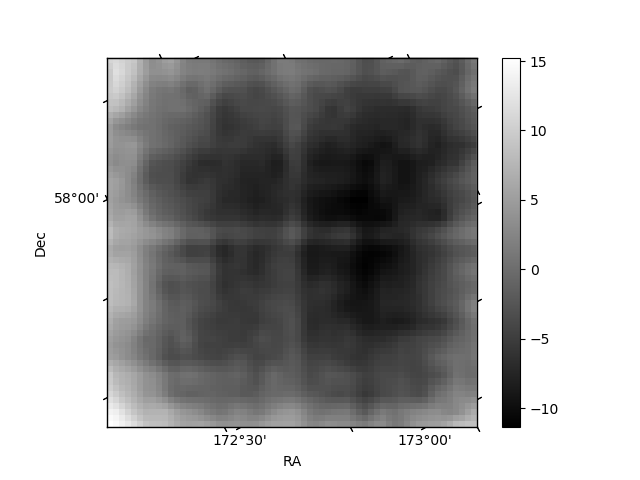
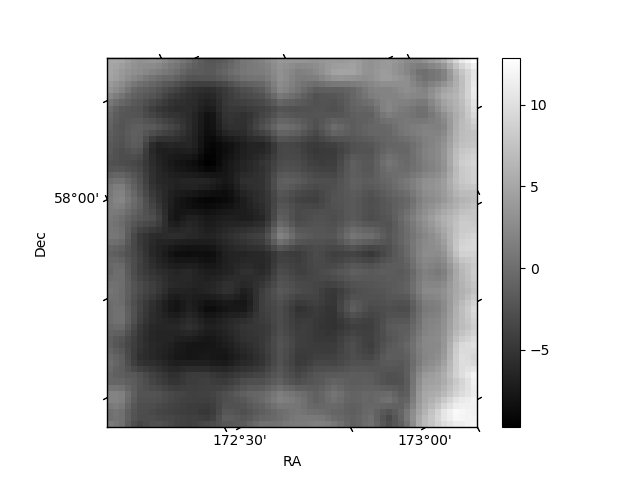
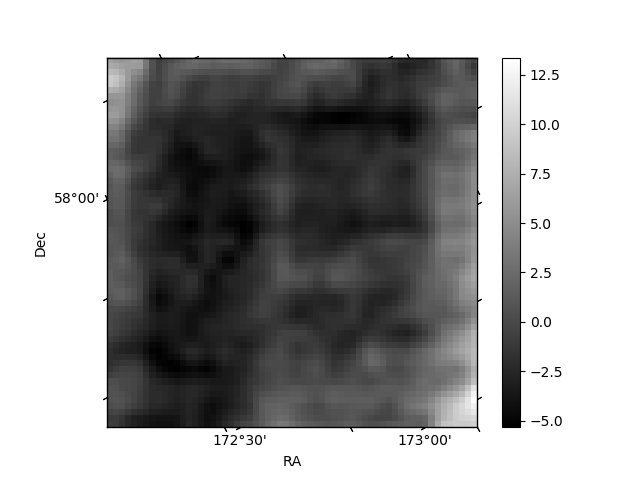
Histogram calculated using DETX and DETY for each event in the final _common_clean file
| Quadrant A | 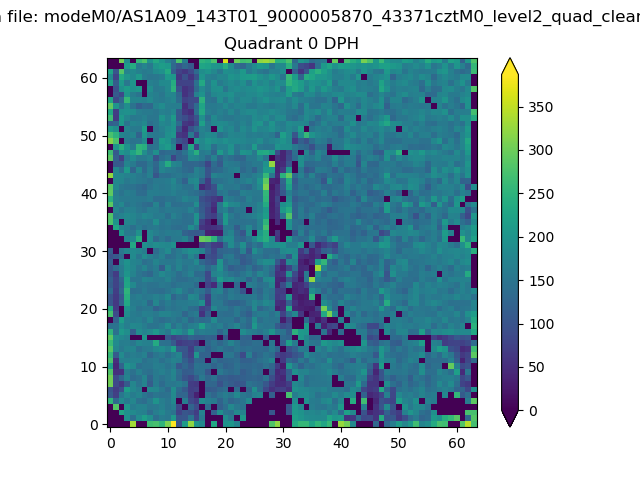 |
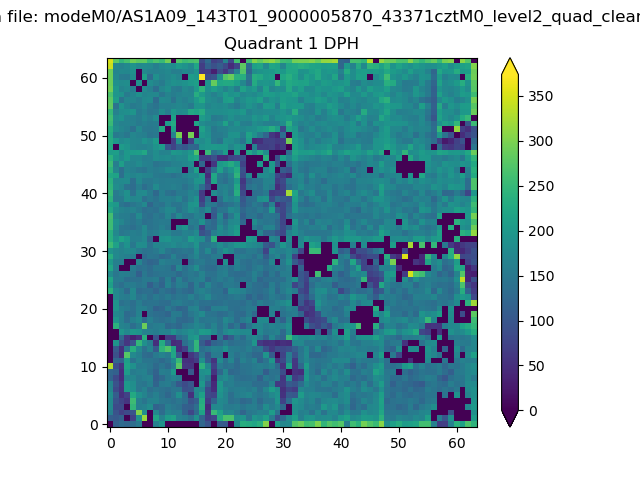 |
Quadrant B |
|---|---|---|---|
| Quadrant D | 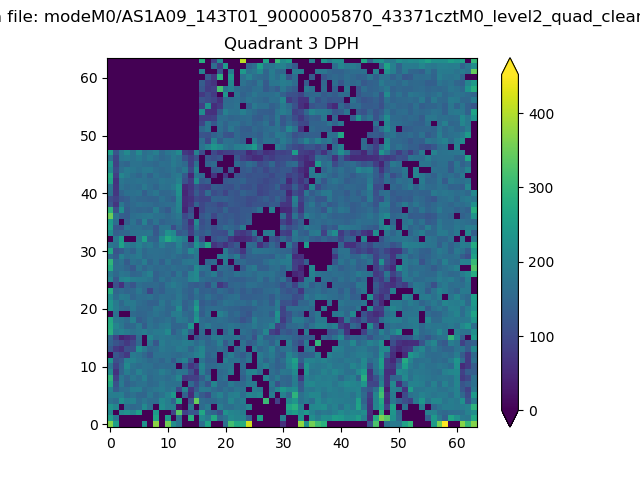 |
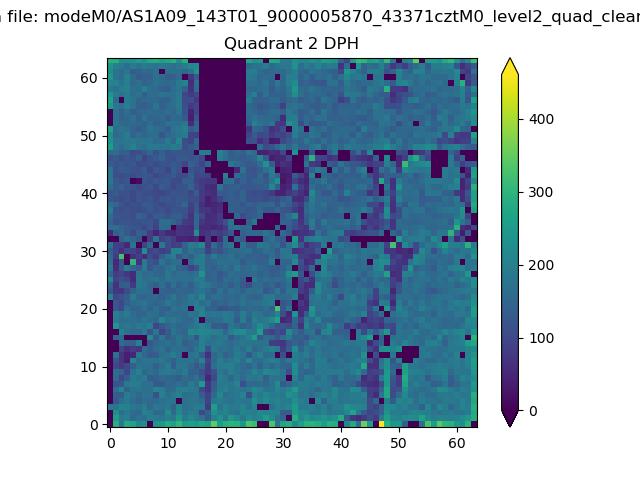 |
Quadrant C |
| Plot type | Count rate plots | Images |
|---|---|---|
| Comparison with Poisson distribution Blue bars denote a histogram of data divided into 1 sec bins. Red curve is a Poisson curve with rate = median count rate of data. |
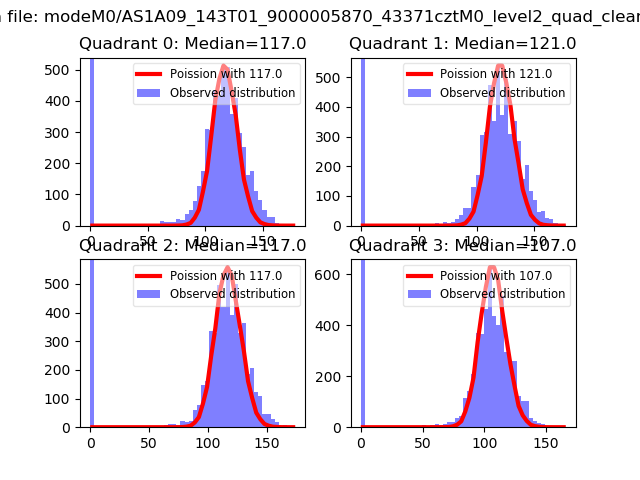 |
 |
| Quadrant-wise count rates Data is divided into 100 sec bins |
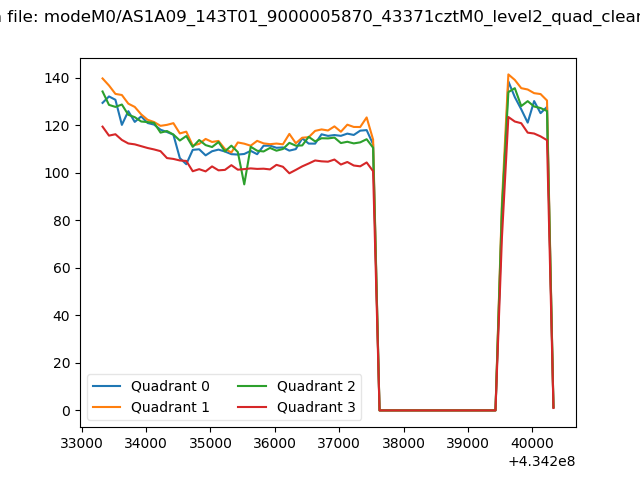 |
|
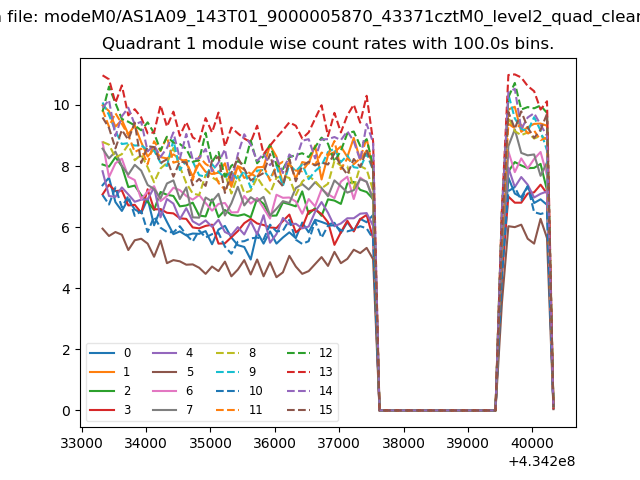
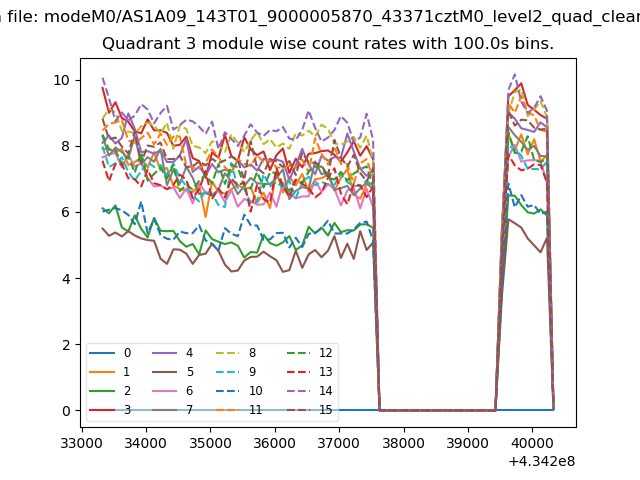
| Module-wise count rates for Quadrant A Data is divided into 100 sec bins |
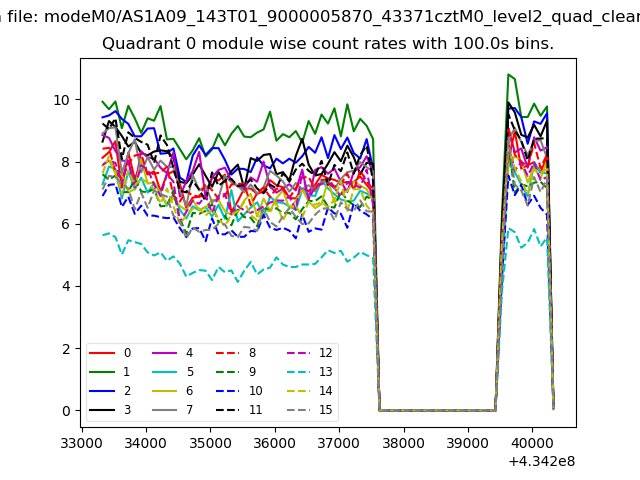 |
 |
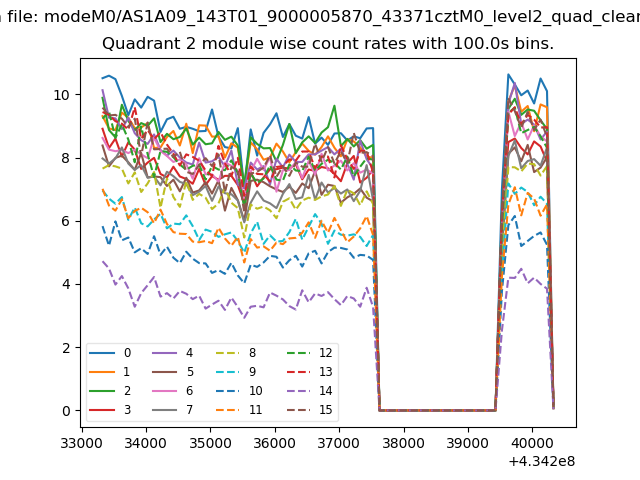
| Module-wise count rates for Quadrant B Data is divided into 100 sec bins |
 |
 |
| Module-wise count rates for Quadrant C Data is divided into 100 sec bins |
 |
 |
| Module-wise count rates for Quadrant D Data is divided into 100 sec bins |
 |
 |
| Parameter | Plot |
|---|---|
| CZT HV Monitor | 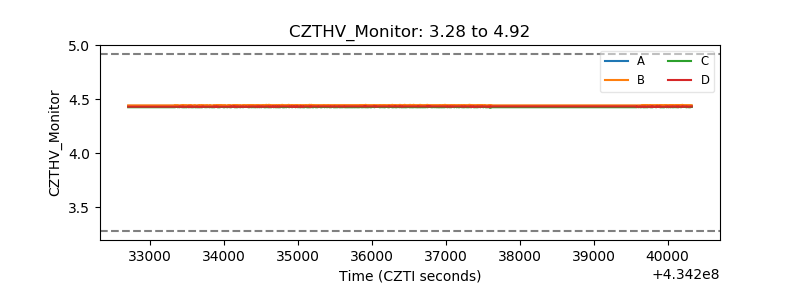 |
| D_VDD | 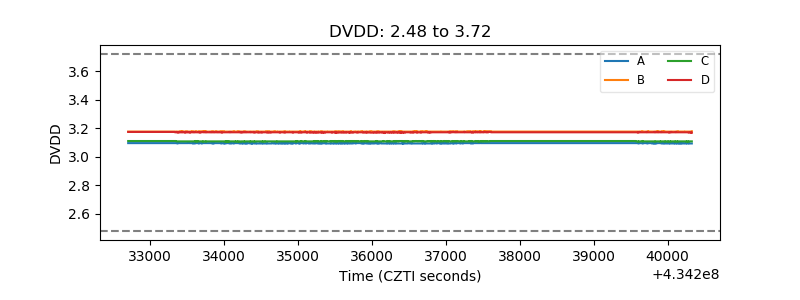 |
| Temperature 1 | 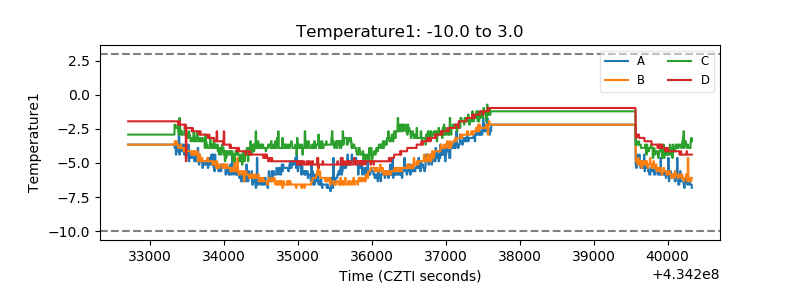 |
| Veto HV Monitor | 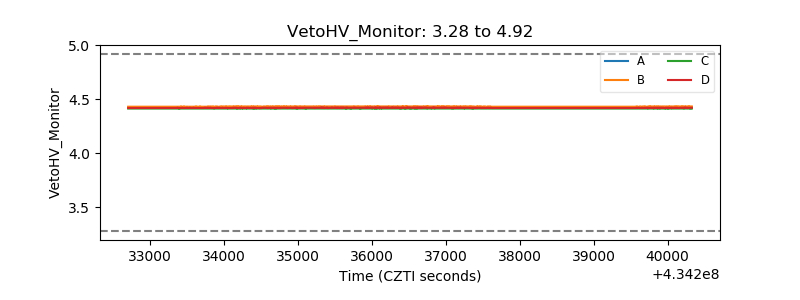 |
| Veto LLD | 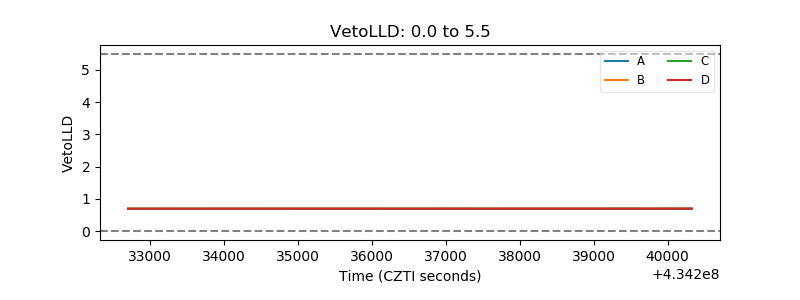 |
| Alpha Counter | 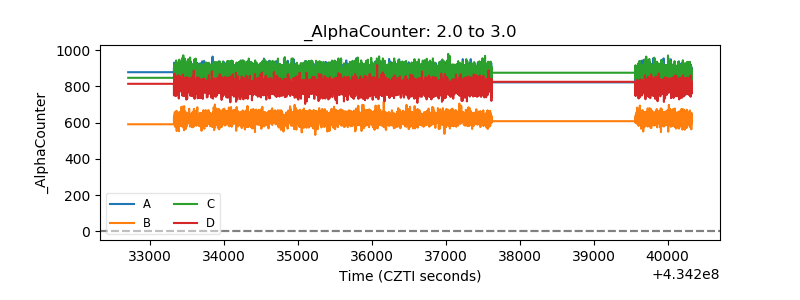 |
| _CPM_Rate | 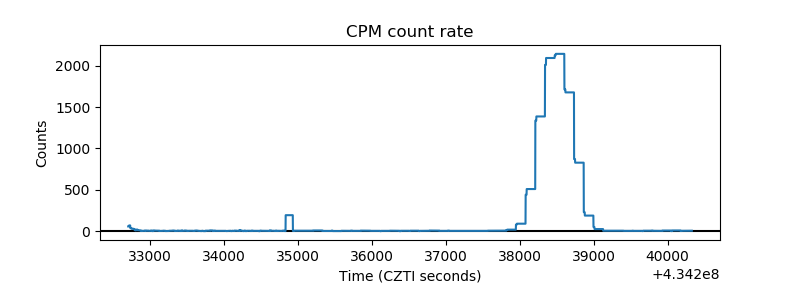 |
| CZT Counter | 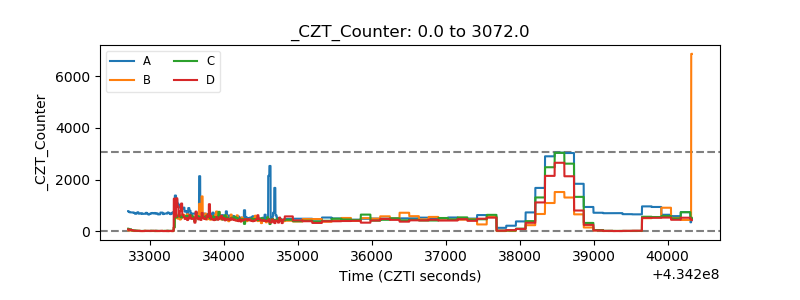 |
| +2.5 Volts monitor | 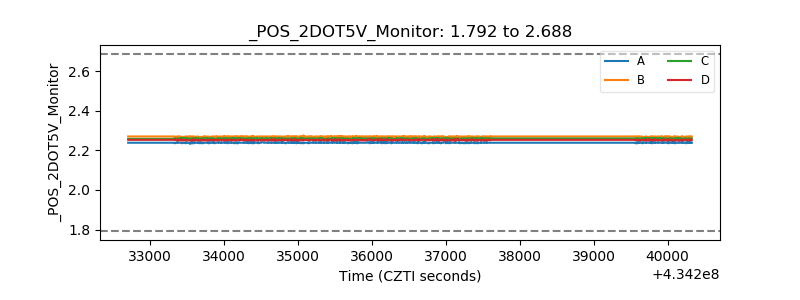 |
| +5 Volts monitor | 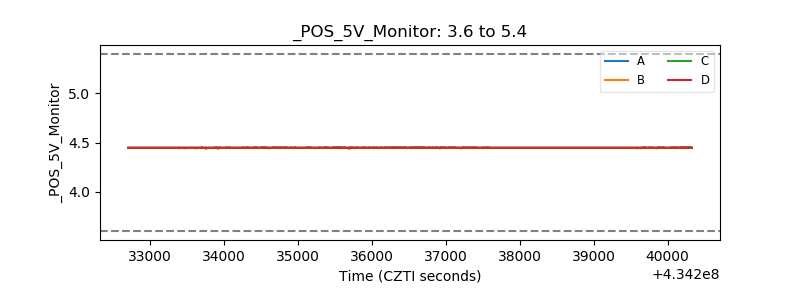 |
| _ROLL_ROT | 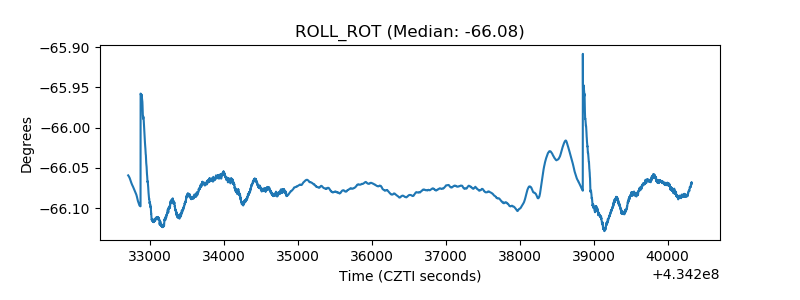 |
| _Roll_DEC | 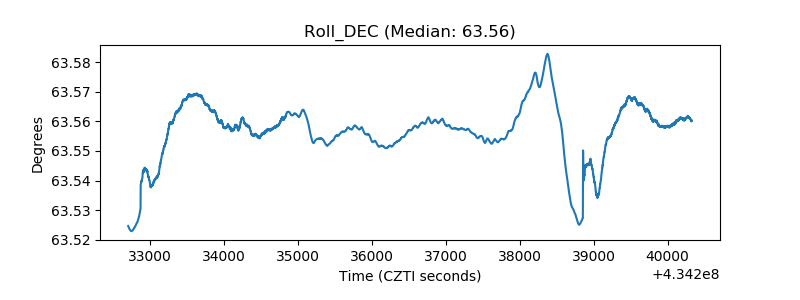 |
| _Roll_RA | 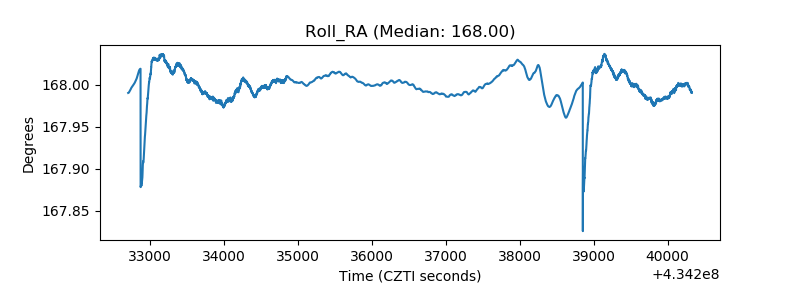 |
| Veto Counter | 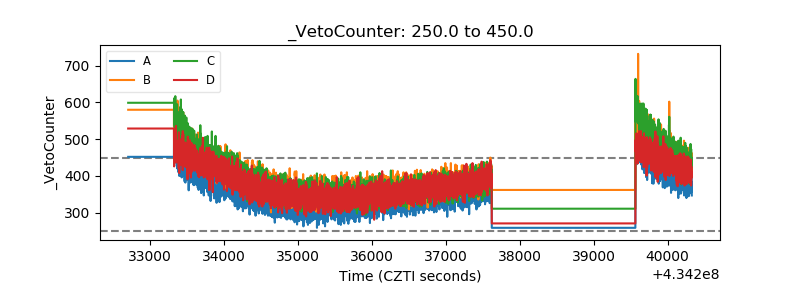 |