| Param | Original file | Final file |
|---|---|---|
| Filename | modeM0/AS1A09_143T01_9000005870_43372cztM0_level2.fits | modeM0/AS1A09_143T01_9000005870_43372cztM0_level2_quad_clean.evt |
| Size (bytes) | 287,487,360 | 89,015,040 |
| Size | 274.2 MB | 84.9 MB |
| Events in quadrant A | 2,823,736 | 594,046 |
| Events in quadrant B | 2,400,230 | 618,386 |
| Events in quadrant C | 2,460,932 | 594,969 |
| Events in quadrant D | 2,567,086 | 538,245 |
| Mode SS | |||
|---|---|---|---|
| Quadrant | BADHDUFLAG | Total packets | Discarded packets |
| A | 0 | 100 | 0 |
| B | 0 | 100 | 0 |
| C | 0 | 100 | 0 |
| D | 0 | 100 | 0 |
| Mode M9 | |||
|---|---|---|---|
| Quadrant | BADHDUFLAG | Total packets | Discarded packets |
| A | 0 | 29 | 0 |
| B | 0 | 30 | 0 |
| C | 0 | 30 | 0 |
| D | 0 | 30 | 0 |
| Mode M0 | |||
|---|---|---|---|
| Quadrant | BADHDUFLAG | Total packets | Discarded packets |
| A | 0 | 11445 | 2 |
| B | 0 | 10465 | 2 |
| C | 0 | 10243 | 2 |
| D | 0 | 11339 | 2 |
| Quadrant | Total seconds | Saturated seconds | Saturation percentage |
|---|---|---|---|
| A | 4997 | 45 | 0.900540% |
| B | 4997 | 12 | 0.240144% |
| C | 4997 | 3 | 0.060036% |
| D | 4997 | 75 | 1.500901% |
Noise dominated data is calculated using 1-second bins in cleaned event files. If a bin has >2000 counts, and if more than 50% of those come from <1% of pixels, then it is considered to be noise-dominated and hence unusable.
| Quadrant | # 1 sec bins | Bins with >0 counts | Bins with >2000 counts | High rate bins dominated by noise | Noise dominated (total time) | Noise dominated (detector-on time) | Marked lightcurve |
|---|---|---|---|---|---|---|---|
| A | 7030 | 4998 | 27 | 27 | 0.38% | 0.54% | 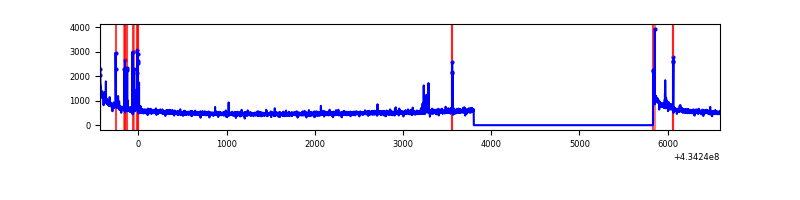 |
| B | 7030 | 4998 | 6 | 6 | 0.09% | 0.12% | 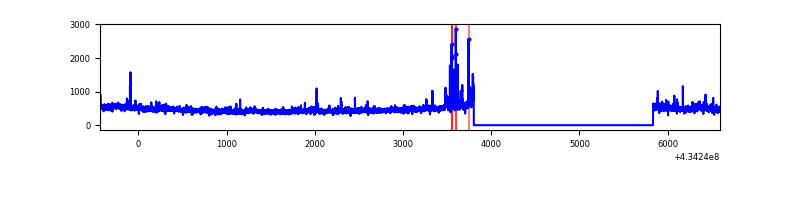 |
| C | 7030 | 4998 | 0 | 0 | 0.00% | 0.00% | 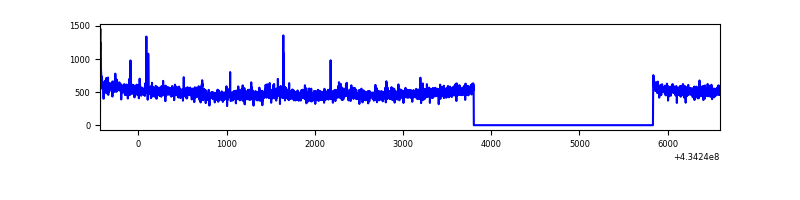 |
| D | 7030 | 4998 | 66 | 66 | 0.94% | 1.32% | 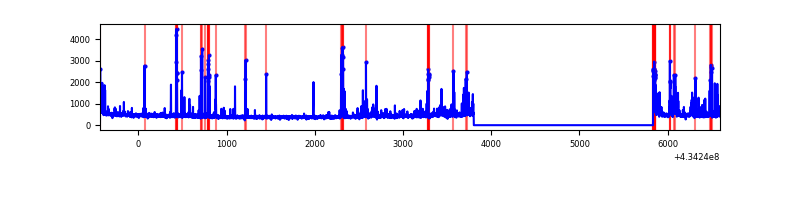 |
Top three noisy pixels from each quadrant. If the there are fewer than three noisy pixels in the level2.evt file, extra rows are filled as -1
| Pixel properties | Quadrant properties | ||||||
|---|---|---|---|---|---|---|---|
| Quadrant | DetID | PixID | Counts | Sigma | Mean | Median | Sigma |
| A | 10 | 83 | 542407 | 4724.58 | 559 | 549 | 114.7 |
| A | 15 | 237 | 105098 | 911.59 | 559 | 549 | 114.7 |
| A | 13 | 6 | 9479 | 77.86 | 559 | 549 | 114.7 |
| B | 0 | 189 | 121452 | 1117.03 | 561 | 545 | 108.2 |
| B | 3 | 112 | 31664 | 287.5 | 561 | 545 | 108.2 |
| B | 4 | 173 | 13454 | 119.26 | 561 | 545 | 108.2 |
| C | 15 | 214 | 205505 | 1586.29 | 552 | 555 | 129.2 |
| C | 3 | 233 | 83232 | 639.91 | 552 | 555 | 129.2 |
| C | 0 | 207 | 13373 | 99.21 | 552 | 555 | 129.2 |
| D | 12 | 6 | 186638 | 1438.06 | 541 | 527 | 129.4 |
| D | 12 | 218 | 156121 | 1202.26 | 541 | 527 | 129.4 |
| D | 13 | 249 | 80961 | 621.51 | 541 | 527 | 129.4 |
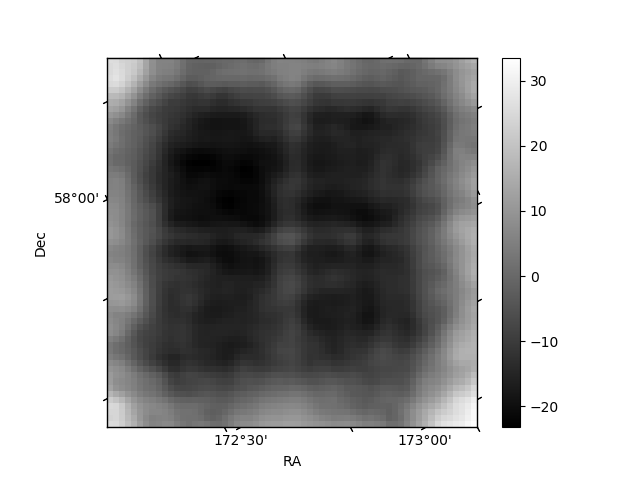
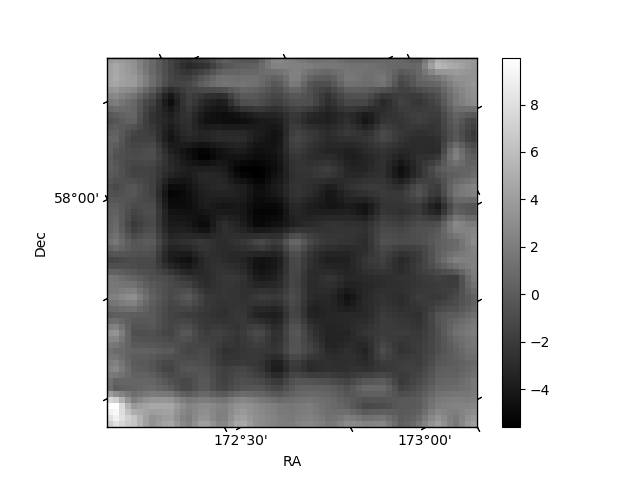
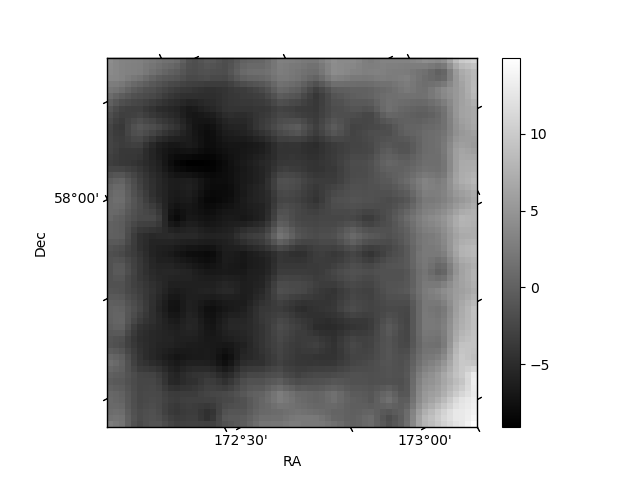
Histogram calculated using DETX and DETY for each event in the final _common_clean file
| Quadrant A | 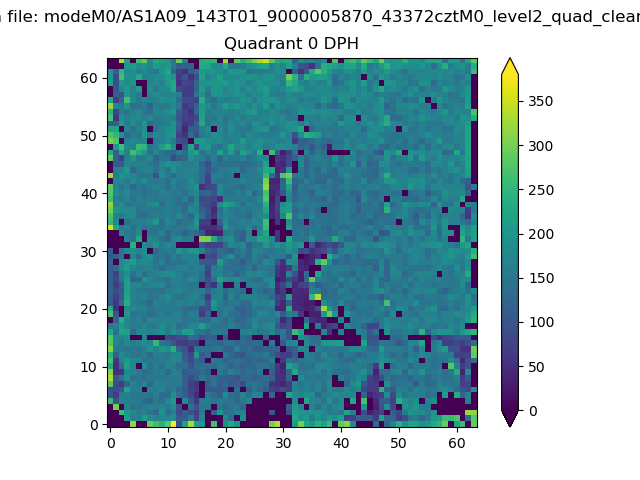 |
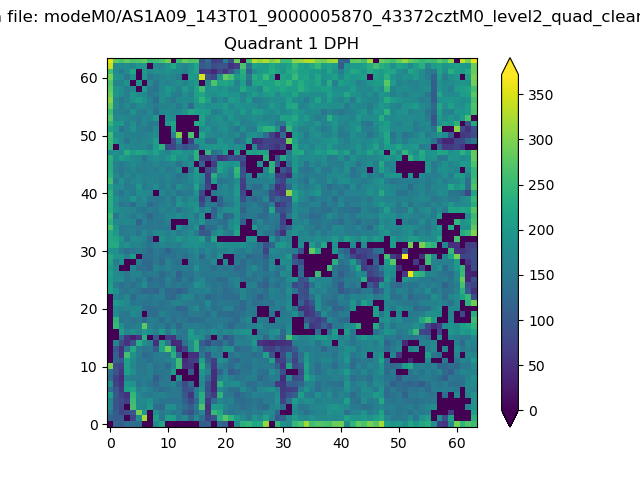 |
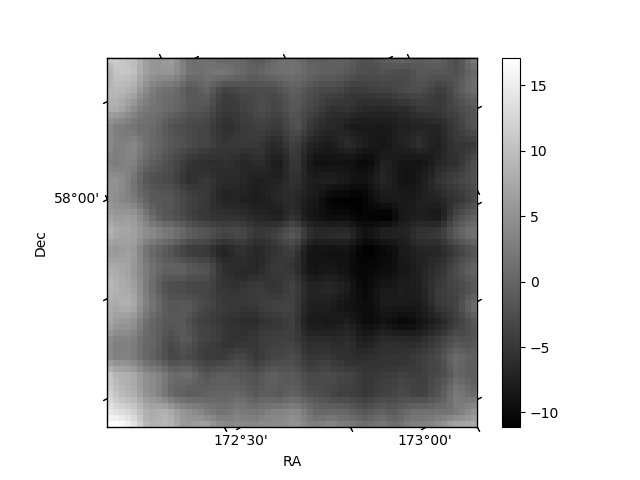
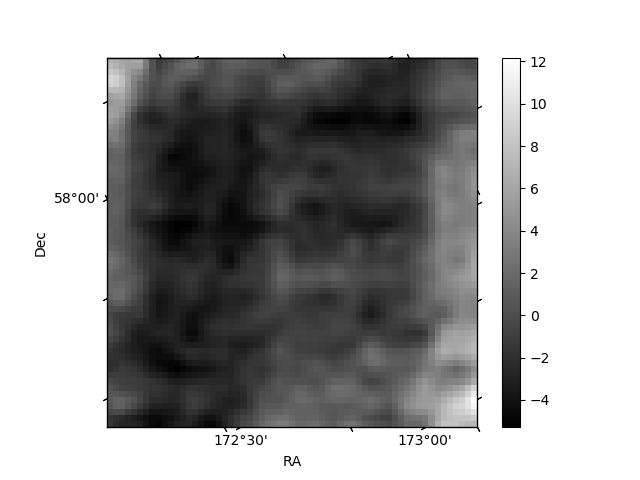
Quadrant B |
|---|---|---|---|
| Quadrant D | 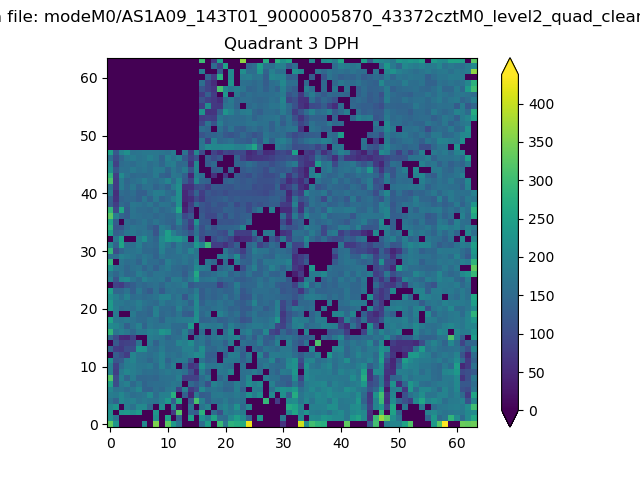 |
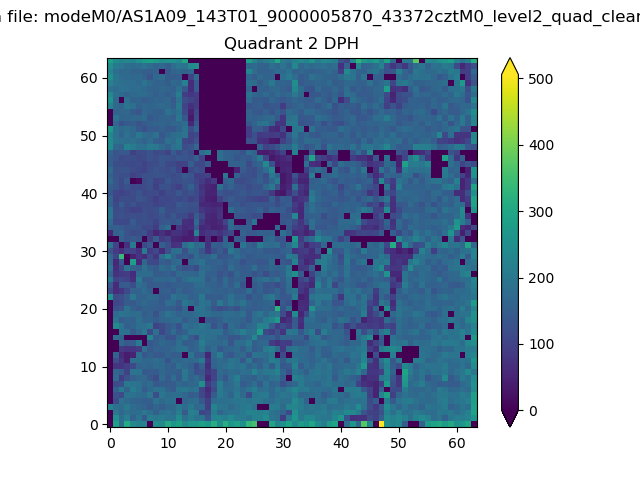 |
Quadrant C |
| Plot type | Count rate plots | Images |
|---|---|---|
| Comparison with Poisson distribution Blue bars denote a histogram of data divided into 1 sec bins. Red curve is a Poisson curve with rate = median count rate of data. |
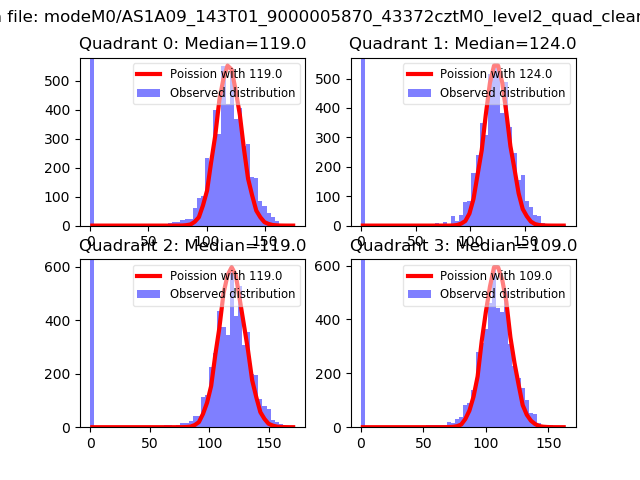 |
 |
| Quadrant-wise count rates Data is divided into 100 sec bins |
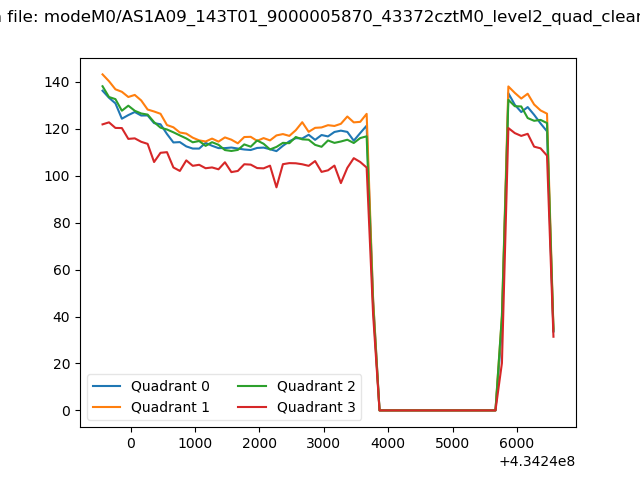 |
|
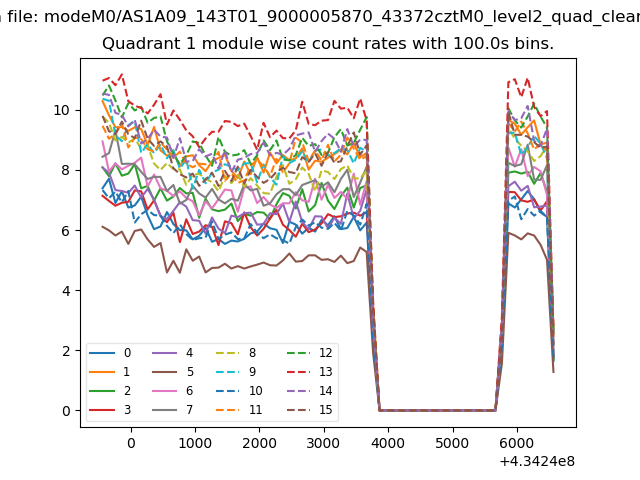
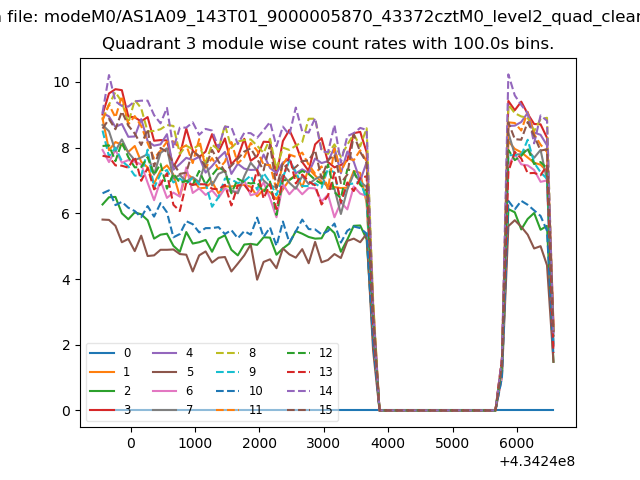
| Module-wise count rates for Quadrant A Data is divided into 100 sec bins |
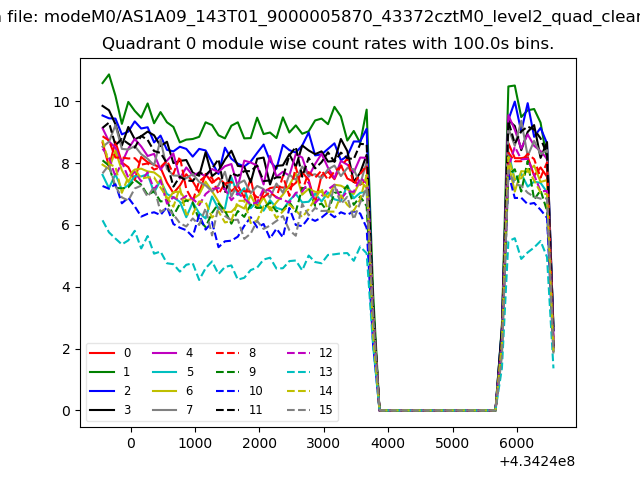 |
 |
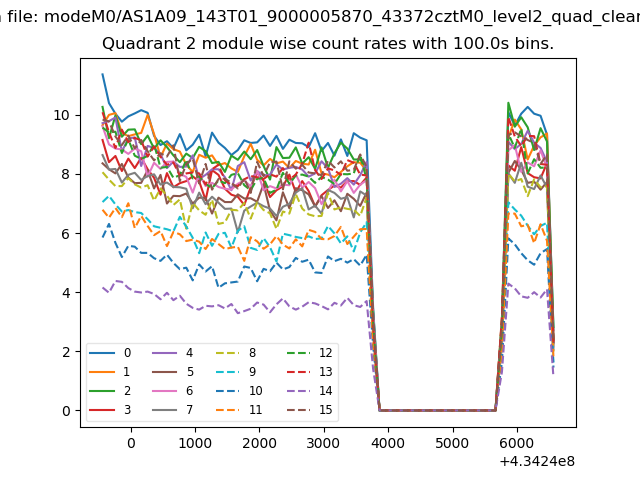
| Module-wise count rates for Quadrant B Data is divided into 100 sec bins |
 |
 |
| Module-wise count rates for Quadrant C Data is divided into 100 sec bins |
 |
 |
| Module-wise count rates for Quadrant D Data is divided into 100 sec bins |
 |
 |
| Parameter | Plot |
|---|---|
| CZT HV Monitor | 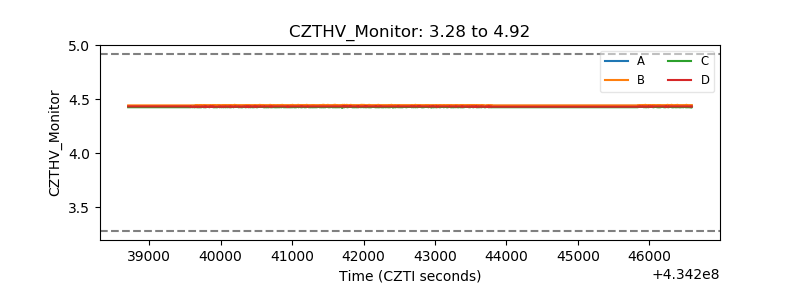 |
| D_VDD | 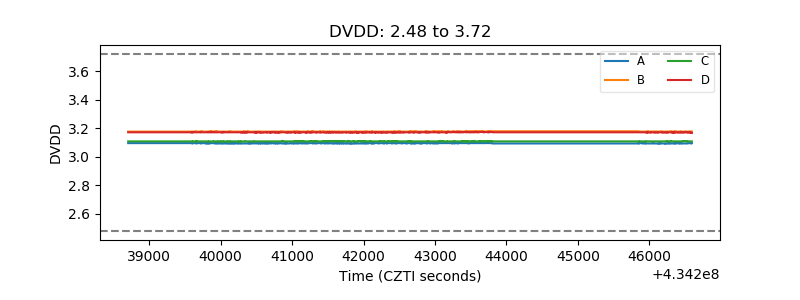 |
| Temperature 1 | 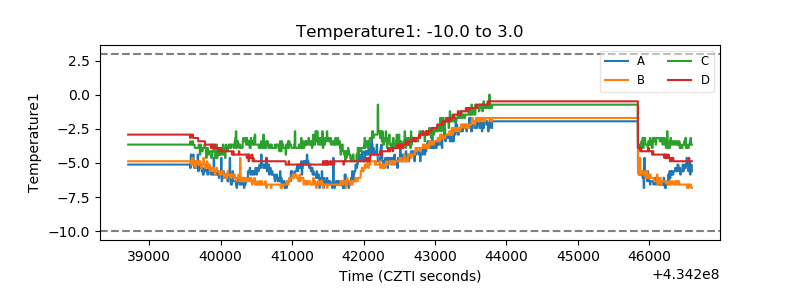 |
| Veto HV Monitor | 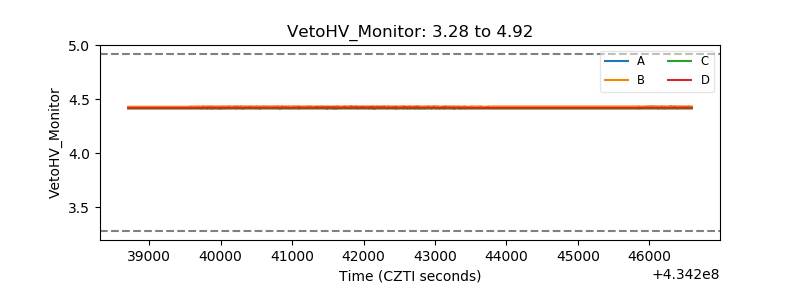 |
| Veto LLD | 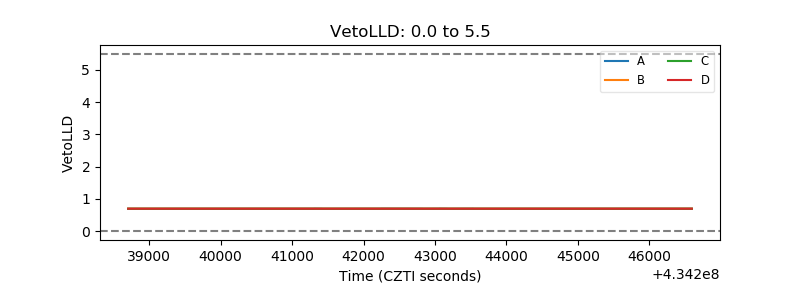 |
| Alpha Counter | 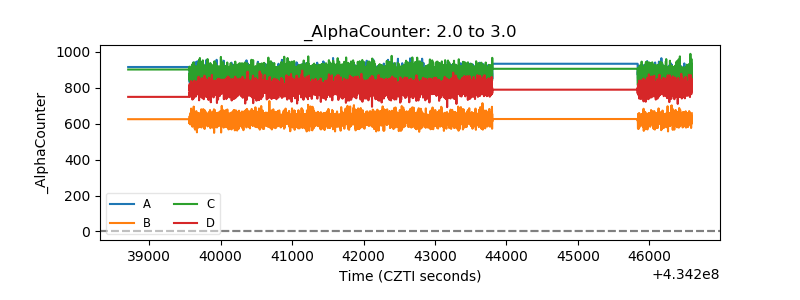 |
| _CPM_Rate | 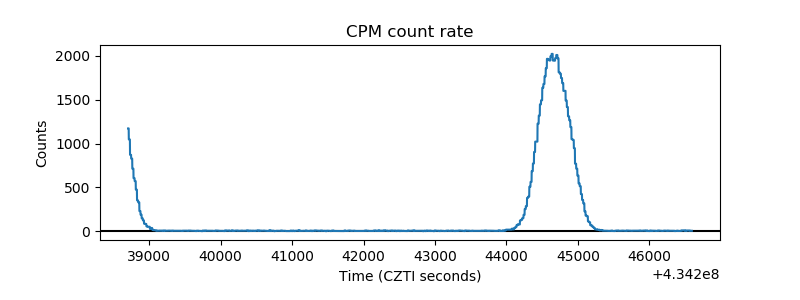 |
| CZT Counter | 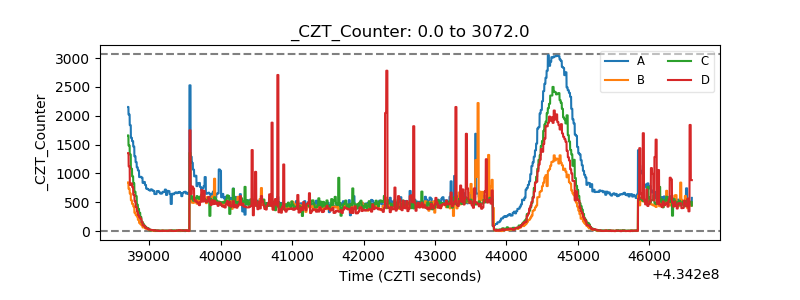 |
| +2.5 Volts monitor | 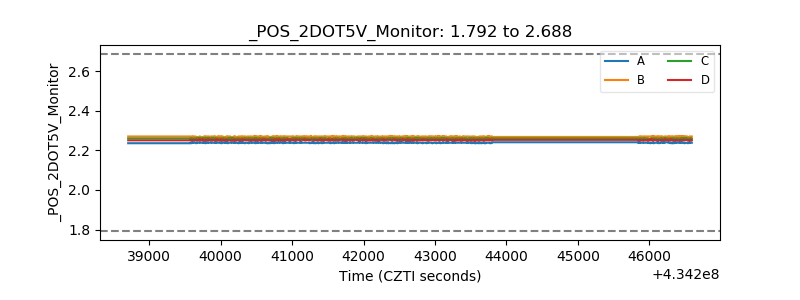 |
| +5 Volts monitor | 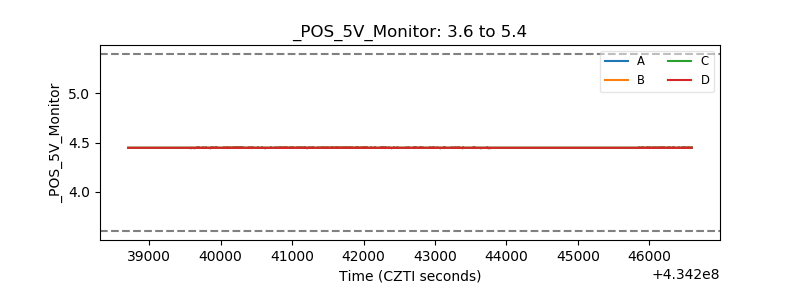 |
| _ROLL_ROT | 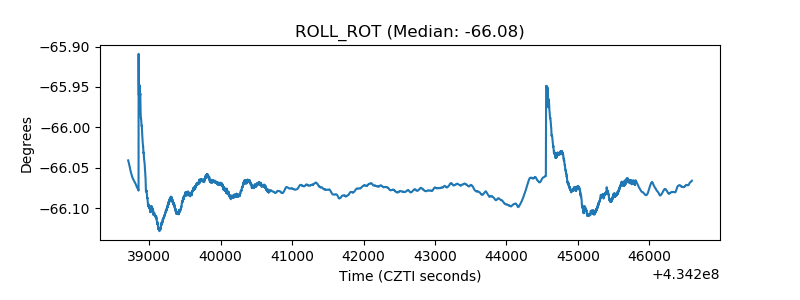 |
| _Roll_DEC | 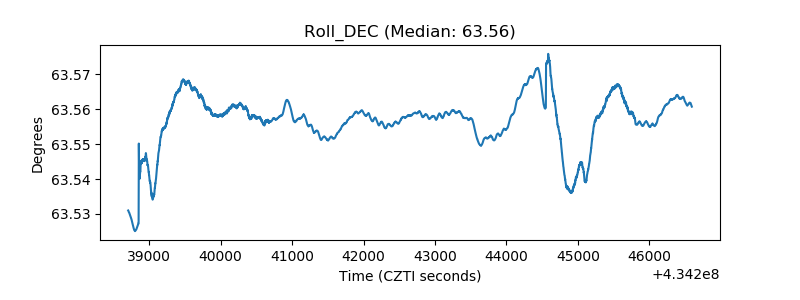 |
| _Roll_RA | 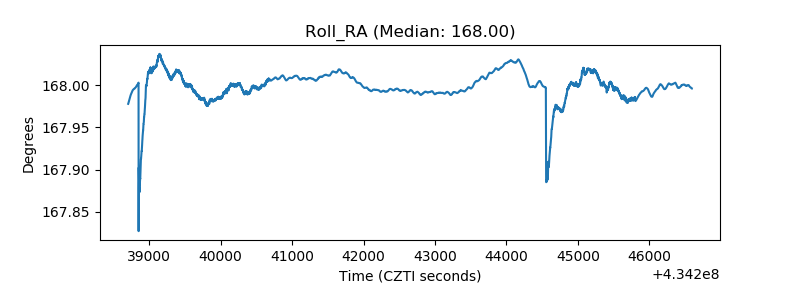 |
| Veto Counter | 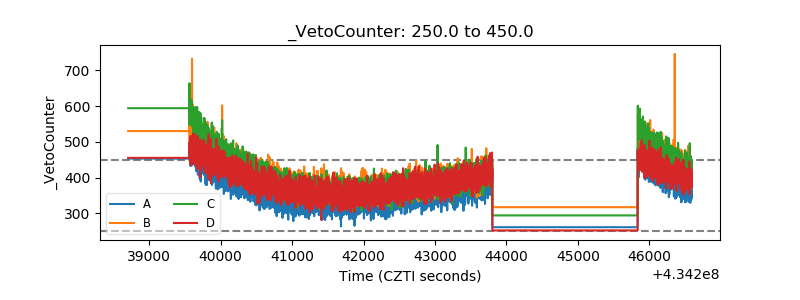 |