| Param | Original file | Final file |
|---|---|---|
| Filename | modeM0/AS1A09_143T01_9000005870_43374cztM0_level2.fits | modeM0/AS1A09_143T01_9000005870_43374cztM0_level2_quad_clean.evt |
| Size (bytes) | 281,111,040 | 86,244,480 |
| Size | 268.1 MB | 82.2 MB |
| Events in quadrant A | 2,986,671 | 571,286 |
| Events in quadrant B | 2,288,898 | 597,920 |
| Events in quadrant C | 2,379,742 | 569,474 |
| Events in quadrant D | 2,352,802 | 515,277 |
| Mode SS | |||
|---|---|---|---|
| Quadrant | BADHDUFLAG | Total packets | Discarded packets |
| A | 0 | 106 | 0 |
| B | 0 | 106 | 0 |
| C | 0 | 106 | 0 |
| D | 0 | 106 | 0 |
| Mode M9 | |||
|---|---|---|---|
| Quadrant | BADHDUFLAG | Total packets | Discarded packets |
| A | 0 | 24 | 0 |
| B | 0 | 25 | 0 |
| C | 0 | 25 | 0 |
| D | 0 | 25 | 0 |
| Mode M0 | |||
|---|---|---|---|
| Quadrant | BADHDUFLAG | Total packets | Discarded packets |
| A | 0 | 12107 | 2 |
| B | 0 | 10382 | 2 |
| C | 0 | 10386 | 2 |
| D | 0 | 11011 | 2 |
| Quadrant | Total seconds | Saturated seconds | Saturation percentage |
|---|---|---|---|
| A | 5096 | 69 | 1.354003% |
| B | 5096 | 12 | 0.235479% |
| C | 5095 | 9 | 0.176644% |
| D | 5095 | 47 | 0.922473% |
Noise dominated data is calculated using 1-second bins in cleaned event files. If a bin has >2000 counts, and if more than 50% of those come from <1% of pixels, then it is considered to be noise-dominated and hence unusable.
| Quadrant | # 1 sec bins | Bins with >0 counts | Bins with >2000 counts | High rate bins dominated by noise | Noise dominated (total time) | Noise dominated (detector-on time) | Marked lightcurve |
|---|---|---|---|---|---|---|---|
| A | 7218 | 5097 | 56 | 56 | 0.78% | 1.10% | 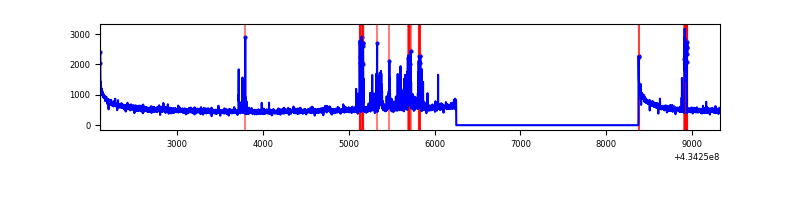 |
| B | 7218 | 5097 | 5 | 5 | 0.07% | 0.10% | 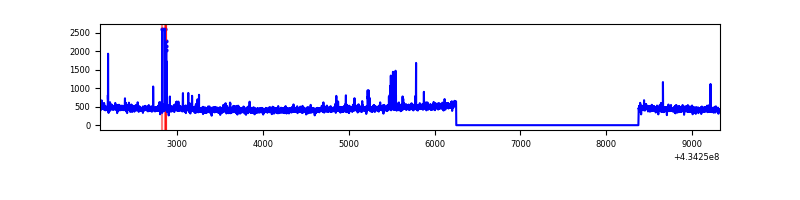 |
| C | 7217 | 5096 | 2 | 2 | 0.03% | 0.04% | 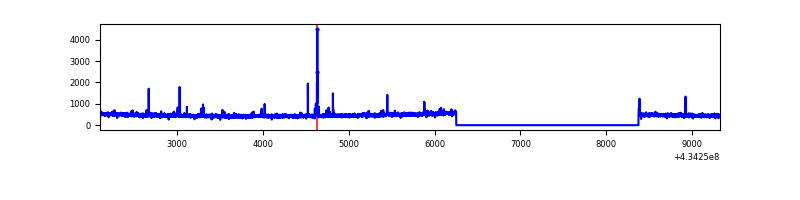 |
| D | 7217 | 5096 | 48 | 48 | 0.67% | 0.94% | 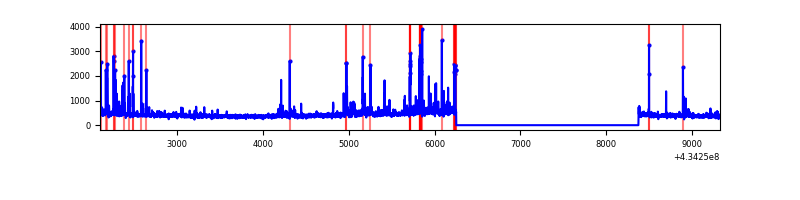 |
Top three noisy pixels from each quadrant. If the there are fewer than three noisy pixels in the level2.evt file, extra rows are filled as -1
| Pixel properties | Quadrant properties | ||||||
|---|---|---|---|---|---|---|---|
| Quadrant | DetID | PixID | Counts | Sigma | Mean | Median | Sigma |
| A | 10 | 83 | 556865 | 4932.58 | 546 | 535 | 112.8 |
| A | 13 | 248 | 250376 | 2215.16 | 546 | 535 | 112.8 |
| A | 15 | 237 | 50583 | 443.74 | 546 | 535 | 112.8 |
| B | 3 | 112 | 38919 | 362.69 | 550 | 536 | 105.8 |
| B | 5 | 255 | 31135 | 289.13 | 550 | 536 | 105.8 |
| B | 0 | 189 | 30461 | 282.76 | 550 | 536 | 105.8 |
| C | 15 | 214 | 210448 | 1701.43 | 534 | 538 | 123.4 |
| C | 3 | 233 | 35299 | 281.76 | 534 | 538 | 123.4 |
| C | 15 | 111 | 35188 | 280.86 | 534 | 538 | 123.4 |
| D | 13 | 249 | 82586 | 643.34 | 525 | 510 | 127.6 |
| D | 5 | 32 | 61786 | 480.3 | 525 | 510 | 127.6 |
| D | 12 | 6 | 54317 | 421.76 | 525 | 510 | 127.6 |
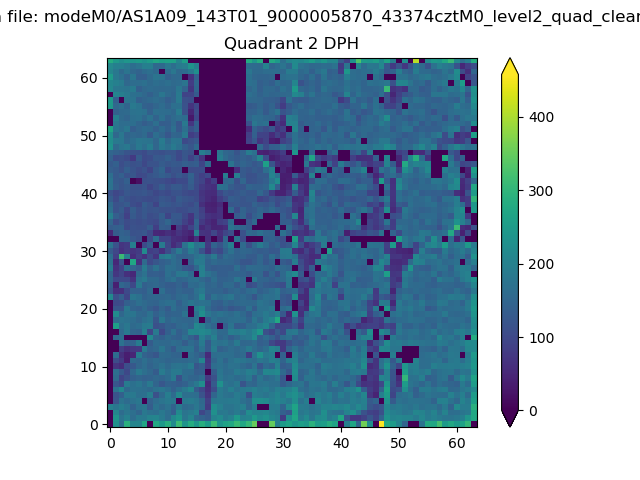
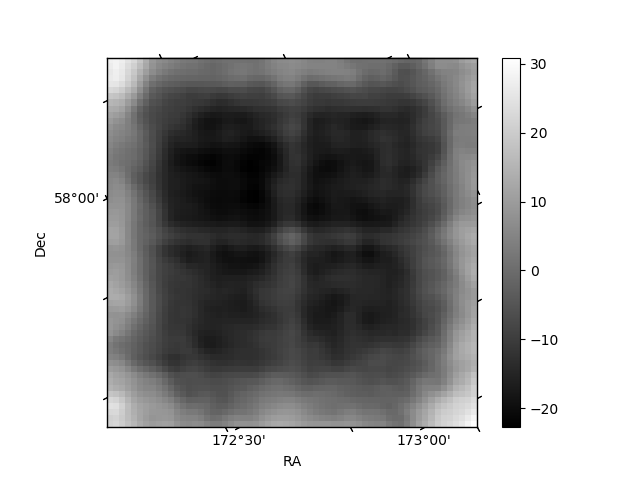
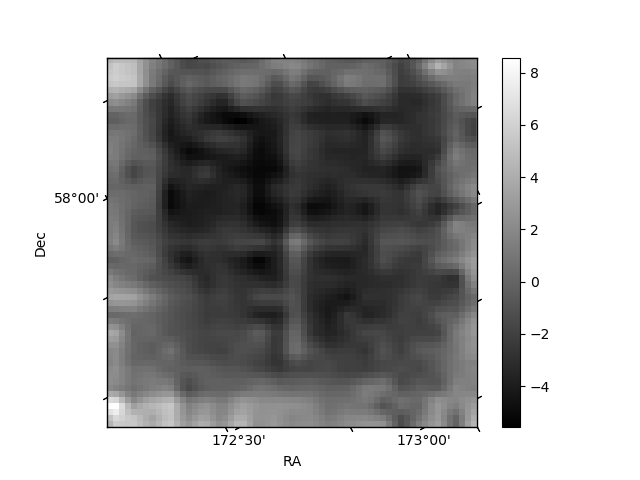
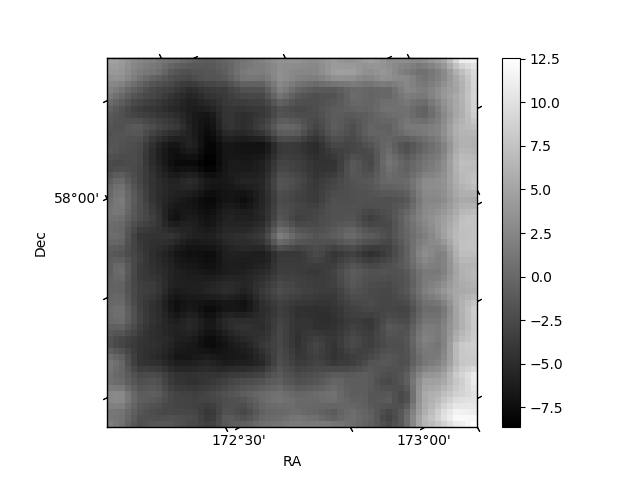
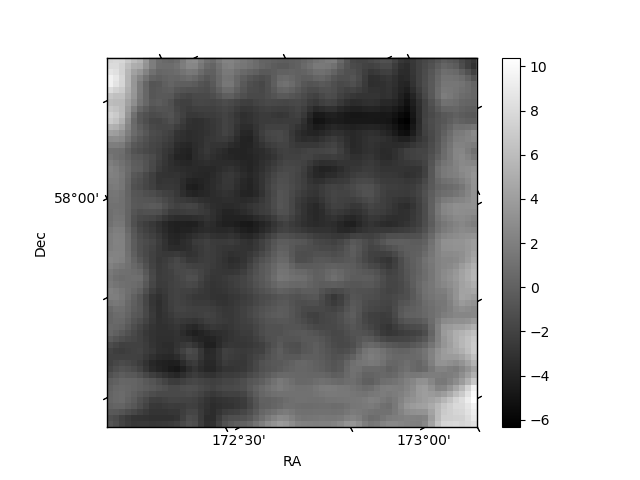
Histogram calculated using DETX and DETY for each event in the final _common_clean file
| Quadrant A | 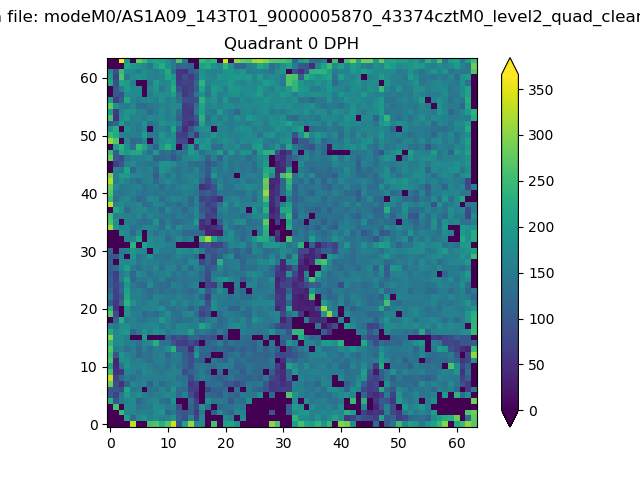 |
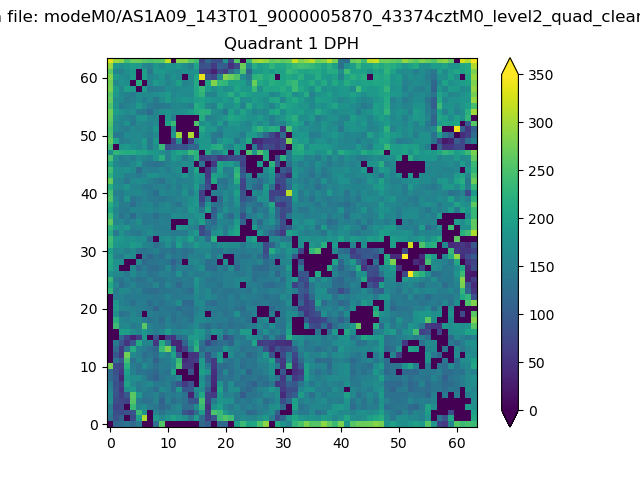 |
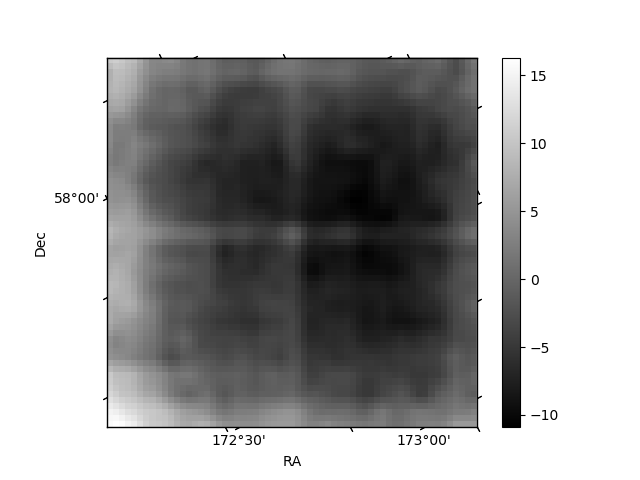
Quadrant B |
|---|---|---|---|
| Quadrant D | 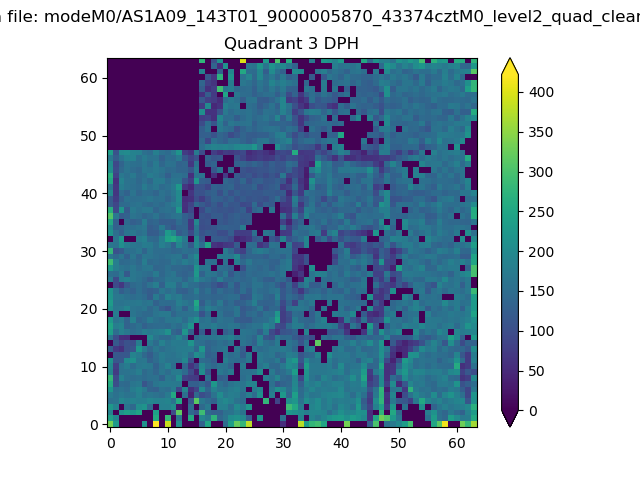 |
 |
Quadrant C |
| Plot type | Count rate plots | Images |
|---|---|---|
| Comparison with Poisson distribution Blue bars denote a histogram of data divided into 1 sec bins. Red curve is a Poisson curve with rate = median count rate of data. |
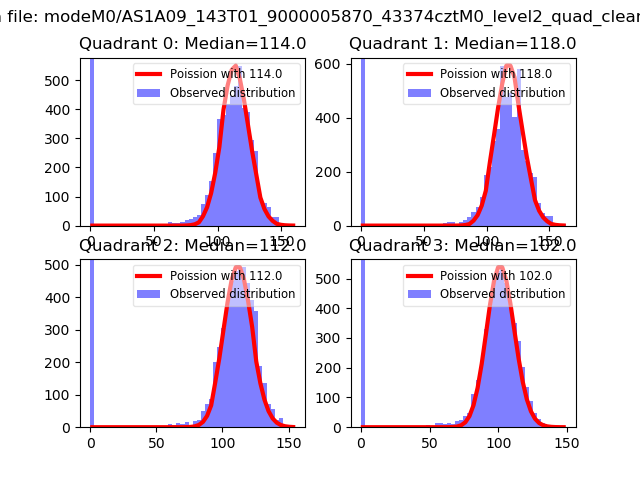 |
 |
| Quadrant-wise count rates Data is divided into 100 sec bins |
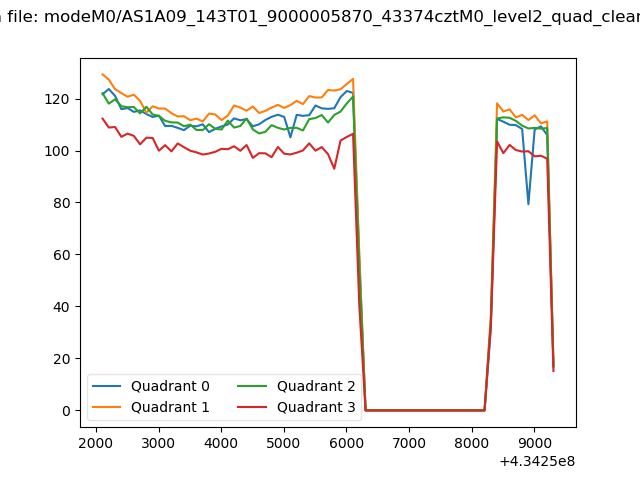 |
|
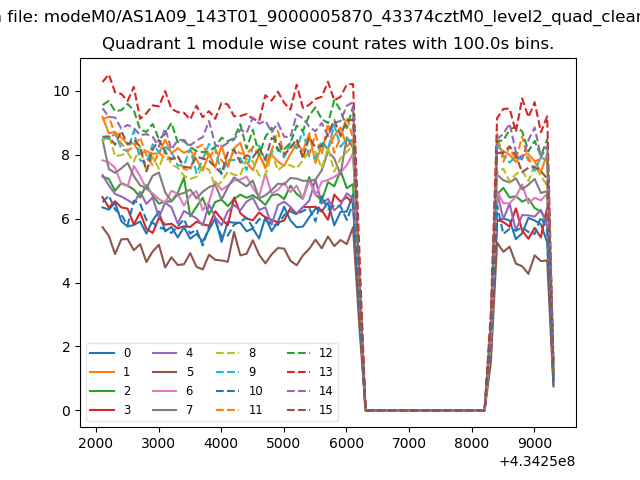
| Module-wise count rates for Quadrant A Data is divided into 100 sec bins |
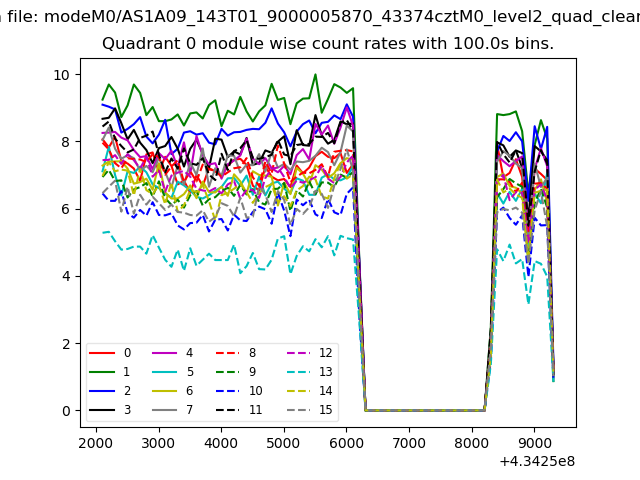 |
 |
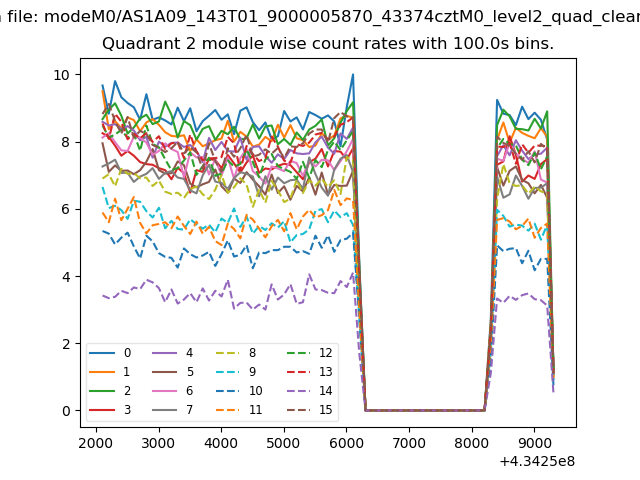
| Module-wise count rates for Quadrant B Data is divided into 100 sec bins |
 |
 |
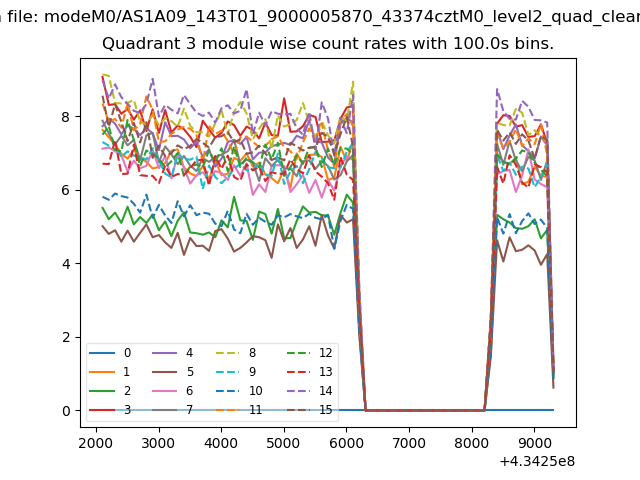
| Module-wise count rates for Quadrant C Data is divided into 100 sec bins |
 |
 |
| Module-wise count rates for Quadrant D Data is divided into 100 sec bins |
 |
 |
| Parameter | Plot |
|---|---|
| CZT HV Monitor | 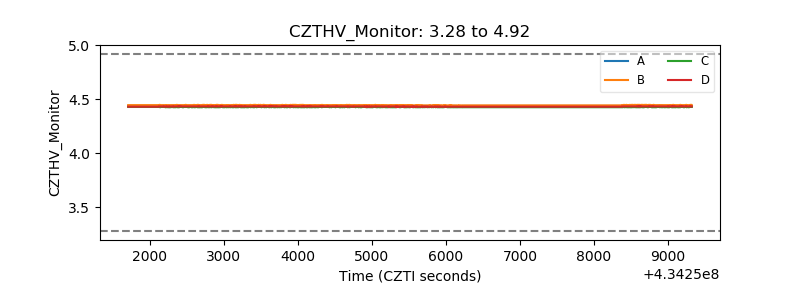 |
| D_VDD | 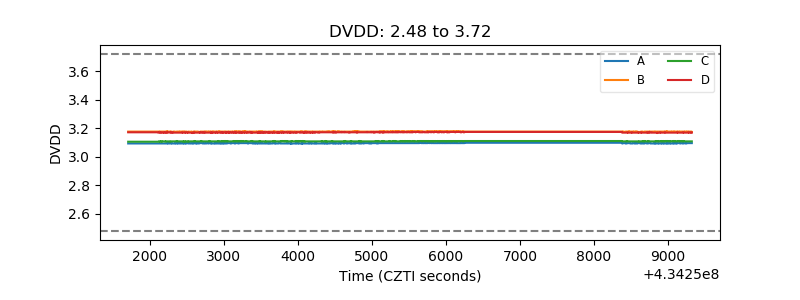 |
| Temperature 1 | 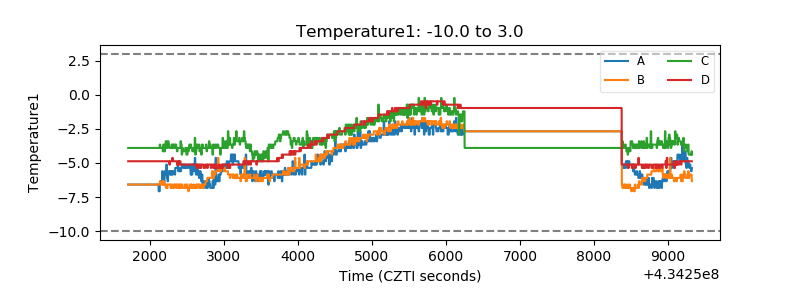 |
| Veto HV Monitor | 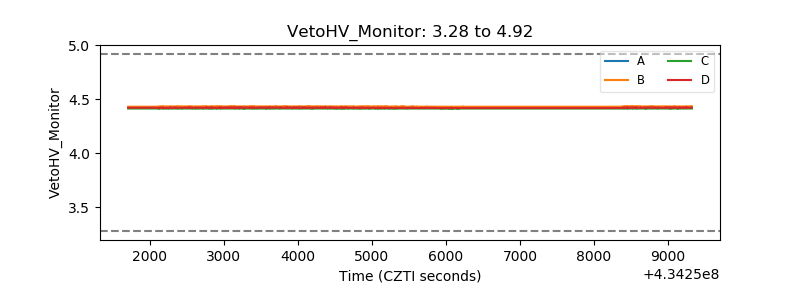 |
| Veto LLD | 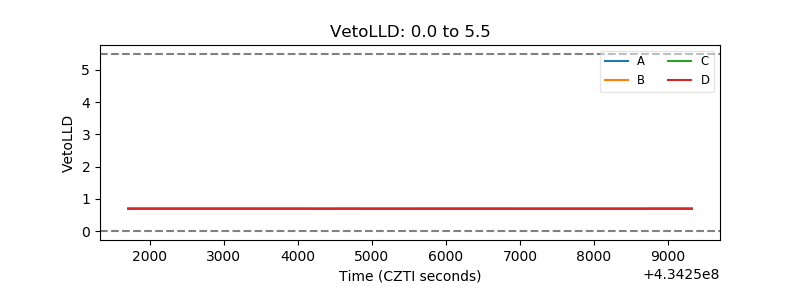 |
| Alpha Counter | 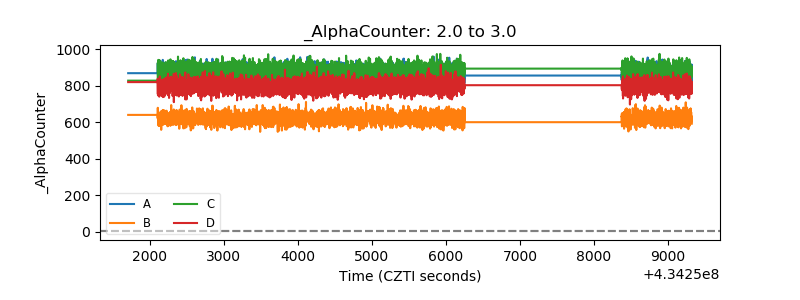 |
| _CPM_Rate | 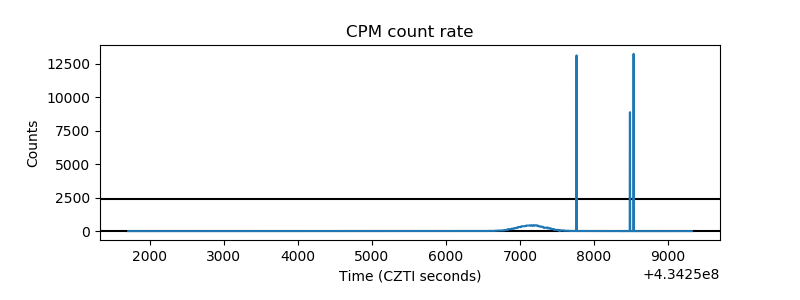 |
| CZT Counter | 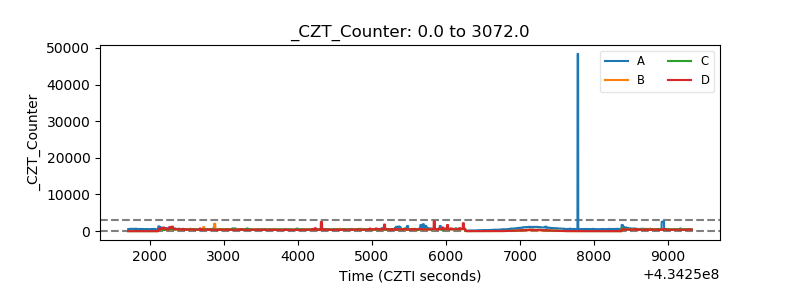 |
| +2.5 Volts monitor | 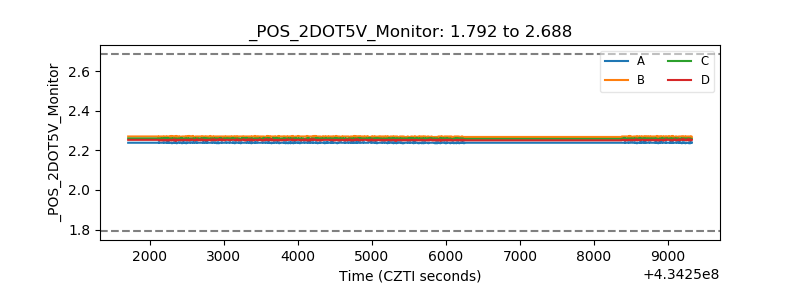 |
| +5 Volts monitor | 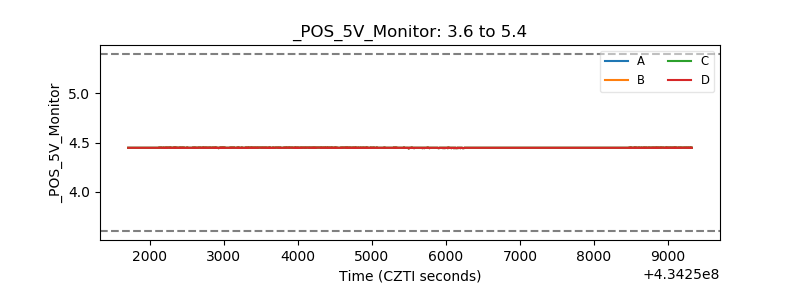 |
| _ROLL_ROT | 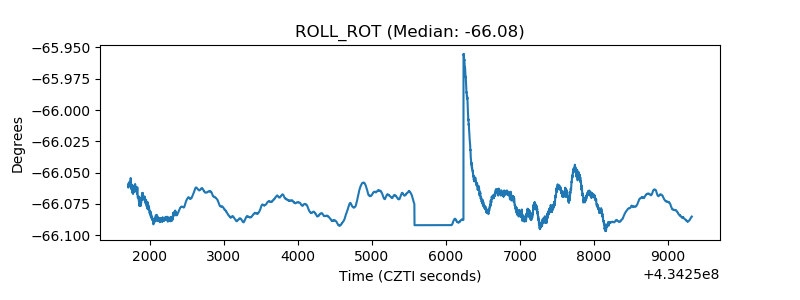 |
| _Roll_DEC | 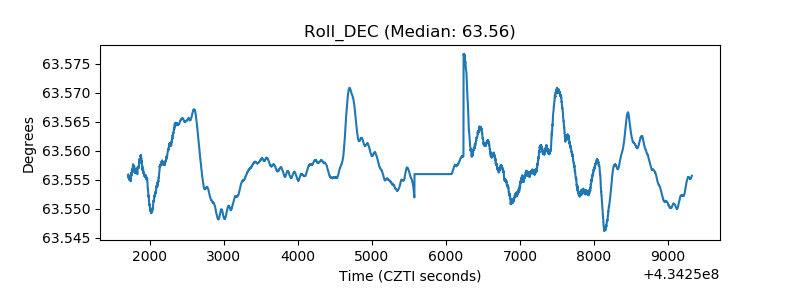 |
| _Roll_RA | 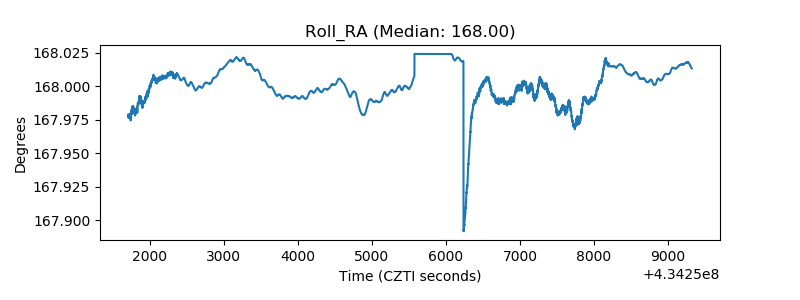 |
| Veto Counter | 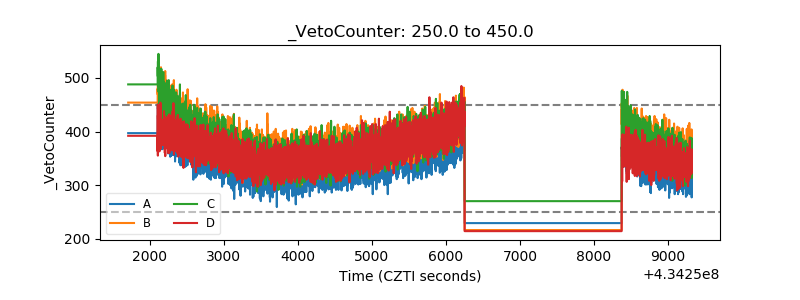 |