| Param | Original file | Final file |
|---|---|---|
| Filename | modeM0/AS1A09_143T01_9000005870_43376cztM0_level2.fits | modeM0/AS1A09_143T01_9000005870_43376cztM0_level2_quad_clean.evt |
| Size (bytes) | 578,859,840 | 163,886,400 |
| Size | 552.0 MB | 156.3 MB |
| Events in quadrant A | 6,120,839 | 1,091,096 |
| Events in quadrant B | 4,594,839 | 1,129,797 |
| Events in quadrant C | 4,869,962 | 1,073,667 |
| Events in quadrant D | 5,058,798 | 968,840 |
| Mode SS | |||
|---|---|---|---|
| Quadrant | BADHDUFLAG | Total packets | Discarded packets |
| A | 0 | 208 | 0 |
| B | 0 | 208 | 0 |
| C | 0 | 208 | 0 |
| D | 0 | 208 | 0 |
| Mode M9 | |||
|---|---|---|---|
| Quadrant | BADHDUFLAG | Total packets | Discarded packets |
| A | 0 | 58 | 0 |
| B | 0 | 58 | 0 |
| C | 0 | 58 | 0 |
| D | 0 | 58 | 0 |
| Mode M0 | |||
|---|---|---|---|
| Quadrant | BADHDUFLAG | Total packets | Discarded packets |
| A | 0 | 24362 | 3 |
| B | 0 | 20987 | 3 |
| C | 0 | 21009 | 3 |
| D | 0 | 22983 | 3 |
| Quadrant | Total seconds | Saturated seconds | Saturation percentage |
|---|---|---|---|
| A | 10083 | 172 | 1.705842% |
| B | 10083 | 82 | 0.813250% |
| C | 10084 | 9 | 0.089250% |
| D | 10084 | 225 | 2.231257% |
Noise dominated data is calculated using 1-second bins in cleaned event files. If a bin has >2000 counts, and if more than 50% of those come from <1% of pixels, then it is considered to be noise-dominated and hence unusable.
| Quadrant | # 1 sec bins | Bins with >0 counts | Bins with >2000 counts | High rate bins dominated by noise | Noise dominated (total time) | Noise dominated (detector-on time) | Marked lightcurve |
|---|---|---|---|---|---|---|---|
| A | 15912 | 10086 | 149 | 149 | 0.94% | 1.48% | 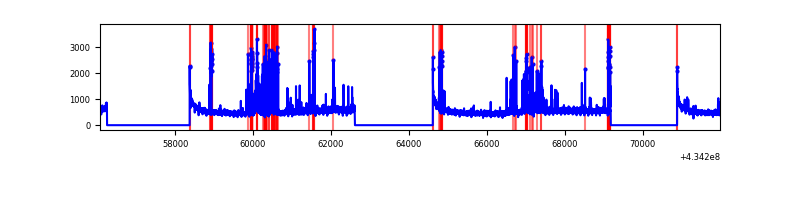 |
| B | 15912 | 10086 | 44 | 44 | 0.28% | 0.44% | 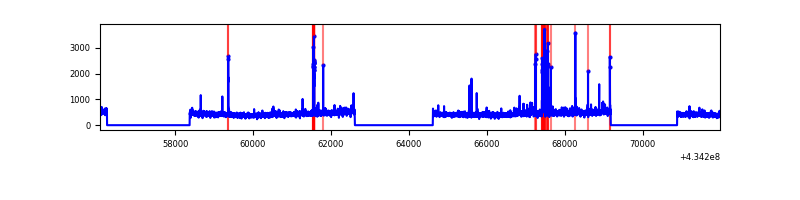 |
| C | 15913 | 10087 | 5 | 5 | 0.03% | 0.05% | 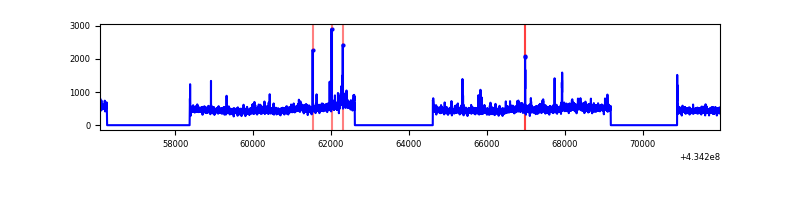 |
| D | 15913 | 10087 | 195 | 195 | 1.23% | 1.93% | 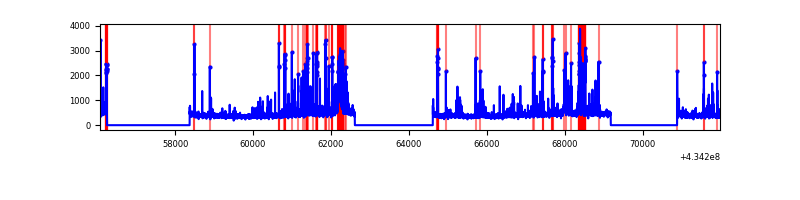 |
Top three noisy pixels from each quadrant. If the there are fewer than three noisy pixels in the level2.evt file, extra rows are filled as -1
| Pixel properties | Quadrant properties | ||||||
|---|---|---|---|---|---|---|---|
| Quadrant | DetID | PixID | Counts | Sigma | Mean | Median | Sigma |
| A | 10 | 83 | 1051424 | 4771.06 | 1073 | 1051 | 220.2 |
| A | 13 | 248 | 641767 | 2910.3 | 1073 | 1051 | 220.2 |
| A | 15 | 237 | 213078 | 963.08 | 1073 | 1051 | 220.2 |
| B | 5 | 172 | 190235 | 924.95 | 1068 | 1039 | 204.5 |
| B | 0 | 189 | 101363 | 490.47 | 1068 | 1039 | 204.5 |
| B | 3 | 112 | 46986 | 224.63 | 1068 | 1039 | 204.5 |
| C | 15 | 214 | 416532 | 1728.35 | 1042 | 1044 | 240.4 |
| C | 3 | 233 | 338839 | 1405.16 | 1042 | 1044 | 240.4 |
| C | 15 | 111 | 38550 | 156.02 | 1042 | 1044 | 240.4 |
| D | 1 | 52 | 344812 | 1381.88 | 1032 | 1003 | 248.8 |
| D | 10 | 118 | 248776 | 995.88 | 1032 | 1003 | 248.8 |
| D | 13 | 249 | 135308 | 539.82 | 1032 | 1003 | 248.8 |
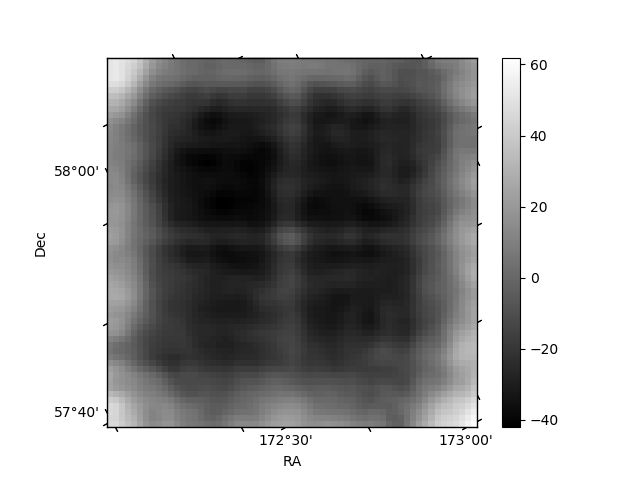
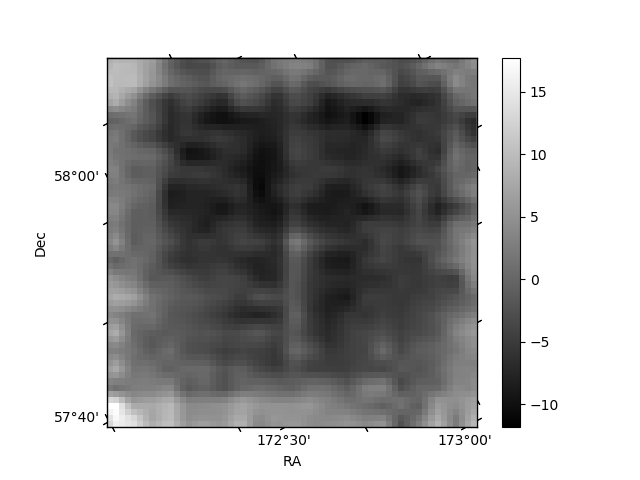
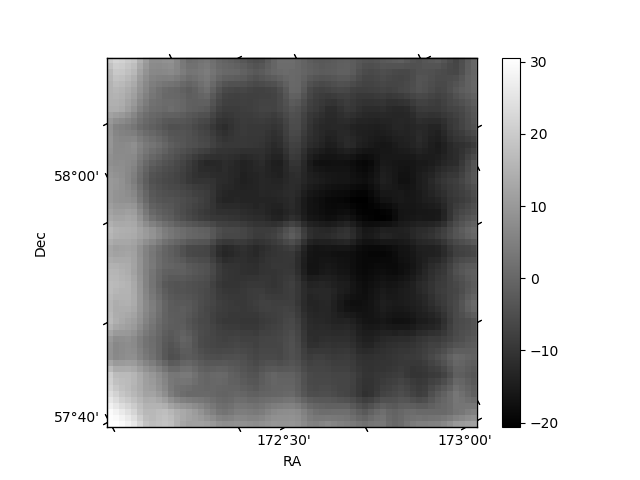
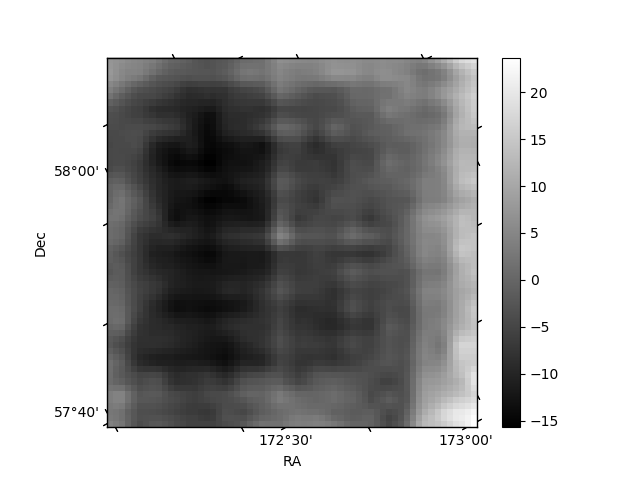
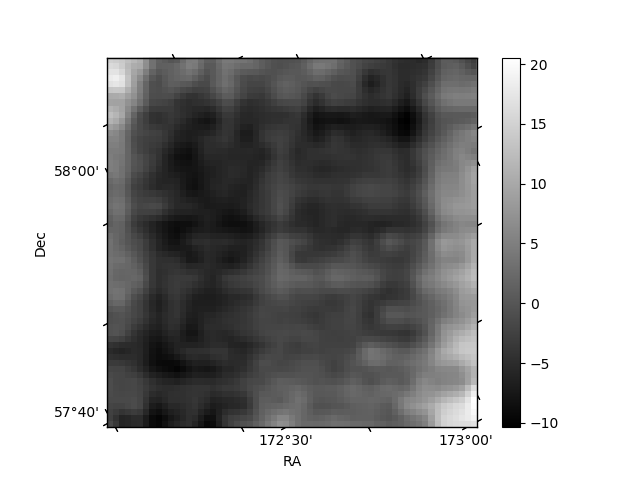
Histogram calculated using DETX and DETY for each event in the final _common_clean file
| Quadrant A | 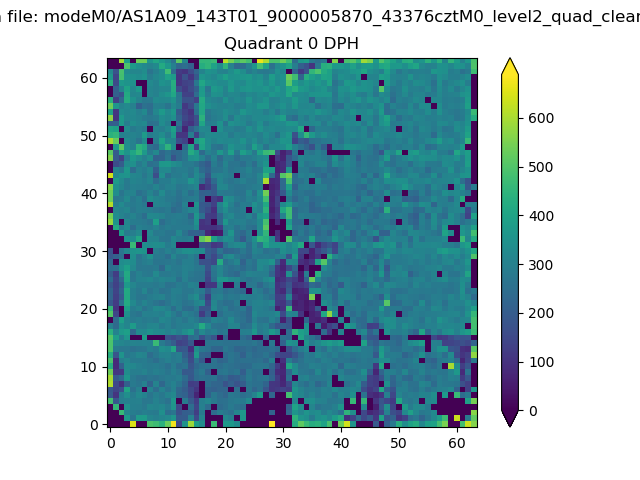 |
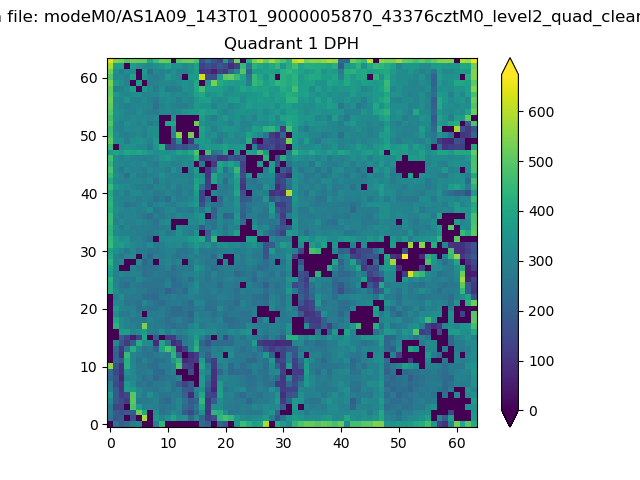 |
Quadrant B |
|---|---|---|---|
| Quadrant D |  |
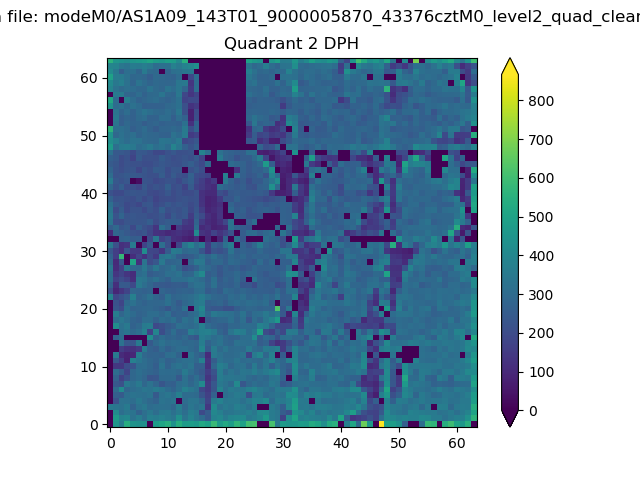 |
Quadrant C |
| Plot type | Count rate plots | Images |
|---|---|---|
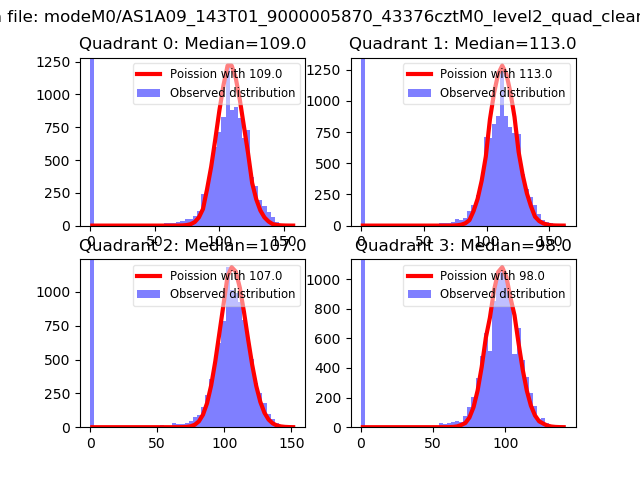
| Comparison with Poisson distribution Blue bars denote a histogram of data divided into 1 sec bins. Red curve is a Poisson curve with rate = median count rate of data. |
 |
 |
| Quadrant-wise count rates Data is divided into 100 sec bins |
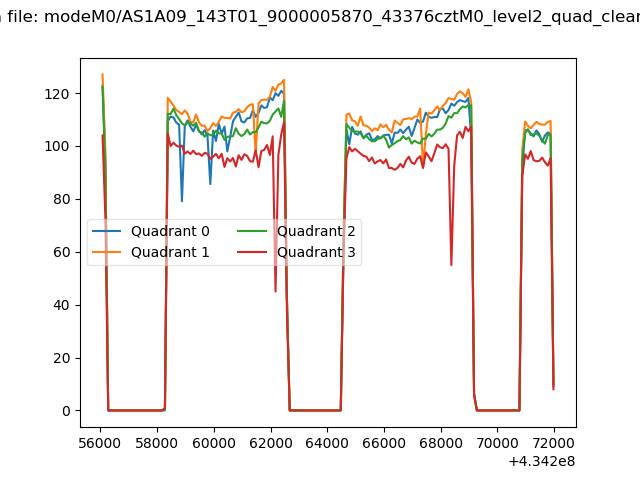 |
|
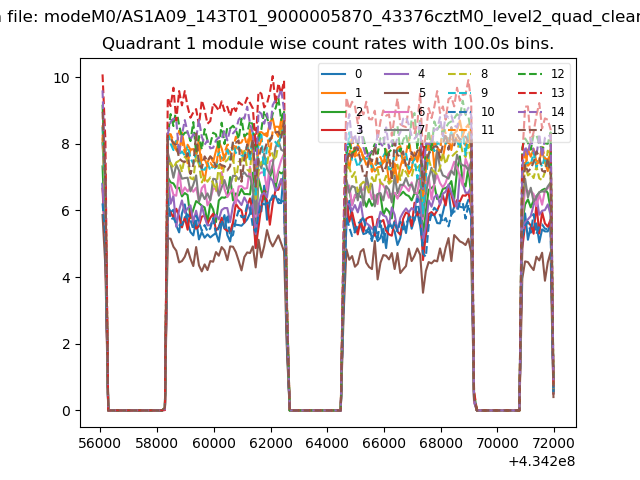
| Module-wise count rates for Quadrant A Data is divided into 100 sec bins |
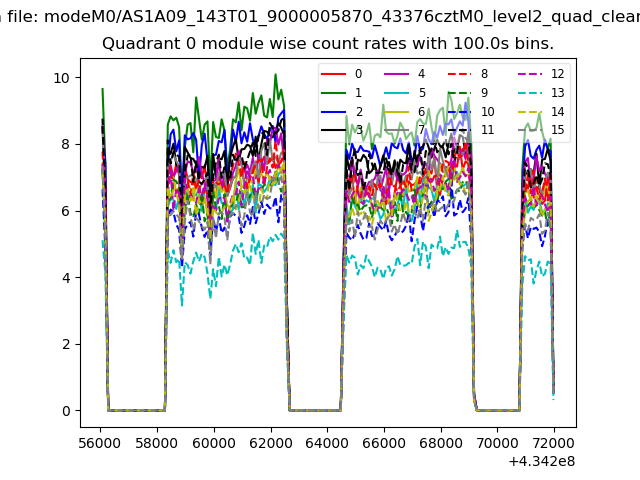 |
 |
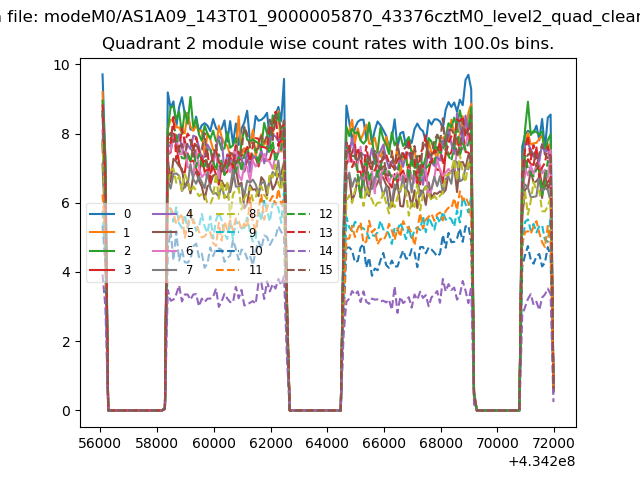
| Module-wise count rates for Quadrant B Data is divided into 100 sec bins |
 |
 |
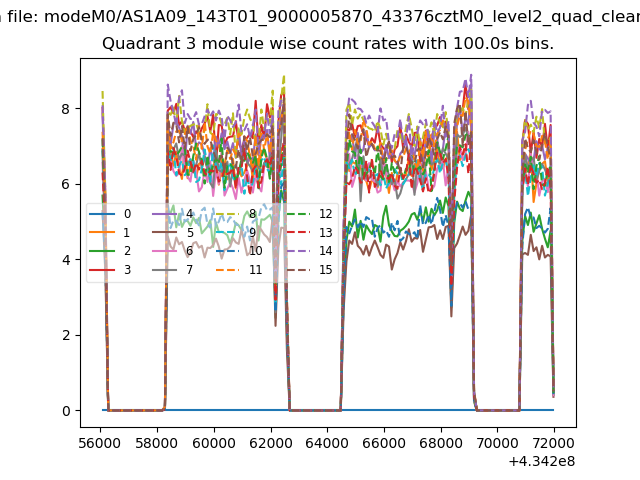
| Module-wise count rates for Quadrant C Data is divided into 100 sec bins |
 |
 |
| Module-wise count rates for Quadrant D Data is divided into 100 sec bins |
 |
 |
| Parameter | Plot |
|---|---|
| CZT HV Monitor | 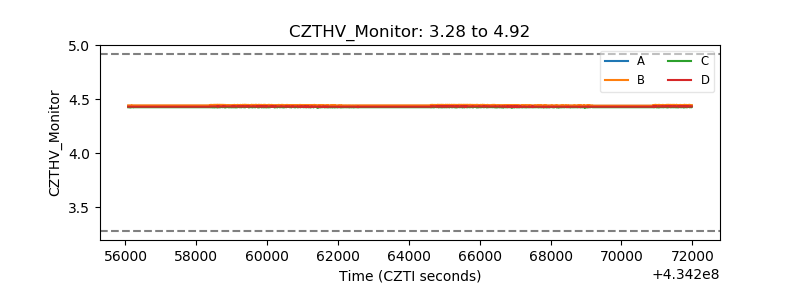 |
| D_VDD | 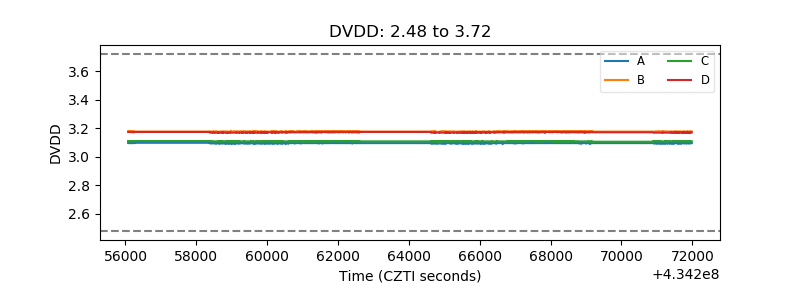 |
| Temperature 1 | 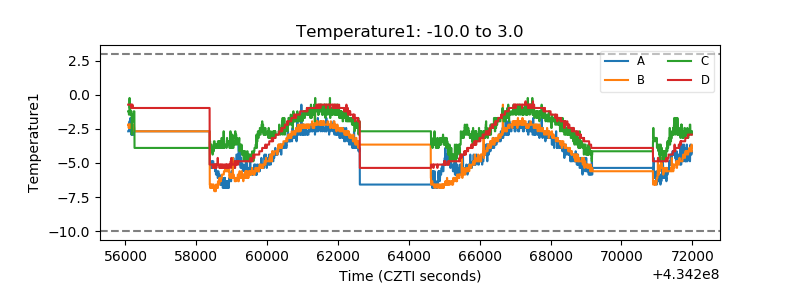 |
| Veto HV Monitor | 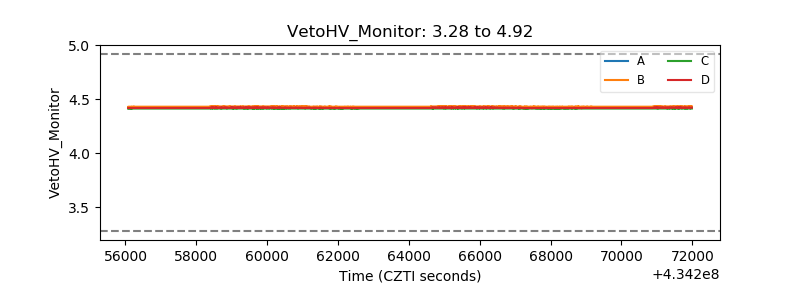 |
| Veto LLD |  |
| Alpha Counter | 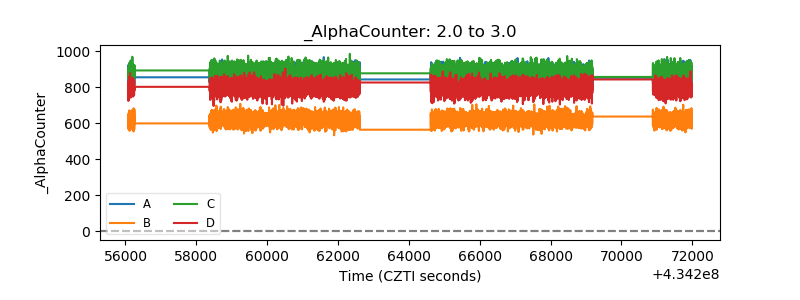 |
| _CPM_Rate | 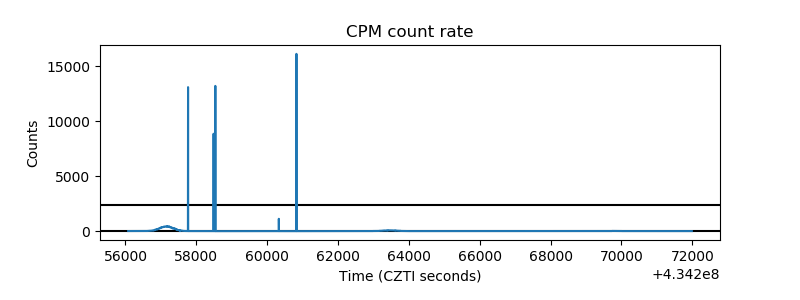 |
| CZT Counter | 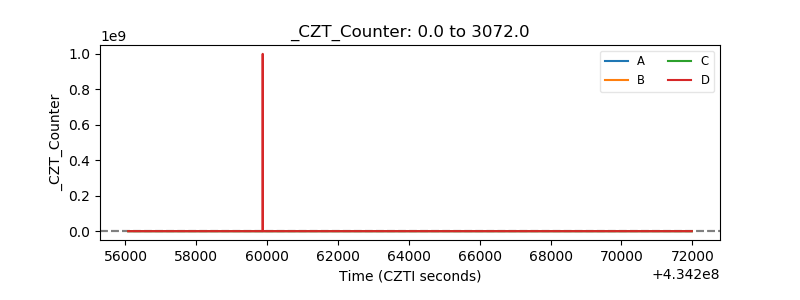 |
| +2.5 Volts monitor | 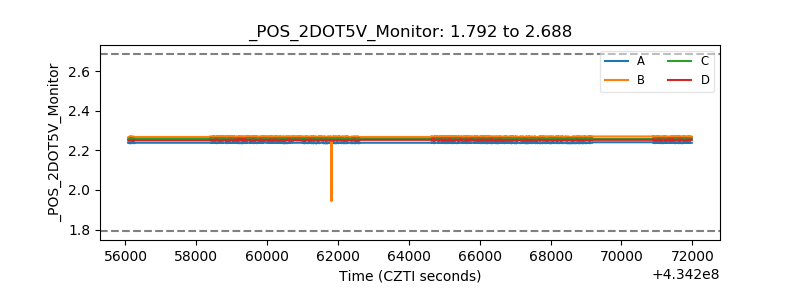 |
| +5 Volts monitor | 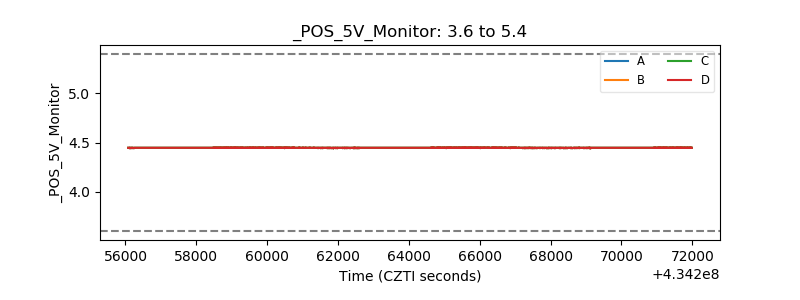 |
| _ROLL_ROT | 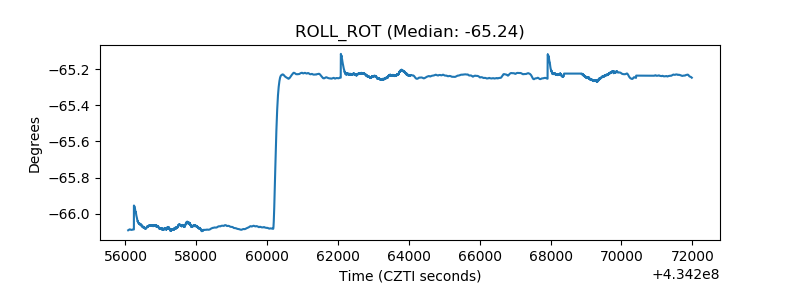 |
| _Roll_DEC |  |
| _Roll_RA | 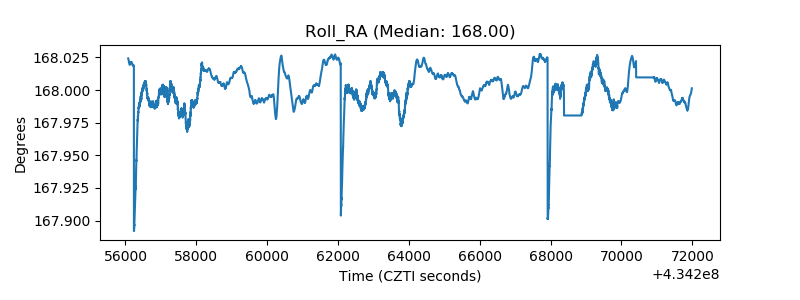 |
| Veto Counter | 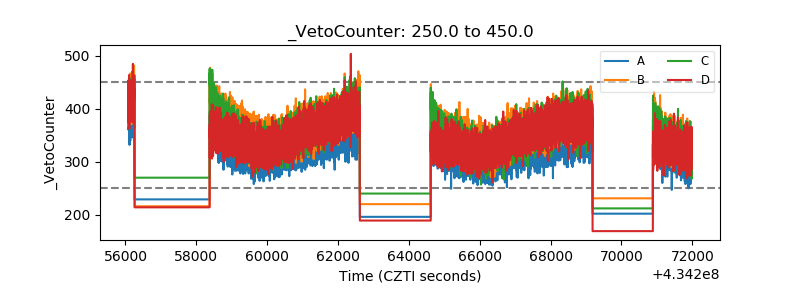 |