| Param | Original file | Final file |
|---|---|---|
| Filename | modeM0/AS1A09_143T01_9000005870_43377cztM0_level2.fits | modeM0/AS1A09_143T01_9000005870_43377cztM0_level2_quad_clean.evt |
| Size (bytes) | 313,776,000 | 91,658,880 |
| Size | 299.2 MB | 87.4 MB |
| Events in quadrant A | 3,390,727 | 605,608 |
| Events in quadrant B | 2,579,534 | 629,609 |
| Events in quadrant C | 2,694,806 | 596,007 |
| Events in quadrant D | 2,506,410 | 546,698 |
| Mode SS | |||
|---|---|---|---|
| Quadrant | BADHDUFLAG | Total packets | Discarded packets |
| A | 0 | 114 | 0 |
| B | 0 | 114 | 0 |
| C | 0 | 114 | 0 |
| D | 0 | 114 | 0 |
| Mode M9 | |||
|---|---|---|---|
| Quadrant | BADHDUFLAG | Total packets | Discarded packets |
| A | 0 | 14 | 0 |
| B | 0 | 14 | 0 |
| C | 0 | 14 | 0 |
| D | 0 | 14 | 0 |
| Mode M0 | |||
|---|---|---|---|
| Quadrant | BADHDUFLAG | Total packets | Discarded packets |
| A | 0 | 13460 | 1 |
| B | 0 | 11765 | 1 |
| C | 0 | 11608 | 2 |
| D | 0 | 11885 | 1 |
| Quadrant | Total seconds | Saturated seconds | Saturation percentage |
|---|---|---|---|
| A | 5688 | 121 | 2.127286% |
| B | 5688 | 14 | 0.246132% |
| C | 5687 | 8 | 0.140672% |
| D | 5688 | 26 | 0.457103% |
Noise dominated data is calculated using 1-second bins in cleaned event files. If a bin has >2000 counts, and if more than 50% of those come from <1% of pixels, then it is considered to be noise-dominated and hence unusable.
| Quadrant | # 1 sec bins | Bins with >0 counts | Bins with >2000 counts | High rate bins dominated by noise | Noise dominated (total time) | Noise dominated (detector-on time) | Marked lightcurve |
|---|---|---|---|---|---|---|---|
| A | 7089 | 5689 | 104 | 104 | 1.47% | 1.83% | 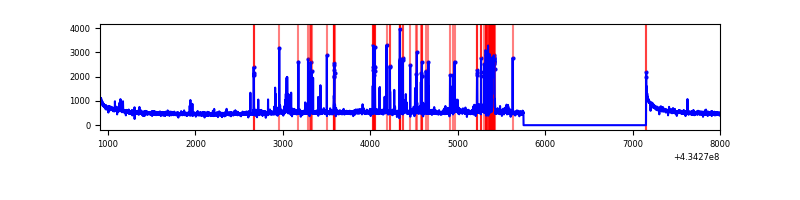 |
| B | 7089 | 5689 | 6 | 6 | 0.08% | 0.11% | 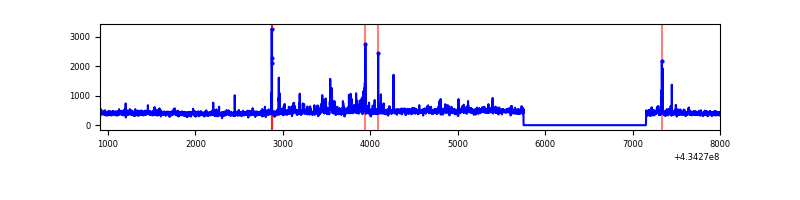 |
| C | 7088 | 5688 | 4 | 4 | 0.06% | 0.07% | 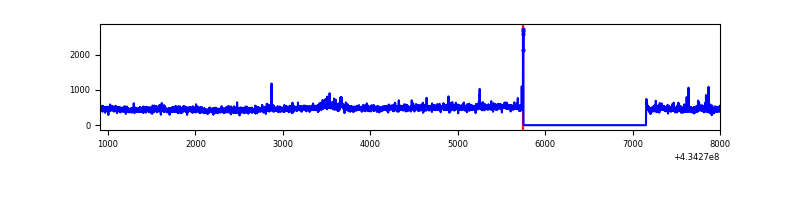 |
| D | 7089 | 5689 | 19 | 19 | 0.27% | 0.33% | 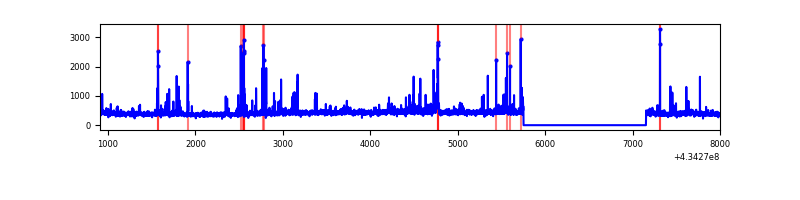 |
Top three noisy pixels from each quadrant. If the there are fewer than three noisy pixels in the level2.evt file, extra rows are filled as -1
| Pixel properties | Quadrant properties | ||||||
|---|---|---|---|---|---|---|---|
| Quadrant | DetID | PixID | Counts | Sigma | Mean | Median | Sigma |
| A | 10 | 83 | 606795 | 4904.96 | 601 | 588 | 123.6 |
| A | 15 | 237 | 390890 | 3158.02 | 601 | 588 | 123.6 |
| A | 13 | 248 | 57259 | 458.53 | 601 | 588 | 123.6 |
| B | 0 | 189 | 84592 | 711.84 | 602 | 586 | 118.0 |
| B | 3 | 112 | 32268 | 268.46 | 602 | 586 | 118.0 |
| B | 15 | 85 | 27990 | 232.21 | 602 | 586 | 118.0 |
| C | 15 | 214 | 237752 | 1725.82 | 588 | 591 | 137.4 |
| C | 3 | 233 | 123583 | 895.01 | 588 | 591 | 137.4 |
| C | 0 | 207 | 30228 | 215.67 | 588 | 591 | 137.4 |
| D | 5 | 171 | 54908 | 381.09 | 589 | 572 | 142.6 |
| D | 13 | 249 | 53046 | 368.03 | 589 | 572 | 142.6 |
| D | 12 | 6 | 42552 | 294.43 | 589 | 572 | 142.6 |
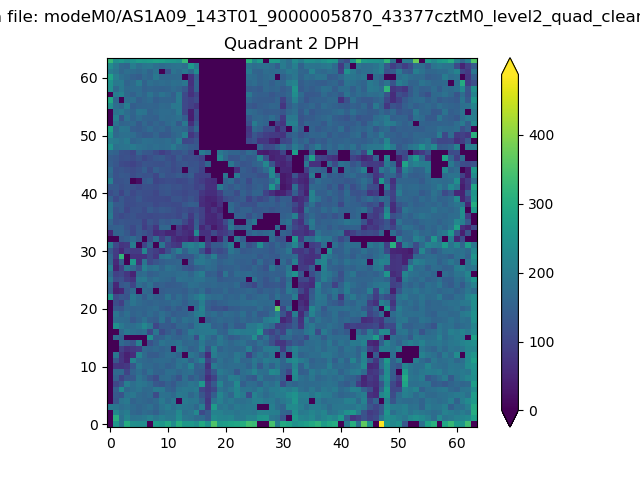
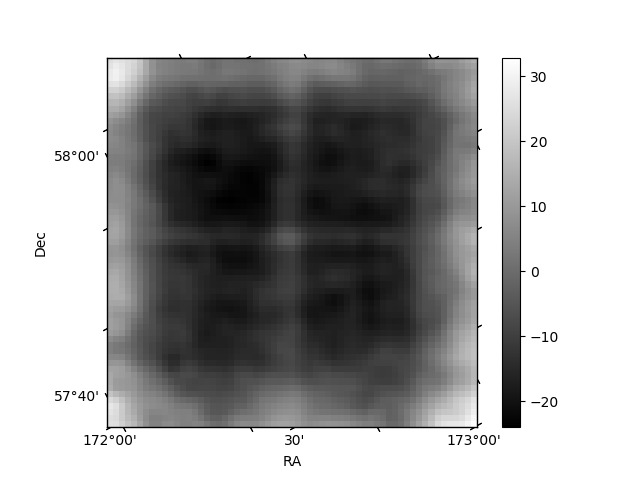
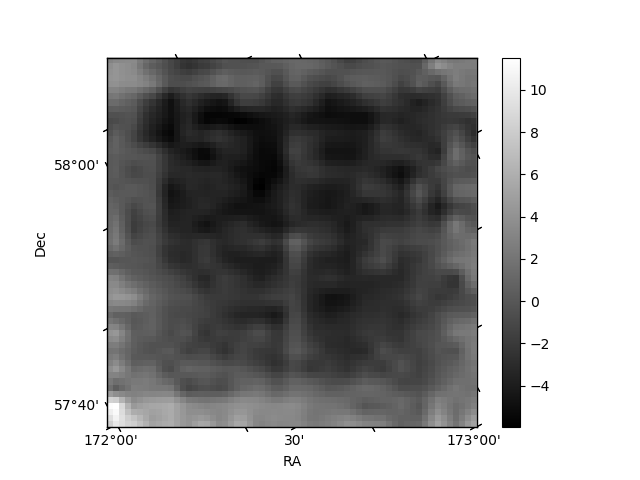
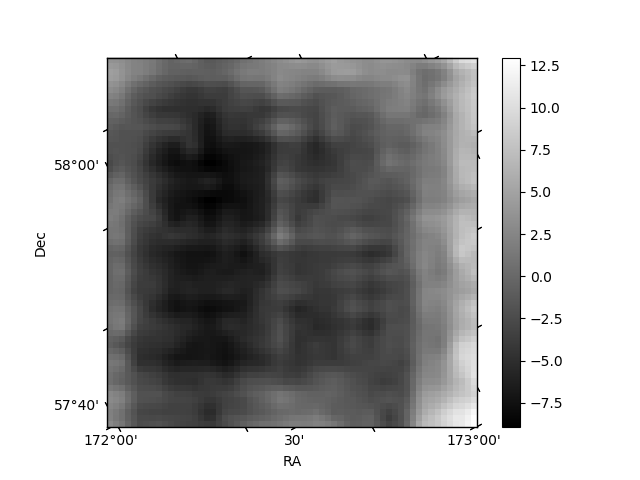
Histogram calculated using DETX and DETY for each event in the final _common_clean file
| Quadrant A | 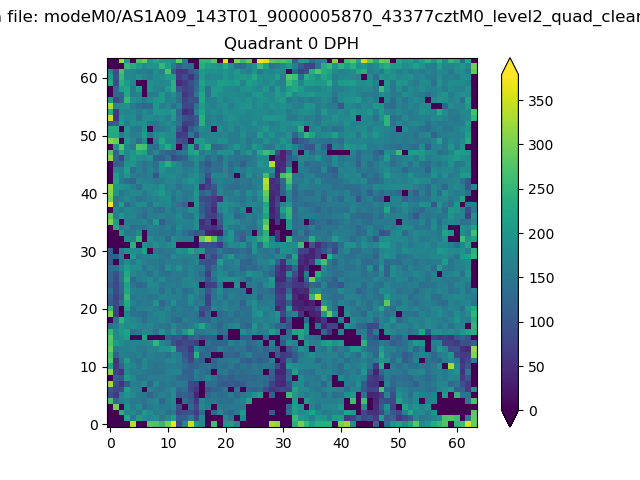 |
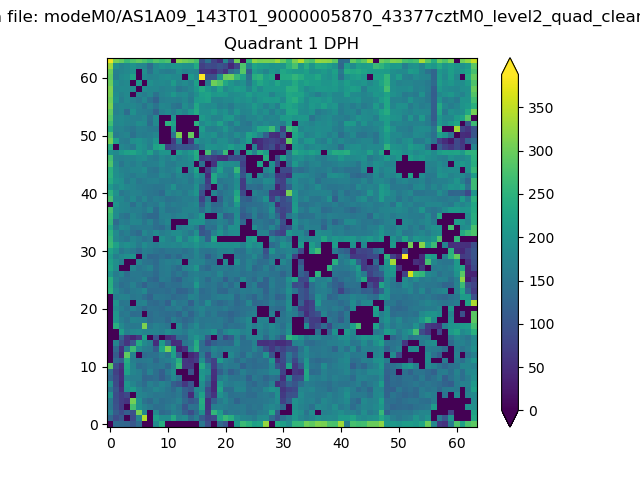 |
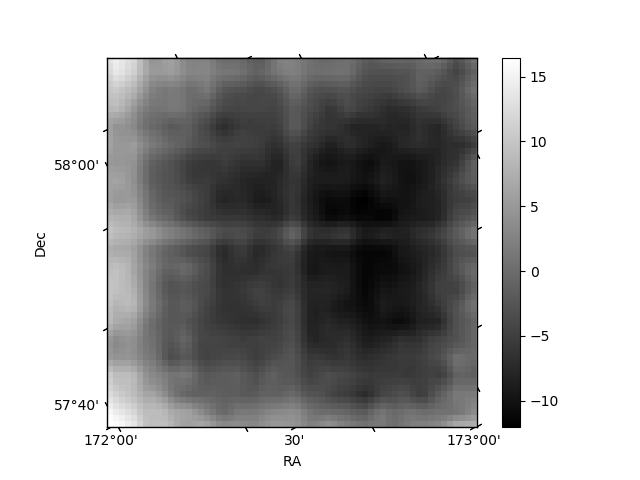
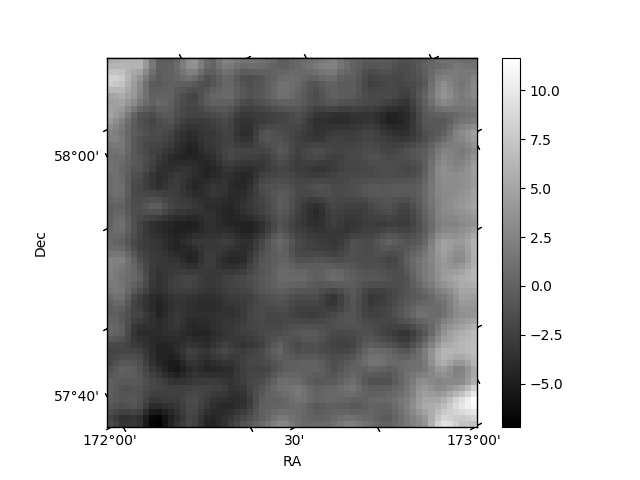
Quadrant B |
|---|---|---|---|
| Quadrant D | 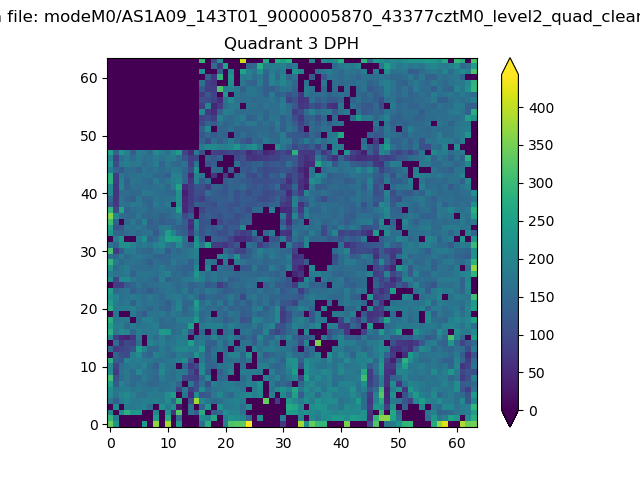 |
 |
Quadrant C |
| Plot type | Count rate plots | Images |
|---|---|---|
| Comparison with Poisson distribution Blue bars denote a histogram of data divided into 1 sec bins. Red curve is a Poisson curve with rate = median count rate of data. |
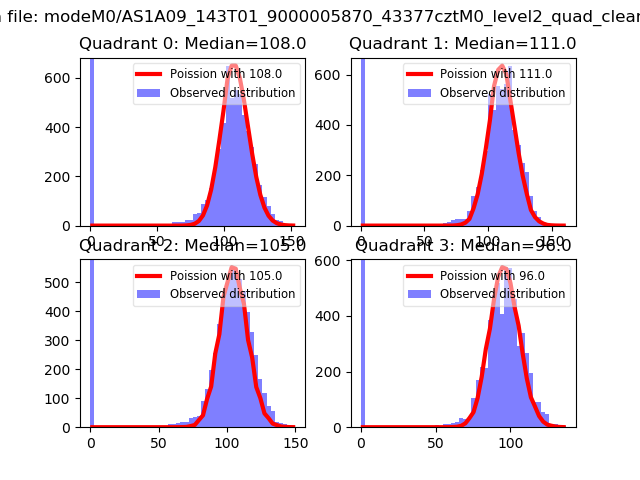 |
 |
| Quadrant-wise count rates Data is divided into 100 sec bins |
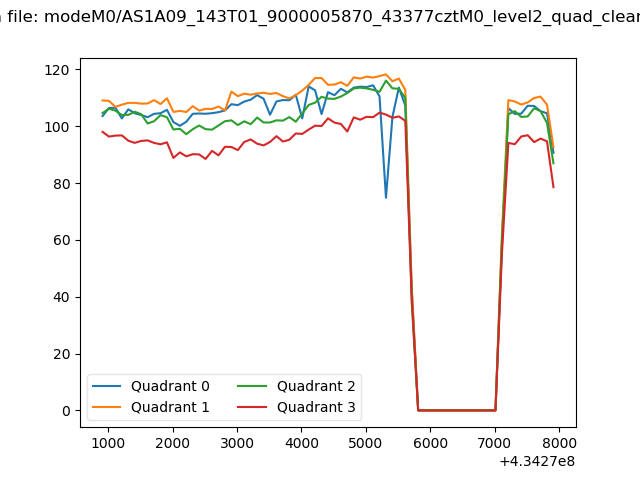 |
|
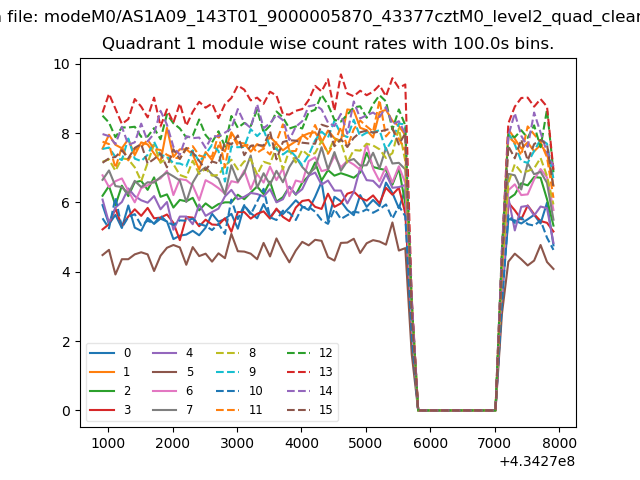
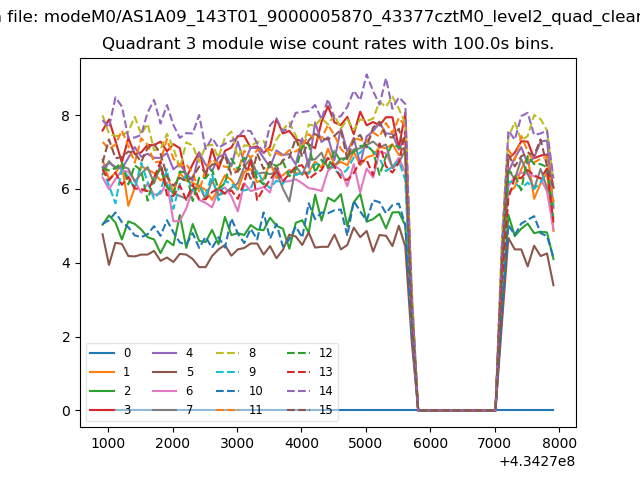
| Module-wise count rates for Quadrant A Data is divided into 100 sec bins |
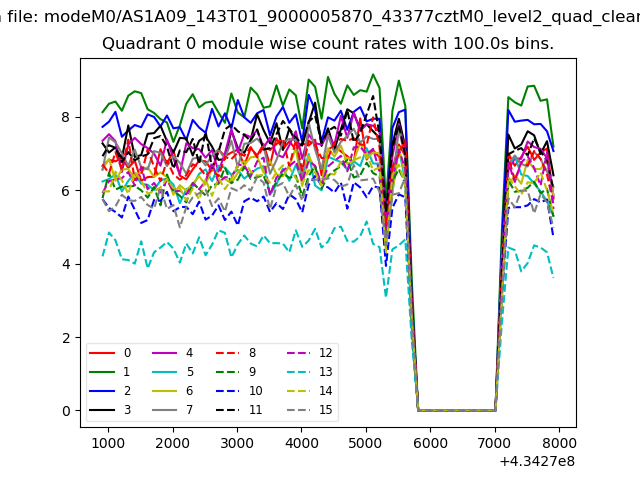 |
 |
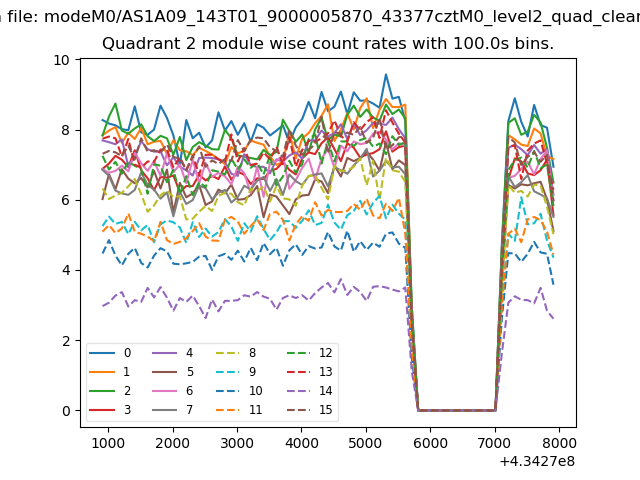
| Module-wise count rates for Quadrant B Data is divided into 100 sec bins |
 |
 |
| Module-wise count rates for Quadrant C Data is divided into 100 sec bins |
 |
 |
| Module-wise count rates for Quadrant D Data is divided into 100 sec bins |
 |
 |
| Parameter | Plot |
|---|---|
| CZT HV Monitor | 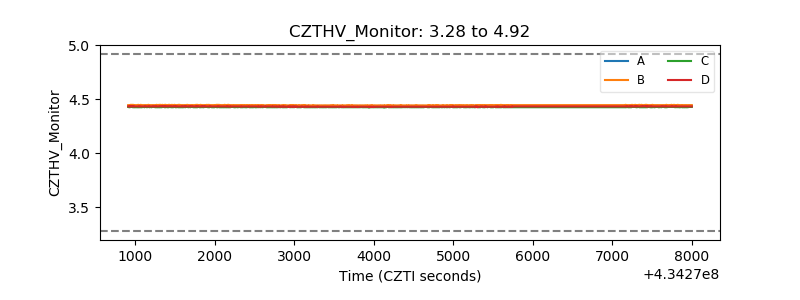 |
| D_VDD | 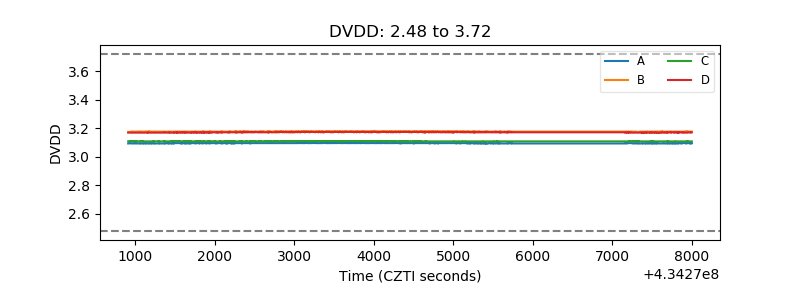 |
| Temperature 1 | 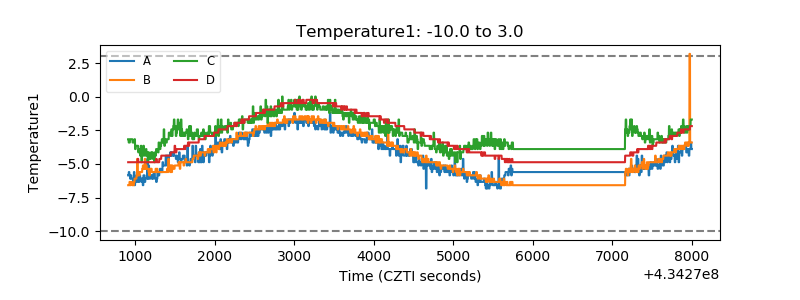 |
| Veto HV Monitor | 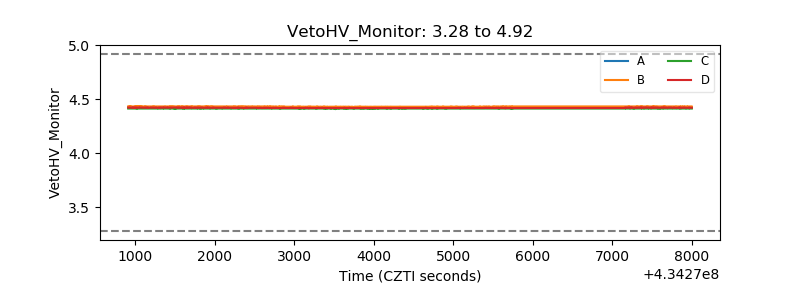 |
| Veto LLD | 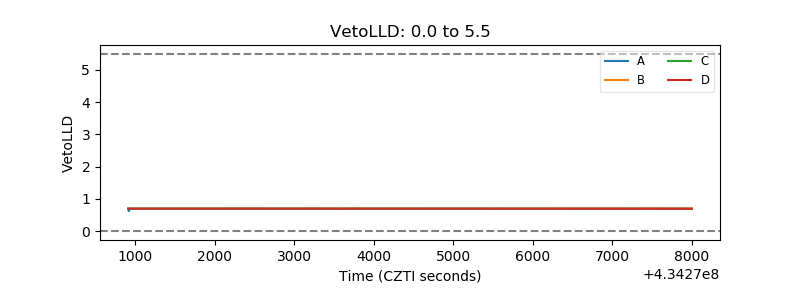 |
| Alpha Counter | 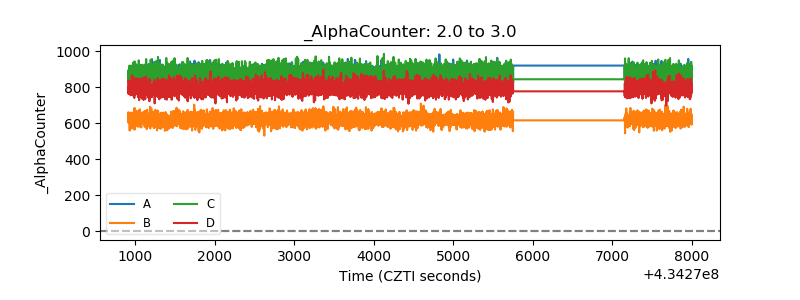 |
| _CPM_Rate | 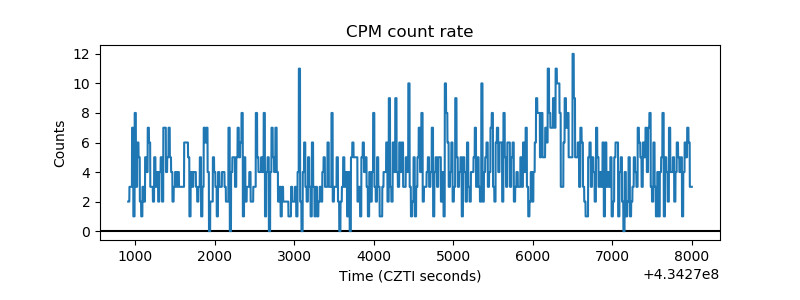 |
| CZT Counter | 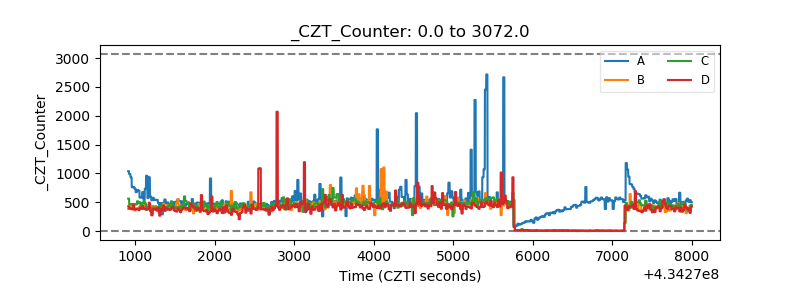 |
| +2.5 Volts monitor | 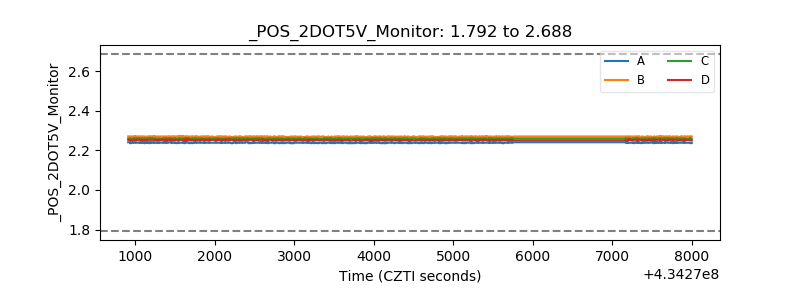 |
| +5 Volts monitor | 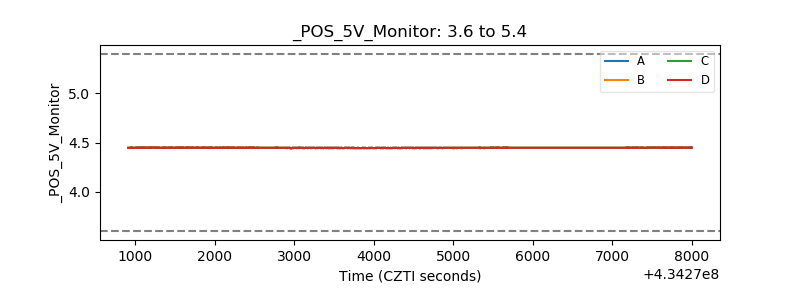 |
| _ROLL_ROT | 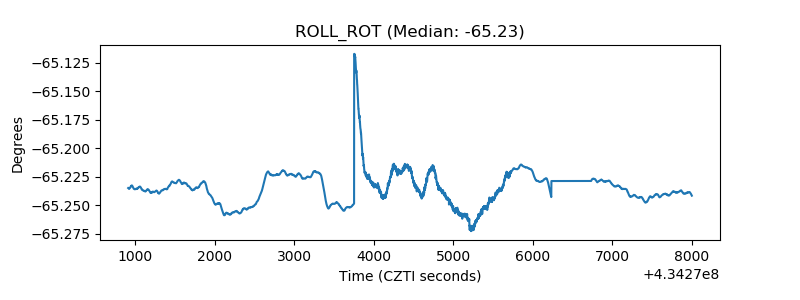 |
| _Roll_DEC |  |
| _Roll_RA | 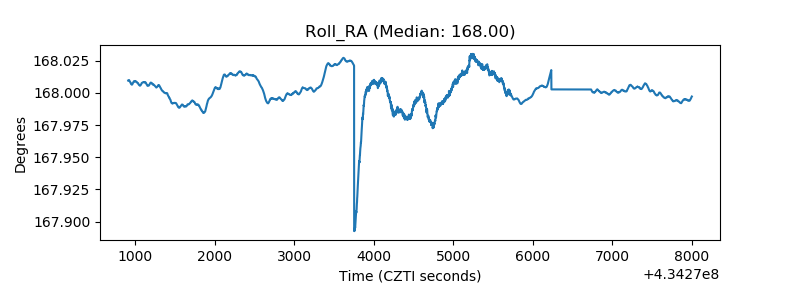 |
| Veto Counter | 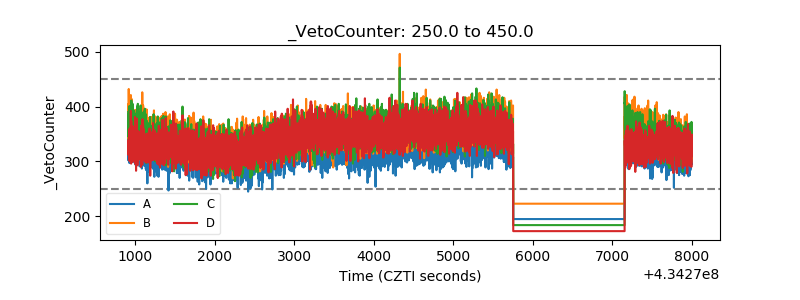 |