| Param | Original file | Final file |
|---|---|---|
| Filename | modeM0/AS1C07_001T10_9000005872_43381cztM0_level2.fits | modeM0/AS1C07_001T10_9000005872_43381cztM0_level2_quad_clean.evt |
| Size (bytes) | 923,711,040 | 246,369,600 |
| Size | 880.9 MB | 235.0 MB |
| Events in quadrant A | 8,988,551 | 1,646,104 |
| Events in quadrant B | 7,143,480 | 1,698,935 |
| Events in quadrant C | 8,229,841 | 1,588,694 |
| Events in quadrant D | 8,629,399 | 1,455,028 |
| Mode SS | |||
|---|---|---|---|
| Quadrant | BADHDUFLAG | Total packets | Discarded packets |
| A | 0 | 318 | 0 |
| B | 0 | 318 | 0 |
| C | 0 | 318 | 0 |
| D | 0 | 318 | 0 |
| Mode M9 | |||
|---|---|---|---|
| Quadrant | BADHDUFLAG | Total packets | Discarded packets |
| A | 0 | 41 | 0 |
| B | 0 | 41 | 0 |
| C | 0 | 41 | 0 |
| D | 0 | 41 | 0 |
| Mode M0 | |||
|---|---|---|---|
| Quadrant | BADHDUFLAG | Total packets | Discarded packets |
| A | 0 | 35729 | 4 |
| B | 0 | 31946 | 4 |
| C | 0 | 34113 | 4 |
| D | 0 | 37213 | 5 |
| Quadrant | Total seconds | Saturated seconds | Saturation percentage |
|---|---|---|---|
| A | 15506 | 223 | 1.438153% |
| B | 15507 | 52 | 0.335332% |
| C | 15507 | 56 | 0.361127% |
| D | 15506 | 351 | 2.263640% |
Noise dominated data is calculated using 1-second bins in cleaned event files. If a bin has >2000 counts, and if more than 50% of those come from <1% of pixels, then it is considered to be noise-dominated and hence unusable.
| Quadrant | # 1 sec bins | Bins with >0 counts | Bins with >2000 counts | High rate bins dominated by noise | Noise dominated (total time) | Noise dominated (detector-on time) | Marked lightcurve |
|---|---|---|---|---|---|---|---|
| A | 19684 | 15509 | 145 | 145 | 0.74% | 0.93% | 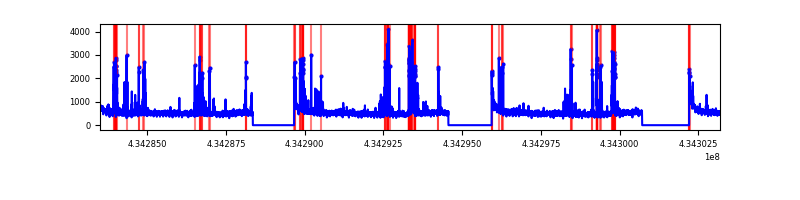 |
| B | 19685 | 15510 | 29 | 29 | 0.15% | 0.19% | 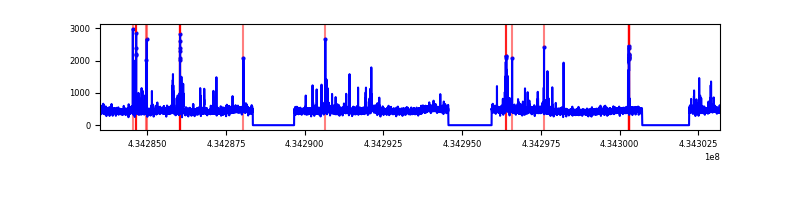 |
| C | 19685 | 15510 | 40 | 40 | 0.20% | 0.26% | 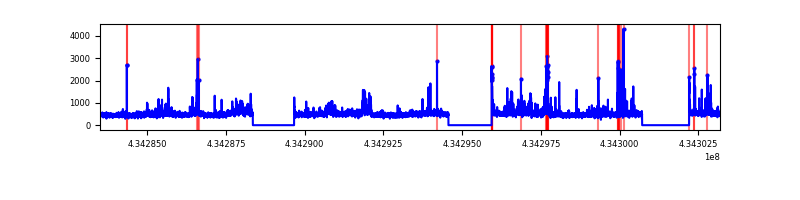 |
| D | 19684 | 15509 | 318 | 318 | 1.62% | 2.05% | 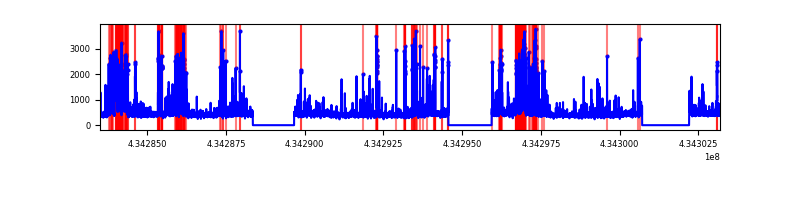 |
Top three noisy pixels from each quadrant. If the there are fewer than three noisy pixels in the level2.evt file, extra rows are filled as -1
| Pixel properties | Quadrant properties | ||||||
|---|---|---|---|---|---|---|---|
| Quadrant | DetID | PixID | Counts | Sigma | Mean | Median | Sigma |
| A | 10 | 83 | 1626346 | 4854.13 | 1652 | 1618 | 334.7 |
| A | 15 | 237 | 665495 | 1983.44 | 1652 | 1618 | 334.7 |
| A | 13 | 248 | 218863 | 649.05 | 1652 | 1618 | 334.7 |
| B | 3 | 112 | 218289 | 690.27 | 1656 | 1609 | 313.9 |
| B | 0 | 186 | 143526 | 452.1 | 1656 | 1609 | 313.9 |
| B | 0 | 189 | 62921 | 195.32 | 1656 | 1609 | 313.9 |
| C | 3 | 233 | 1026733 | 2728.3 | 1616 | 1620 | 375.7 |
| C | 15 | 214 | 645589 | 1713.9 | 1616 | 1620 | 375.7 |
| C | 14 | 254 | 87257 | 227.92 | 1616 | 1620 | 375.7 |
| D | 12 | 233 | 932684 | 2356.97 | 1612 | 1561 | 395.1 |
| D | 1 | 52 | 583899 | 1474.08 | 1612 | 1561 | 395.1 |
| D | 13 | 249 | 290259 | 730.79 | 1612 | 1561 | 395.1 |
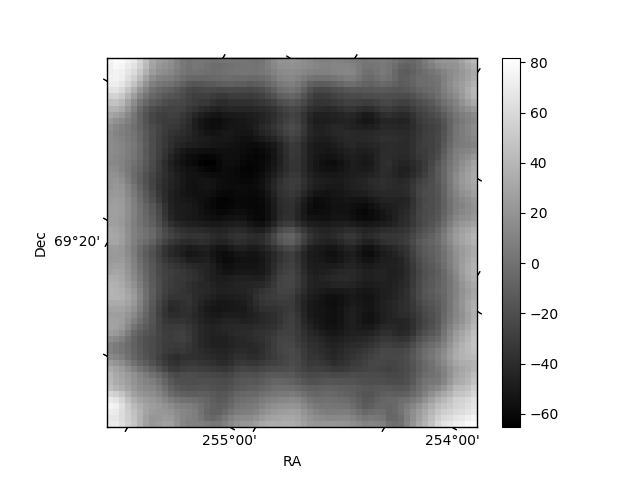
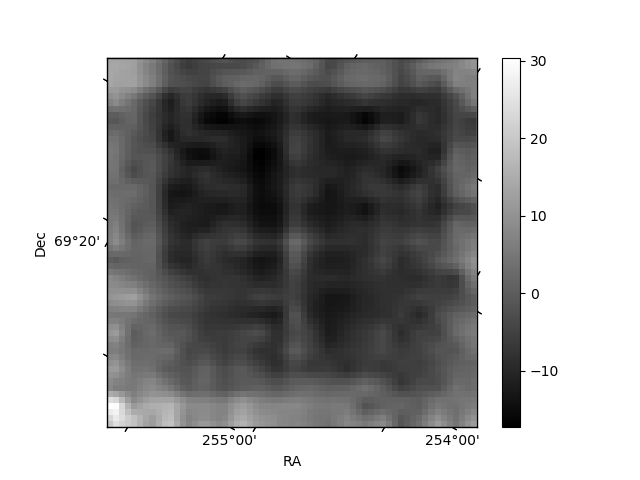
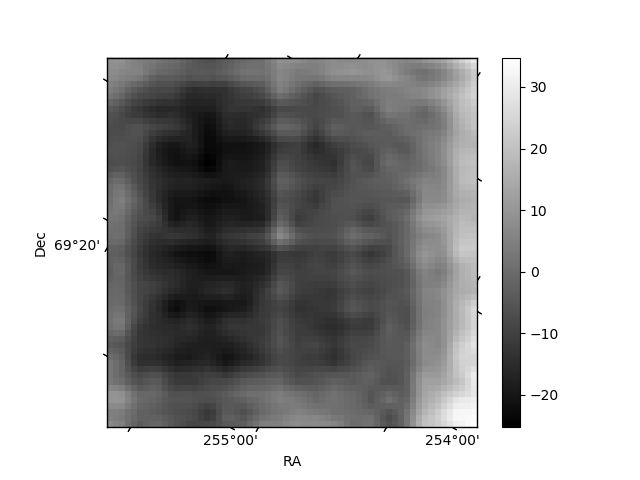
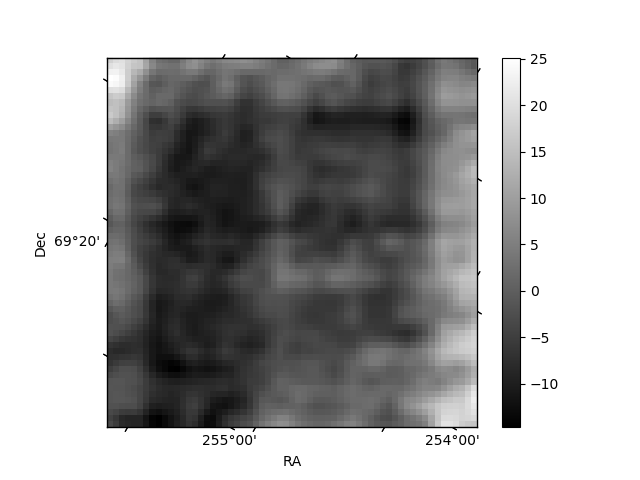
Histogram calculated using DETX and DETY for each event in the final _common_clean file
| Quadrant A | 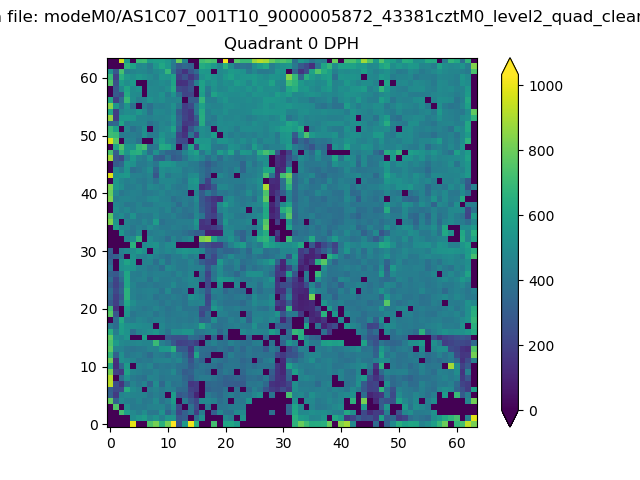 |
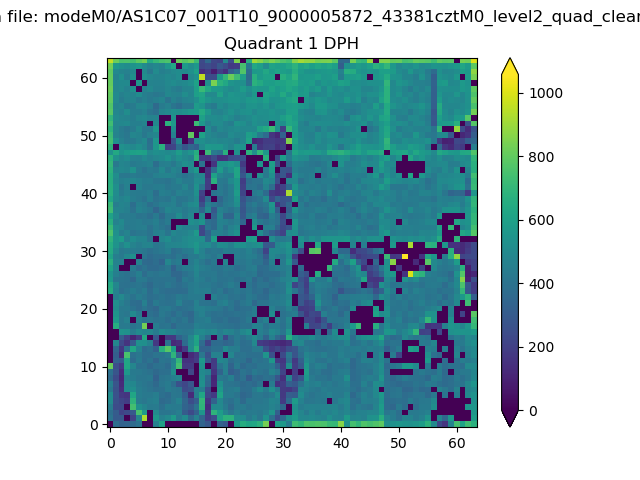 |
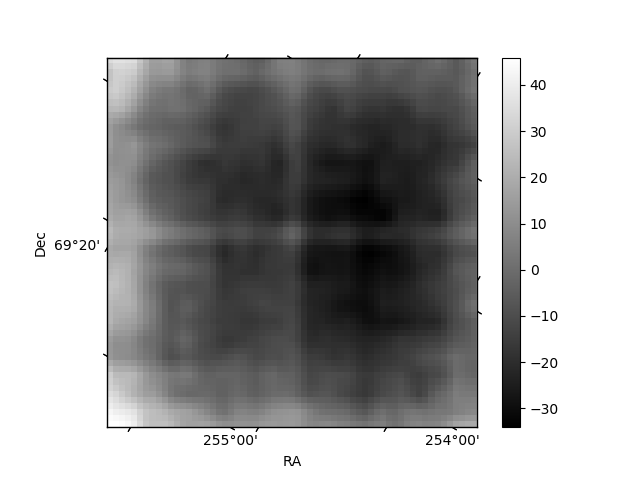
Quadrant B |
|---|---|---|---|
| Quadrant D | 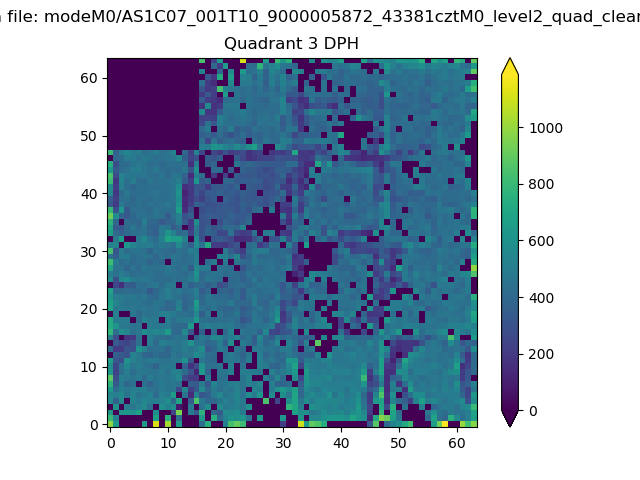 |
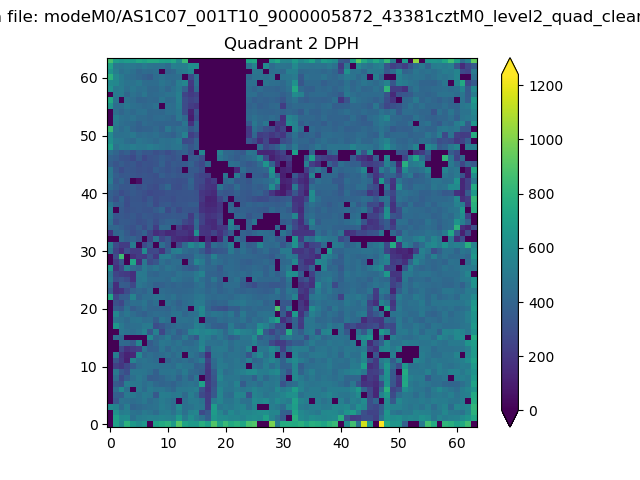 |
Quadrant C |
| Plot type | Count rate plots | Images |
|---|---|---|
| Comparison with Poisson distribution Blue bars denote a histogram of data divided into 1 sec bins. Red curve is a Poisson curve with rate = median count rate of data. |
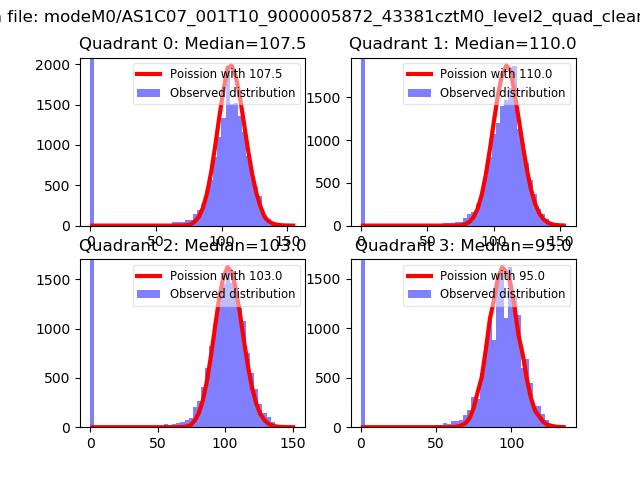 |
 |
| Quadrant-wise count rates Data is divided into 100 sec bins |
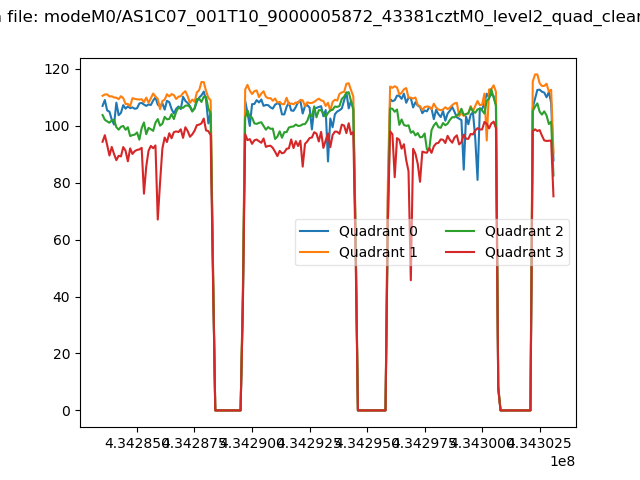 |
|
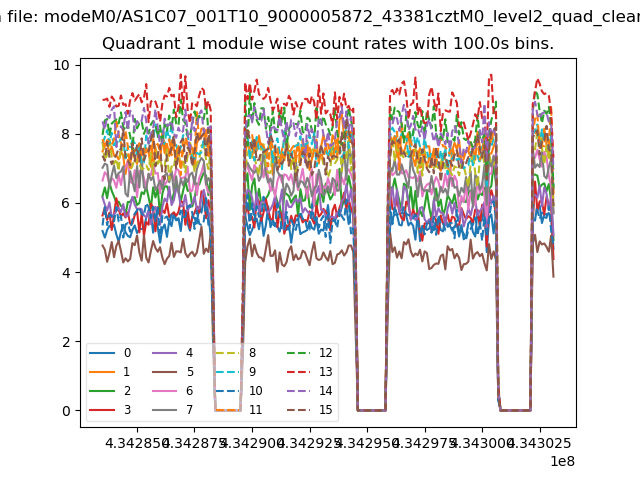
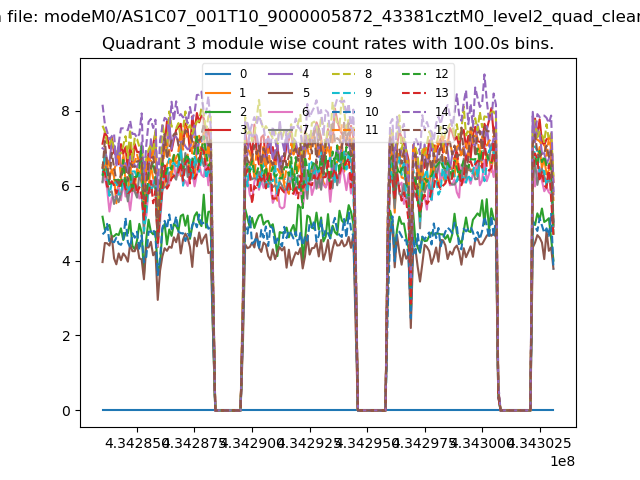
| Module-wise count rates for Quadrant A Data is divided into 100 sec bins |
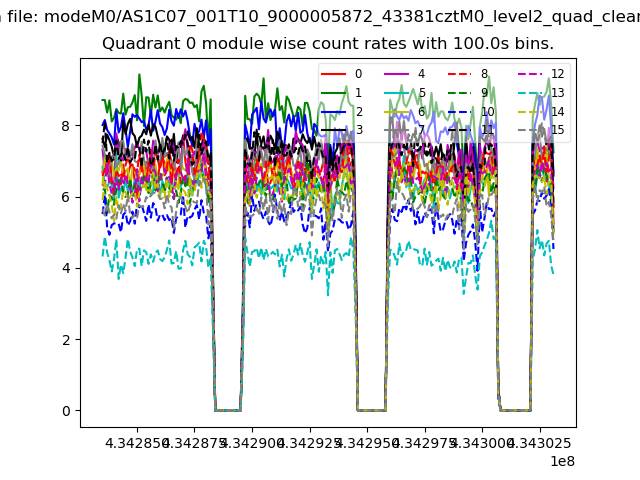 |
 |
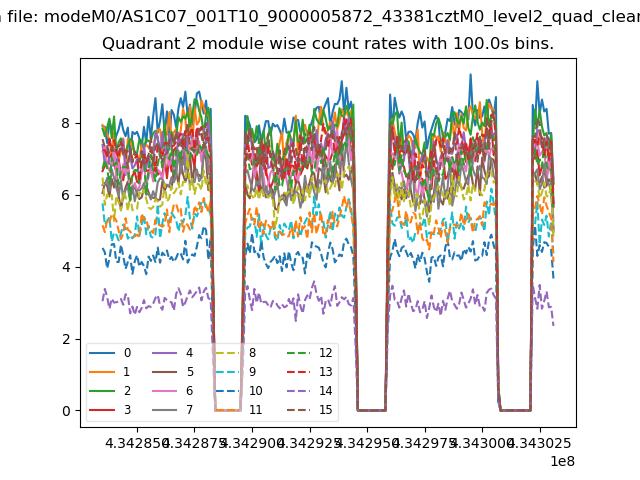
| Module-wise count rates for Quadrant B Data is divided into 100 sec bins |
 |
 |
| Module-wise count rates for Quadrant C Data is divided into 100 sec bins |
 |
 |
| Module-wise count rates for Quadrant D Data is divided into 100 sec bins |
 |
 |
| Parameter | Plot |
|---|---|
| CZT HV Monitor | 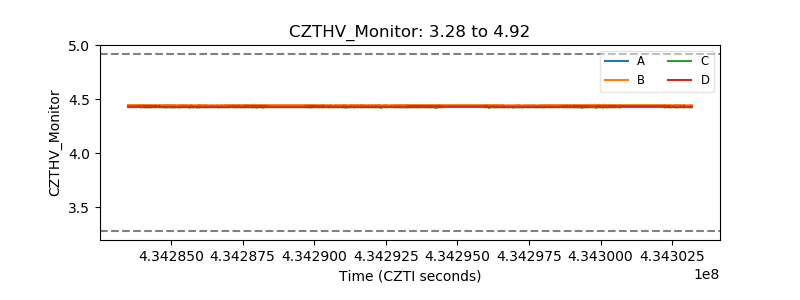 |
| D_VDD | 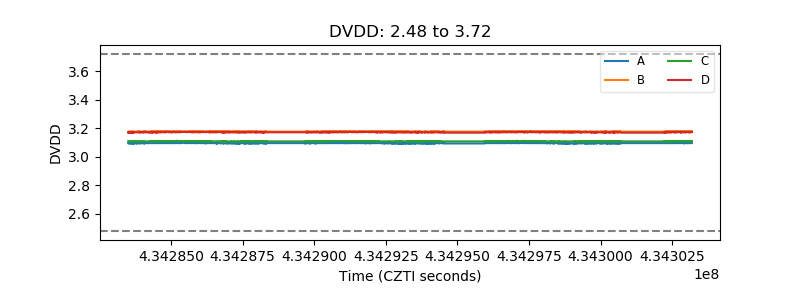 |
| Temperature 1 | 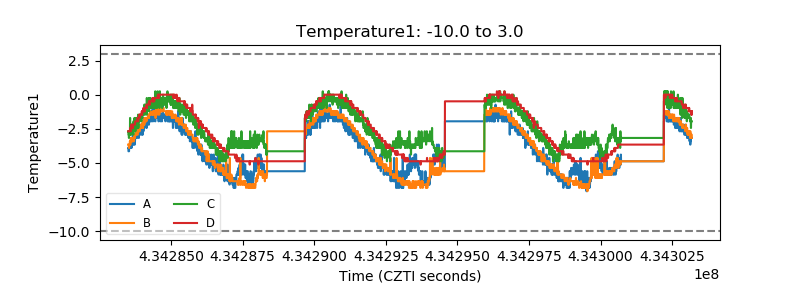 |
| Veto HV Monitor | 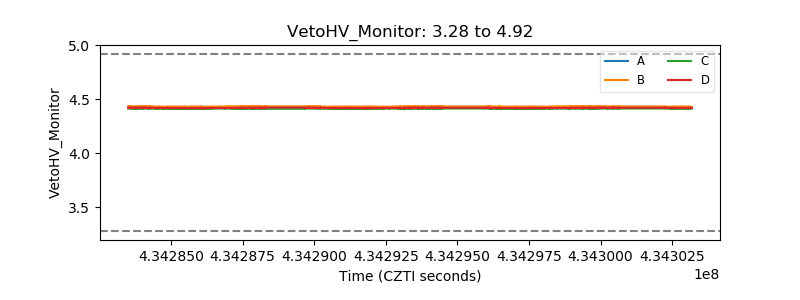 |
| Veto LLD | 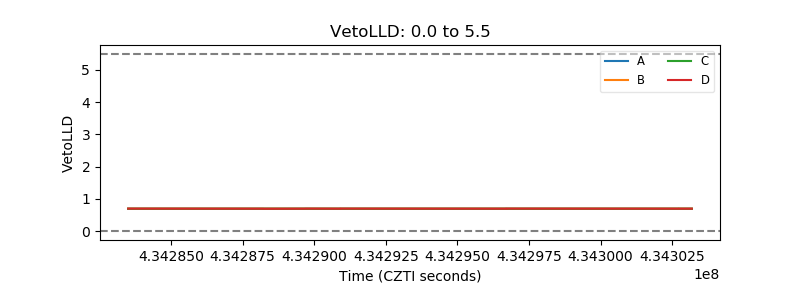 |
| Alpha Counter | 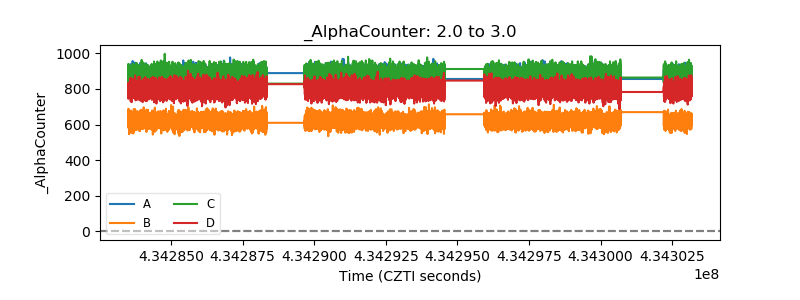 |
| _CPM_Rate | 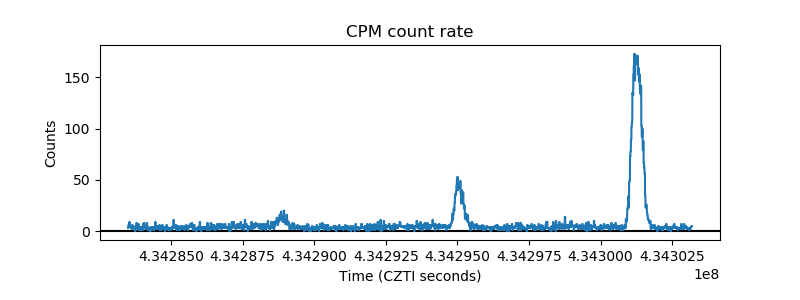 |
| CZT Counter | 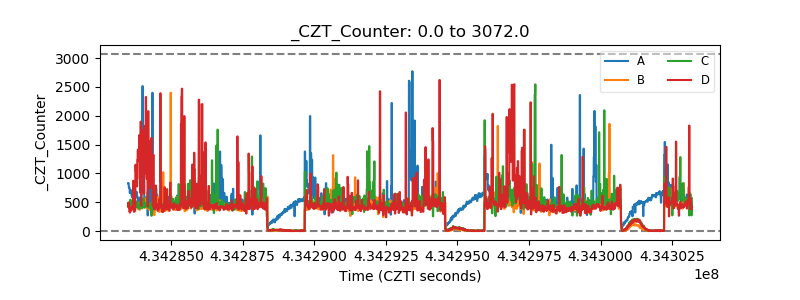 |
| +2.5 Volts monitor | 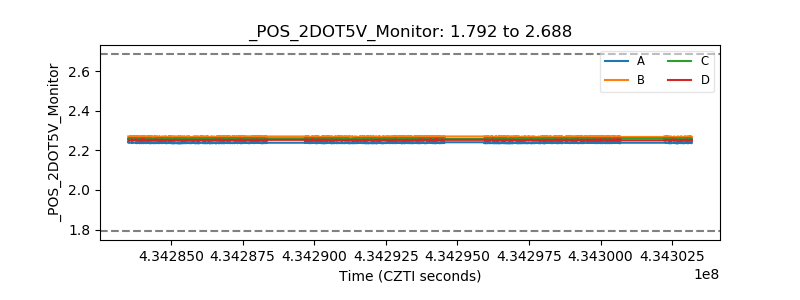 |
| +5 Volts monitor | 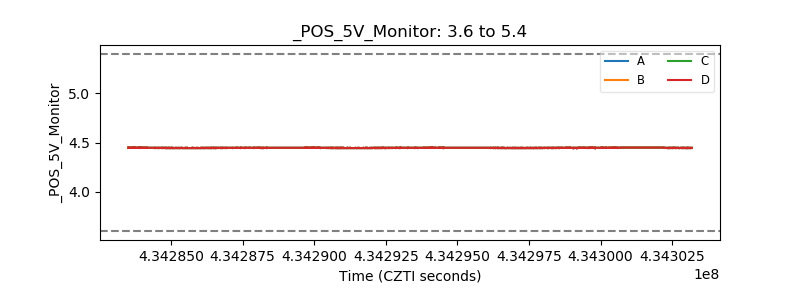 |
| _ROLL_ROT | 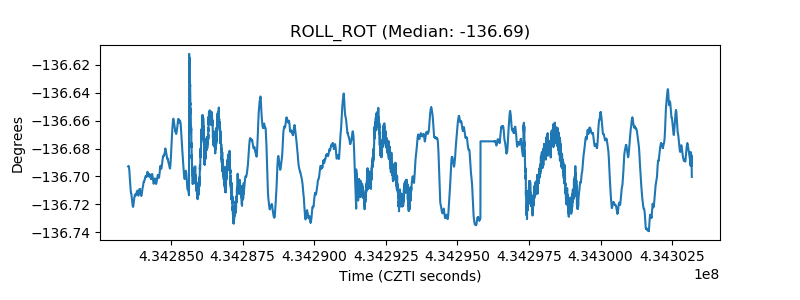 |
| _Roll_DEC |  |
| _Roll_RA | 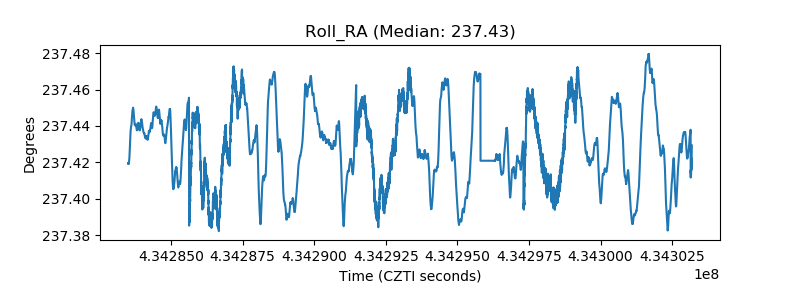 |
| Veto Counter | 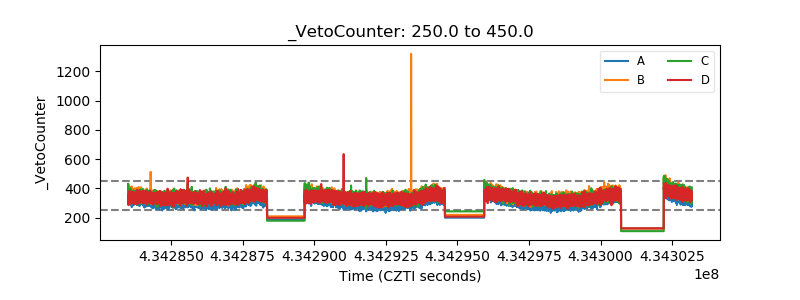 |