| Param | Original file | Final file |
|---|---|---|
| Filename | modeM0/AS1C07_001T10_9000005872_43382cztM0_level2.fits | modeM0/AS1C07_001T10_9000005872_43382cztM0_level2_quad_clean.evt |
| Size (bytes) | 325,483,200 | 89,259,840 |
| Size | 310.4 MB | 85.1 MB |
| Events in quadrant A | 3,107,703 | 594,558 |
| Events in quadrant B | 2,519,661 | 612,316 |
| Events in quadrant C | 3,156,647 | 576,256 |
| Events in quadrant D | 2,832,801 | 531,509 |
| Mode SS | |||
|---|---|---|---|
| Quadrant | BADHDUFLAG | Total packets | Discarded packets |
| A | 0 | 114 | 0 |
| B | 0 | 114 | 0 |
| C | 0 | 114 | 0 |
| D | 0 | 114 | 0 |
| Mode M9 | |||
|---|---|---|---|
| Quadrant | BADHDUFLAG | Total packets | Discarded packets |
| A | 0 | 22 | 0 |
| B | 0 | 23 | 0 |
| C | 0 | 23 | 0 |
| D | 0 | 23 | 0 |
| Mode M0 | |||
|---|---|---|---|
| Quadrant | BADHDUFLAG | Total packets | Discarded packets |
| A | 0 | 12660 | 2 |
| B | 0 | 11351 | 2 |
| C | 0 | 12806 | 2 |
| D | 0 | 12542 | 2 |
| Quadrant | Total seconds | Saturated seconds | Saturation percentage |
|---|---|---|---|
| A | 5539 | 49 | 0.884636% |
| B | 5539 | 5 | 0.090269% |
| C | 5539 | 30 | 0.541614% |
| D | 5539 | 95 | 1.715111% |
Noise dominated data is calculated using 1-second bins in cleaned event files. If a bin has >2000 counts, and if more than 50% of those come from <1% of pixels, then it is considered to be noise-dominated and hence unusable.
| Quadrant | # 1 sec bins | Bins with >0 counts | Bins with >2000 counts | High rate bins dominated by noise | Noise dominated (total time) | Noise dominated (detector-on time) | Marked lightcurve |
|---|---|---|---|---|---|---|---|
| A | 7182 | 5540 | 30 | 30 | 0.42% | 0.54% | 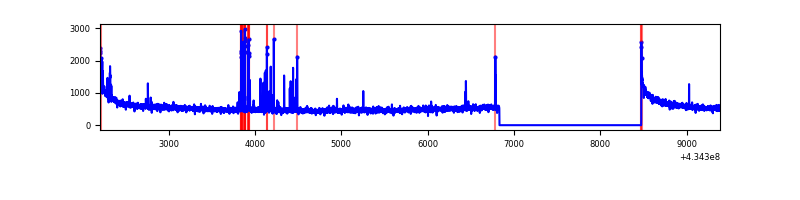 |
| B | 7182 | 5540 | 0 | 0 | 0.00% | 0.00% | 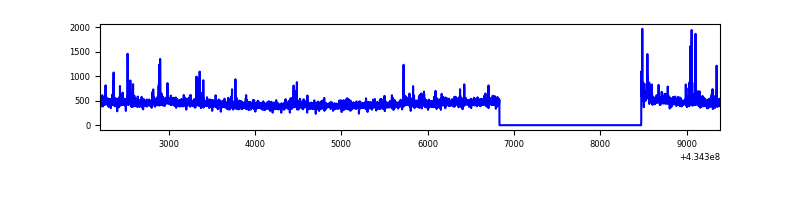 |
| C | 7182 | 5540 | 14 | 14 | 0.19% | 0.25% | 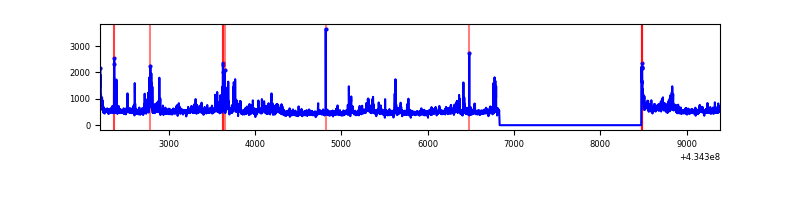 |
| D | 7182 | 5540 | 75 | 75 | 1.04% | 1.35% | 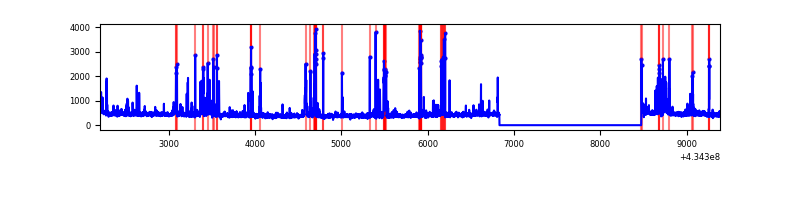 |
Top three noisy pixels from each quadrant. If the there are fewer than three noisy pixels in the level2.evt file, extra rows are filled as -1
| Pixel properties | Quadrant properties | ||||||
|---|---|---|---|---|---|---|---|
| Quadrant | DetID | PixID | Counts | Sigma | Mean | Median | Sigma |
| A | 10 | 83 | 645894 | 5330.47 | 592 | 579 | 121.1 |
| A | 15 | 237 | 125196 | 1029.37 | 592 | 579 | 121.1 |
| A | 12 | 238 | 22017 | 177.08 | 592 | 579 | 121.1 |
| B | 3 | 112 | 80767 | 694.02 | 594 | 578 | 115.5 |
| B | 0 | 189 | 30215 | 256.5 | 594 | 578 | 115.5 |
| B | 15 | 85 | 26863 | 227.49 | 594 | 578 | 115.5 |
| C | 3 | 233 | 602417 | 4438.76 | 582 | 585 | 135.6 |
| C | 15 | 214 | 231622 | 1703.99 | 582 | 585 | 135.6 |
| C | 14 | 254 | 27480 | 198.36 | 582 | 585 | 135.6 |
| D | 13 | 249 | 188453 | 1315.99 | 581 | 563 | 142.8 |
| D | 12 | 218 | 180614 | 1261.09 | 581 | 563 | 142.8 |
| D | 1 | 52 | 98878 | 688.6 | 581 | 563 | 142.8 |
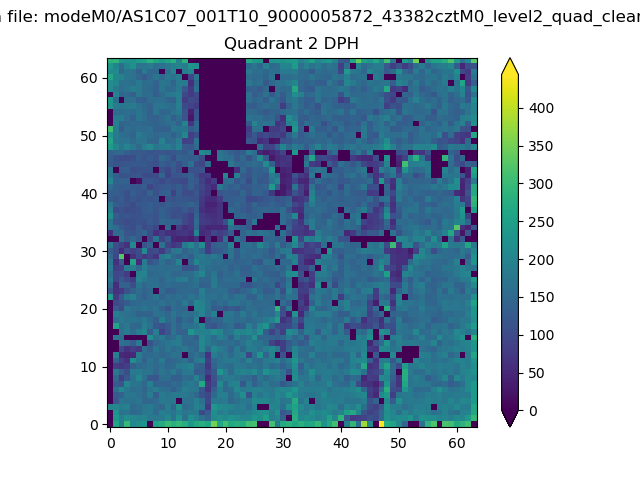
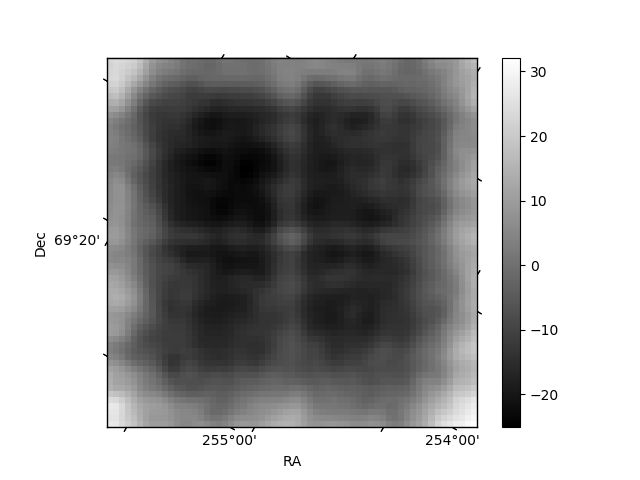
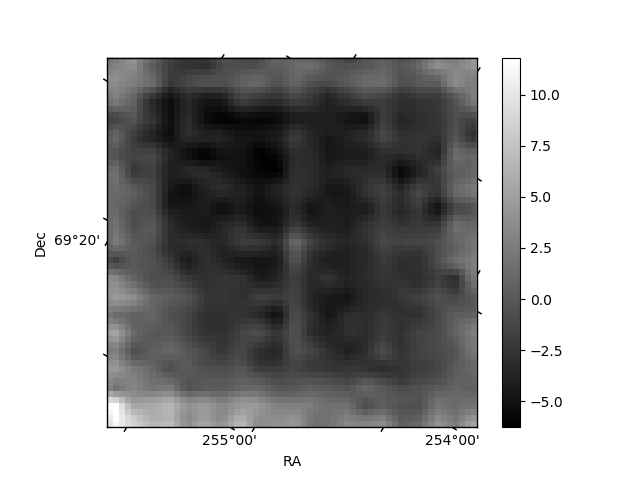
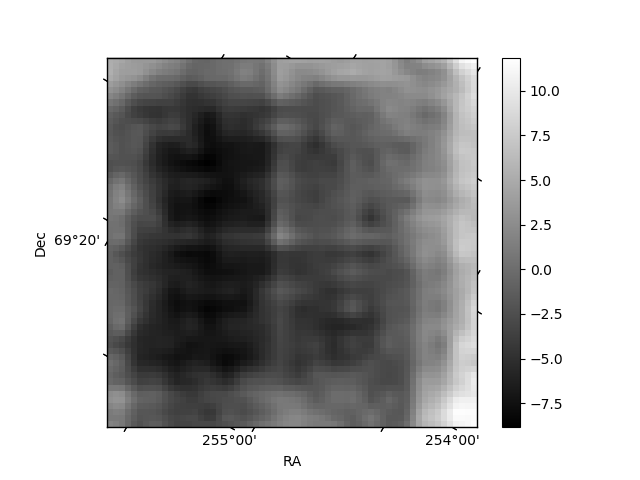
Histogram calculated using DETX and DETY for each event in the final _common_clean file
| Quadrant A | 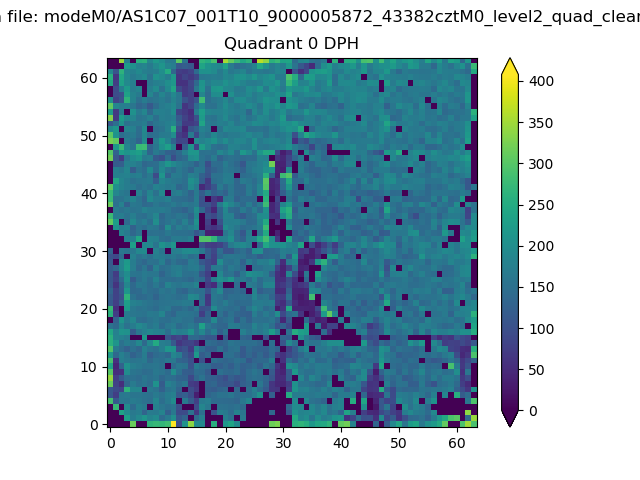 |
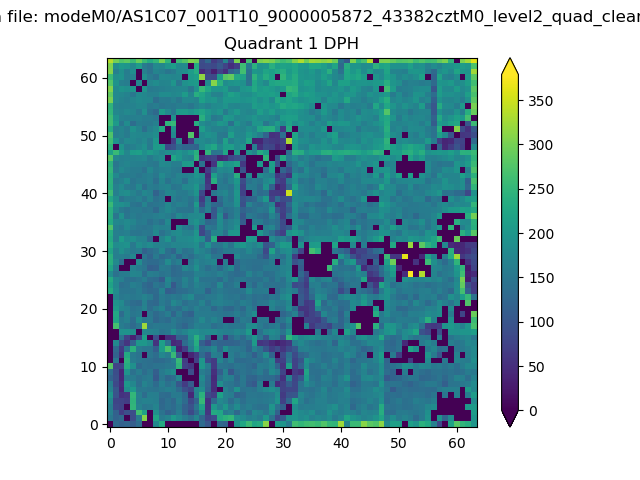 |
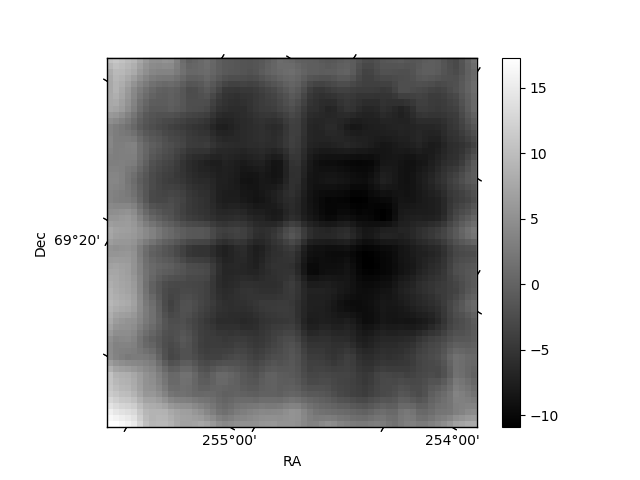
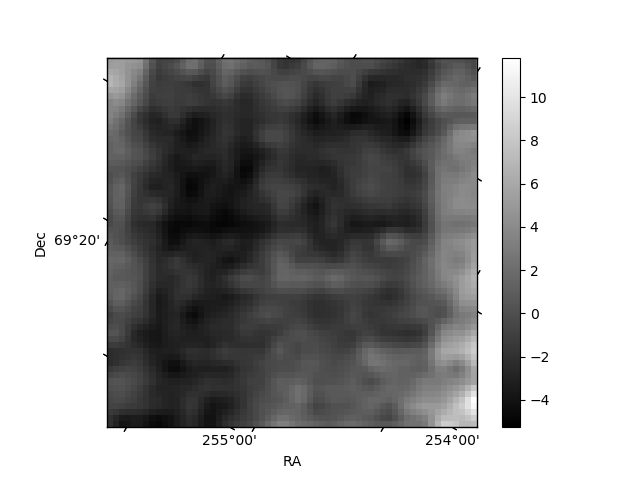
Quadrant B |
|---|---|---|---|
| Quadrant D | 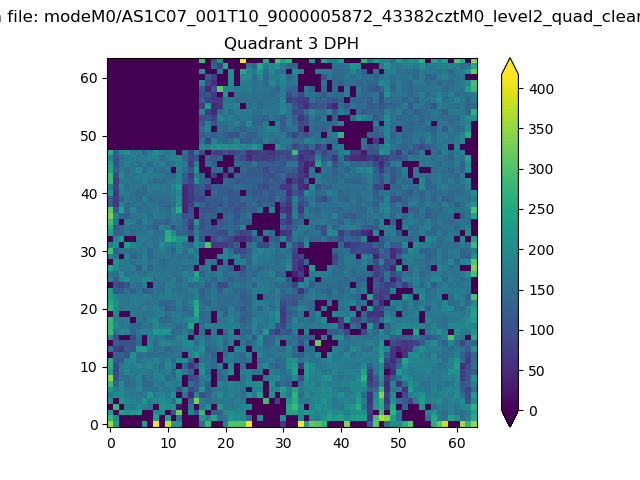 |
 |
Quadrant C |
| Plot type | Count rate plots | Images |
|---|---|---|
| Comparison with Poisson distribution Blue bars denote a histogram of data divided into 1 sec bins. Red curve is a Poisson curve with rate = median count rate of data. |
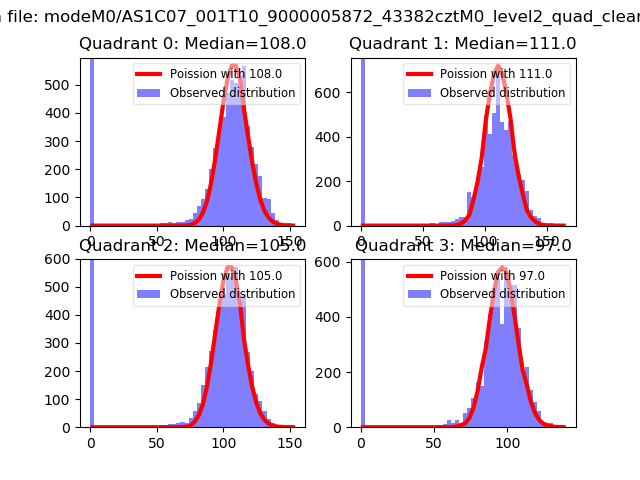 |
 |
| Quadrant-wise count rates Data is divided into 100 sec bins |
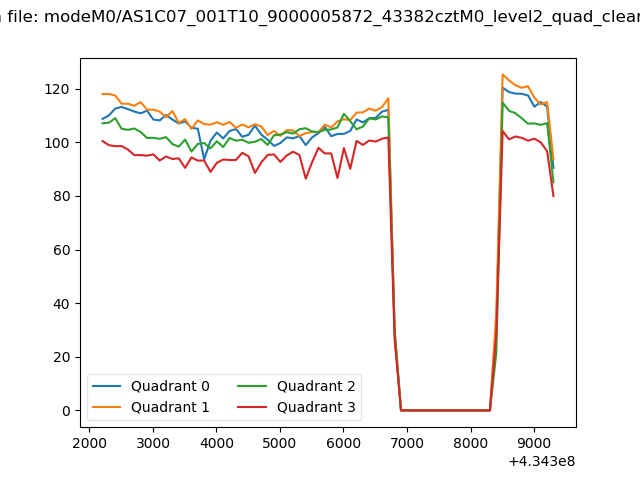 |
|
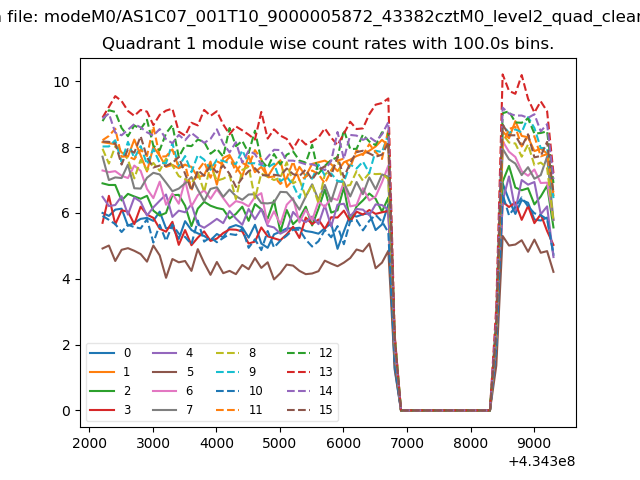
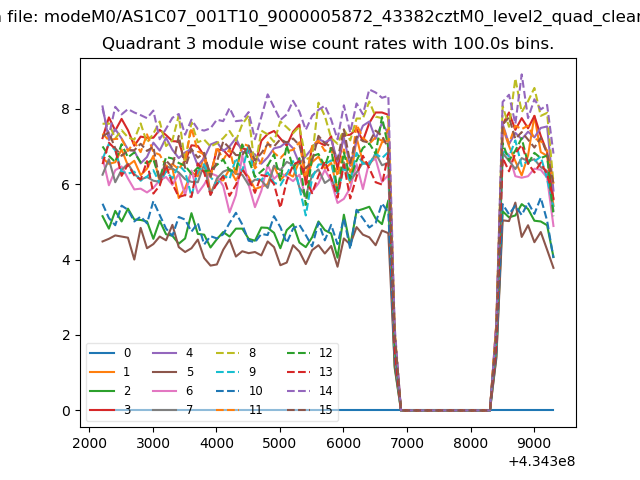
| Module-wise count rates for Quadrant A Data is divided into 100 sec bins |
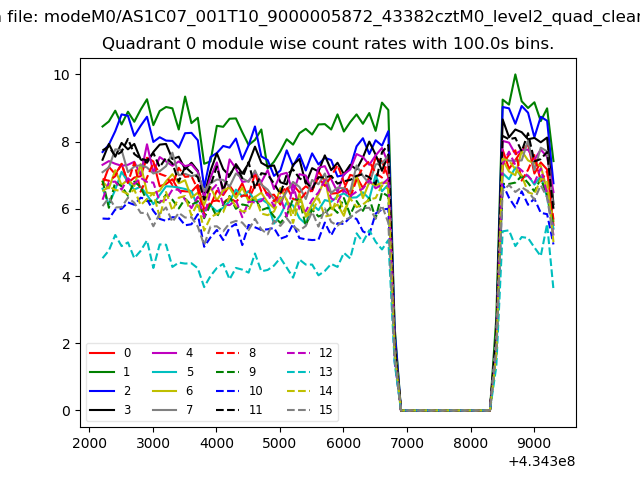 |
 |
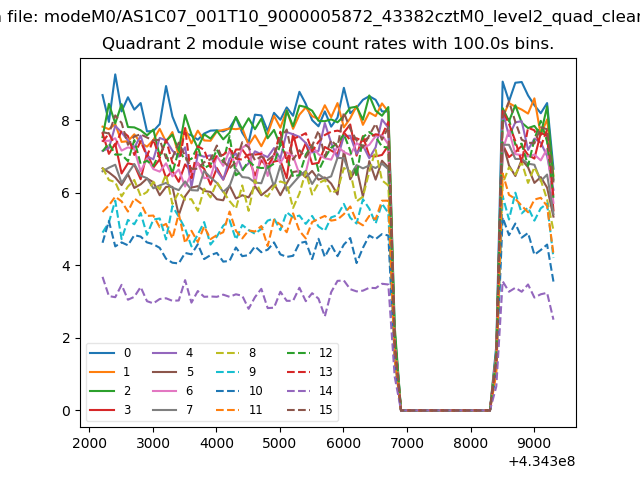
| Module-wise count rates for Quadrant B Data is divided into 100 sec bins |
 |
 |
| Module-wise count rates for Quadrant C Data is divided into 100 sec bins |
 |
 |
| Module-wise count rates for Quadrant D Data is divided into 100 sec bins |
 |
 |
| Parameter | Plot |
|---|---|
| CZT HV Monitor | 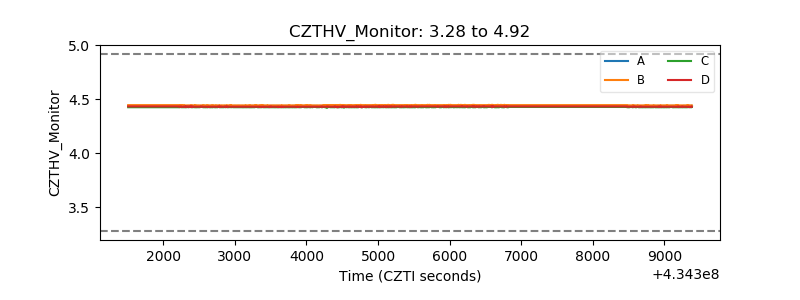 |
| D_VDD | 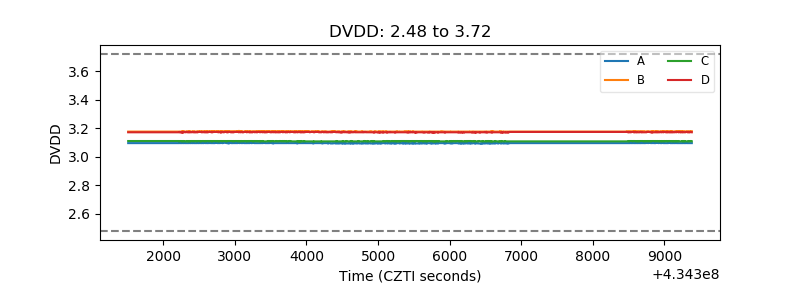 |
| Temperature 1 | 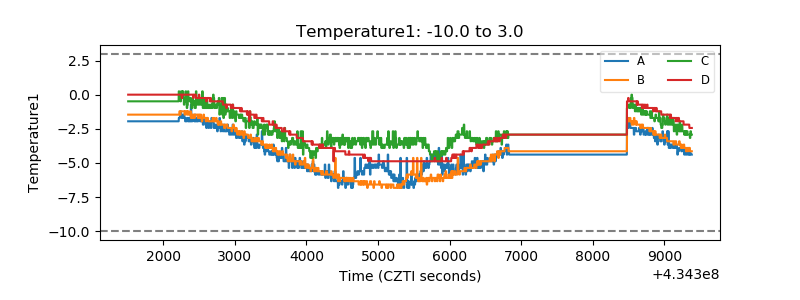 |
| Veto HV Monitor | 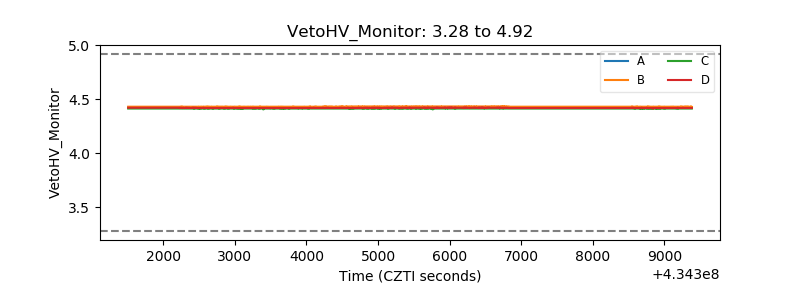 |
| Veto LLD | 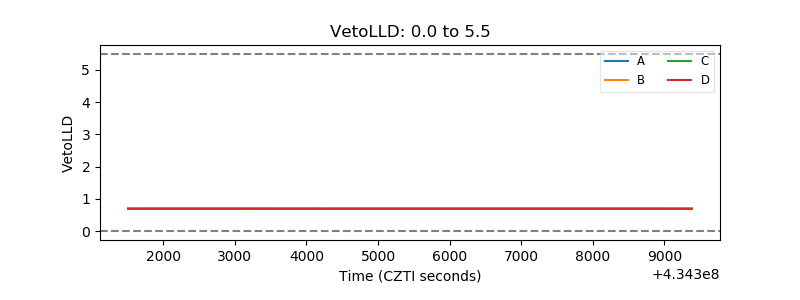 |
| Alpha Counter | 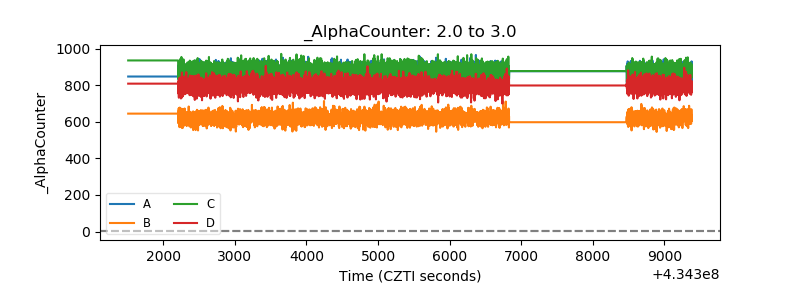 |
| _CPM_Rate | 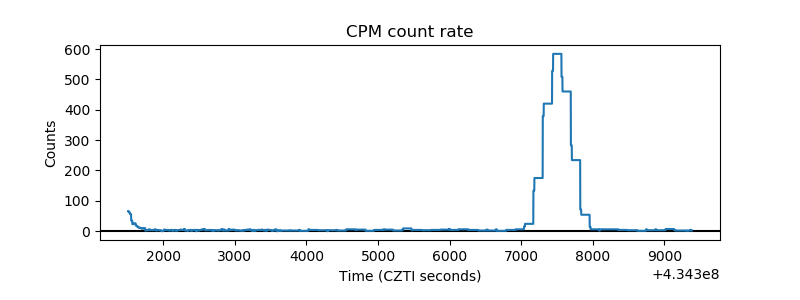 |
| CZT Counter | 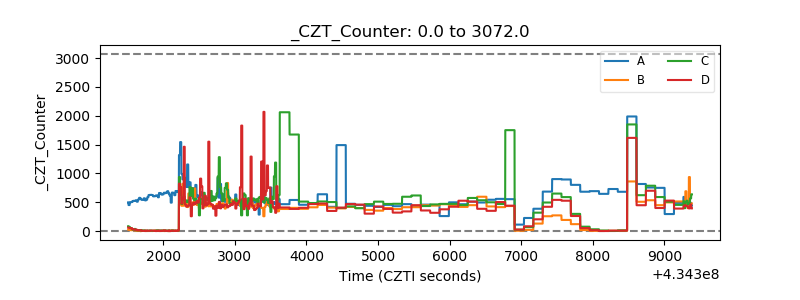 |
| +2.5 Volts monitor | 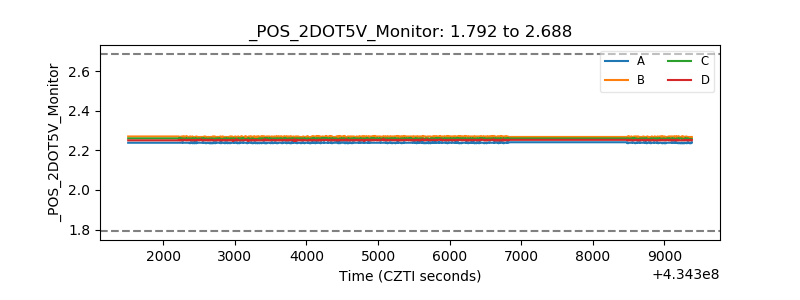 |
| +5 Volts monitor | 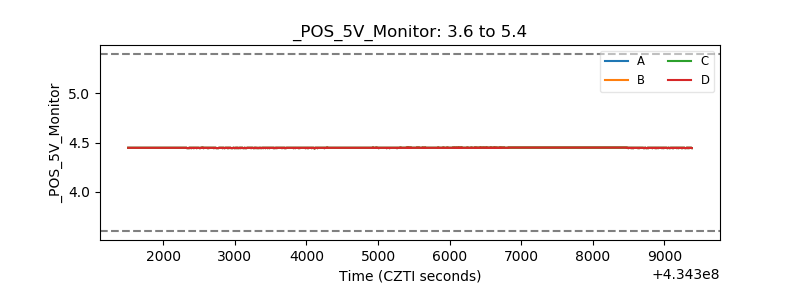 |
| _ROLL_ROT |  |
| _Roll_DEC | 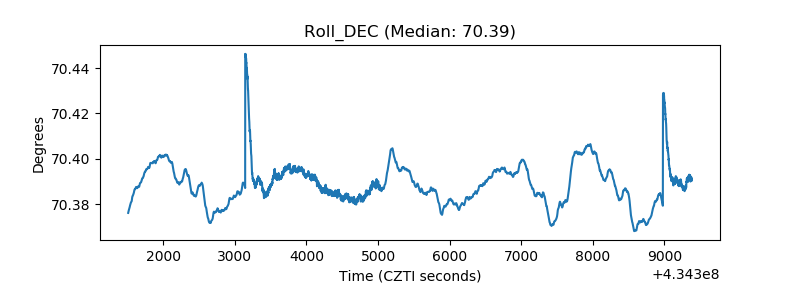 |
| _Roll_RA | 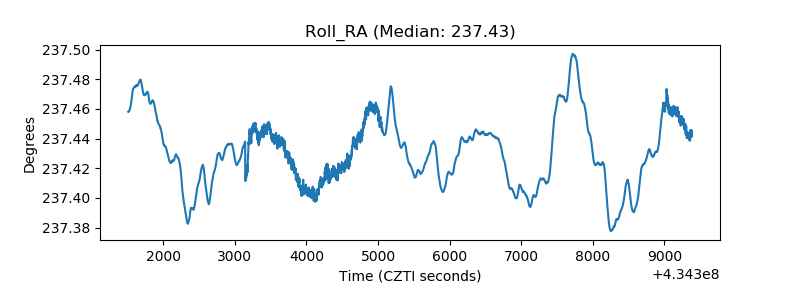 |
| Veto Counter | 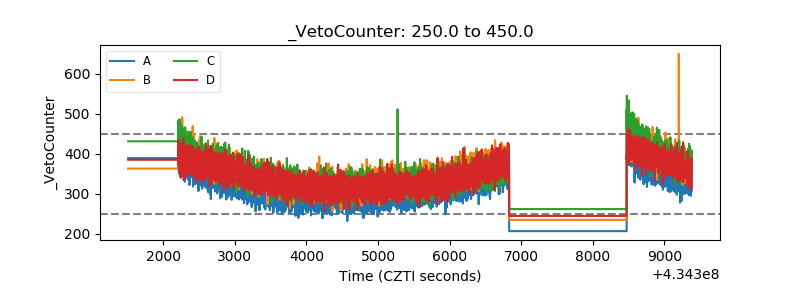 |