| Param | Original file | Final file |
|---|---|---|
| Filename | modeM0/AS1C07_001T10_9000005872_43384cztM0_level2.fits | modeM0/AS1C07_001T10_9000005872_43384cztM0_level2_quad_clean.evt |
| Size (bytes) | 323,038,080 | 88,194,240 |
| Size | 308.1 MB | 84.1 MB |
| Events in quadrant A | 3,137,685 | 588,516 |
| Events in quadrant B | 2,449,955 | 610,191 |
| Events in quadrant C | 3,150,942 | 574,185 |
| Events in quadrant D | 2,801,259 | 522,391 |
| Mode SS | |||
|---|---|---|---|
| Quadrant | BADHDUFLAG | Total packets | Discarded packets |
| A | 0 | 108 | 0 |
| B | 0 | 108 | 0 |
| C | 0 | 108 | 0 |
| D | 0 | 108 | 0 |
| Mode M9 | |||
|---|---|---|---|
| Quadrant | BADHDUFLAG | Total packets | Discarded packets |
| A | 0 | 26 | 0 |
| B | 0 | 27 | 0 |
| C | 0 | 27 | 0 |
| D | 0 | 27 | 0 |
| Mode M0 | |||
|---|---|---|---|
| Quadrant | BADHDUFLAG | Total packets | Discarded packets |
| A | 0 | 12688 | 2 |
| B | 0 | 11108 | 2 |
| C | 0 | 12972 | 2 |
| D | 0 | 12384 | 3 |
| Quadrant | Total seconds | Saturated seconds | Saturation percentage |
|---|---|---|---|
| A | 5363 | 69 | 1.286593% |
| B | 5363 | 15 | 0.279694% |
| C | 5363 | 47 | 0.876375% |
| D | 5362 | 156 | 2.909362% |
Noise dominated data is calculated using 1-second bins in cleaned event files. If a bin has >2000 counts, and if more than 50% of those come from <1% of pixels, then it is considered to be noise-dominated and hence unusable.
| Quadrant | # 1 sec bins | Bins with >0 counts | Bins with >2000 counts | High rate bins dominated by noise | Noise dominated (total time) | Noise dominated (detector-on time) | Marked lightcurve |
|---|---|---|---|---|---|---|---|
| A | 7096 | 5364 | 46 | 46 | 0.65% | 0.86% | 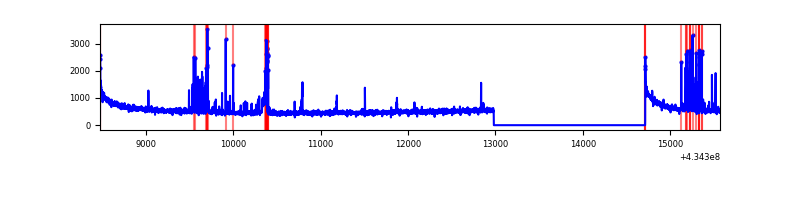 |
| B | 7096 | 5364 | 5 | 5 | 0.07% | 0.09% | 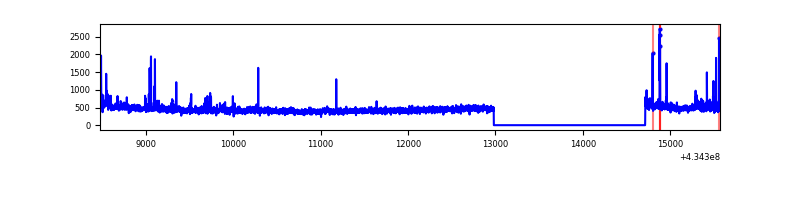 |
| C | 7096 | 5364 | 29 | 29 | 0.41% | 0.54% | 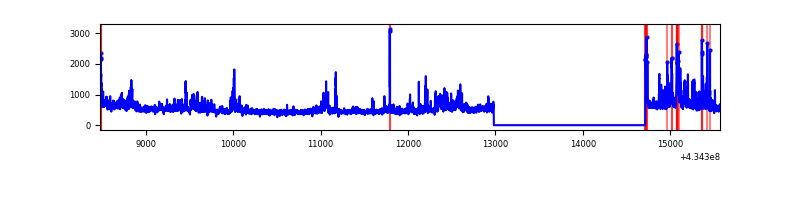 |
| D | 7095 | 5363 | 140 | 140 | 1.97% | 2.61% | 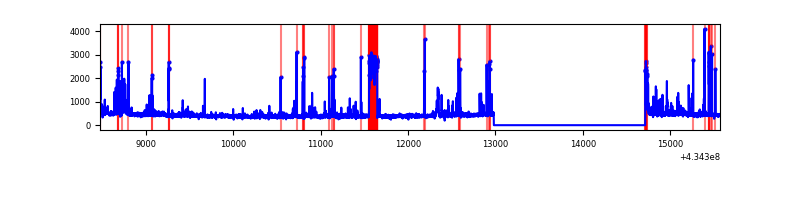 |
Top three noisy pixels from each quadrant. If the there are fewer than three noisy pixels in the level2.evt file, extra rows are filled as -1
| Pixel properties | Quadrant properties | ||||||
|---|---|---|---|---|---|---|---|
| Quadrant | DetID | PixID | Counts | Sigma | Mean | Median | Sigma |
| A | 10 | 83 | 611373 | 5184.28 | 574 | 561 | 117.8 |
| A | 15 | 237 | 263898 | 2235.08 | 574 | 561 | 117.8 |
| A | 13 | 6 | 21107 | 174.38 | 574 | 561 | 117.8 |
| B | 3 | 112 | 65173 | 583.53 | 577 | 560 | 110.7 |
| B | 15 | 85 | 41694 | 371.49 | 577 | 560 | 110.7 |
| B | 0 | 189 | 31140 | 276.17 | 577 | 560 | 110.7 |
| C | 3 | 233 | 629322 | 4730.44 | 566 | 568 | 132.9 |
| C | 15 | 214 | 222248 | 1667.81 | 566 | 568 | 132.9 |
| C | 12 | 249 | 38417 | 284.76 | 566 | 568 | 132.9 |
| D | 13 | 249 | 283818 | 2088.23 | 558 | 542 | 135.7 |
| D | 12 | 233 | 95712 | 701.57 | 558 | 542 | 135.7 |
| D | 1 | 52 | 89031 | 652.32 | 558 | 542 | 135.7 |
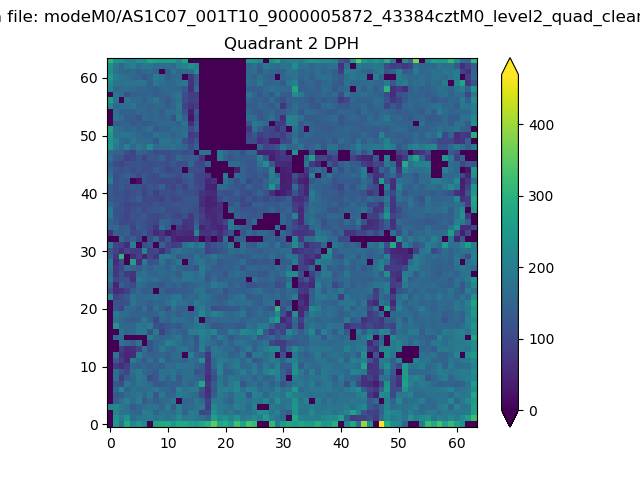
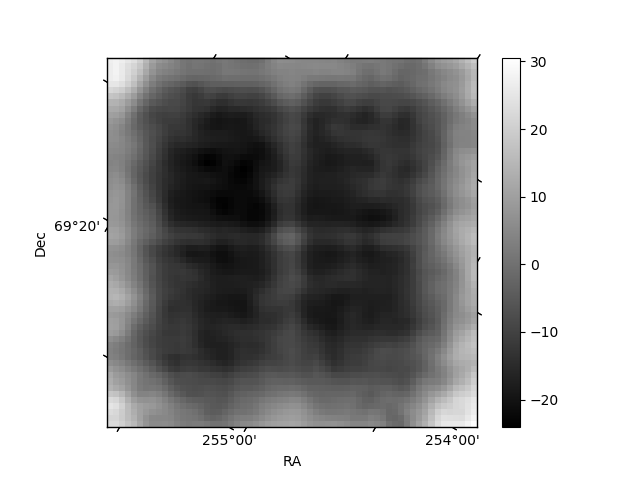
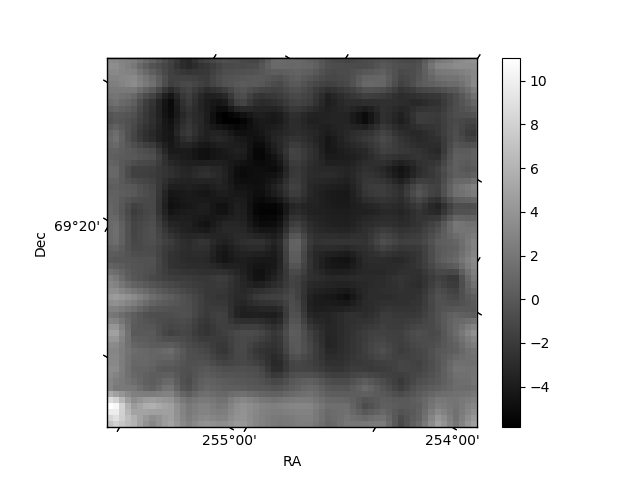
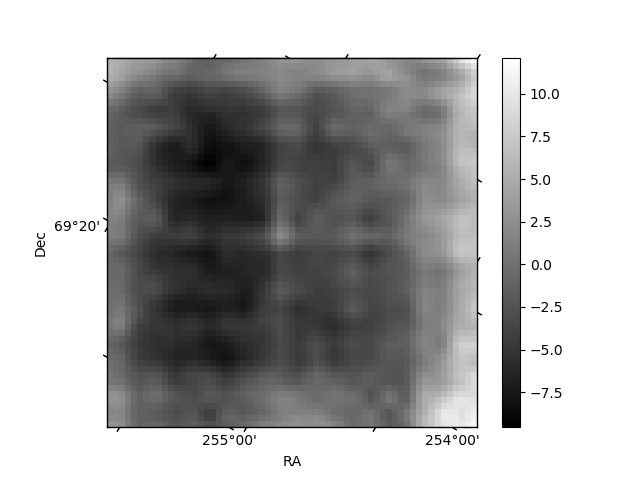
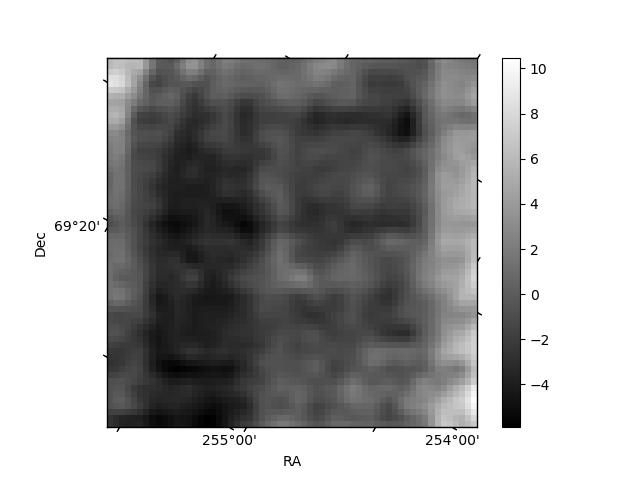
Histogram calculated using DETX and DETY for each event in the final _common_clean file
| Quadrant A | 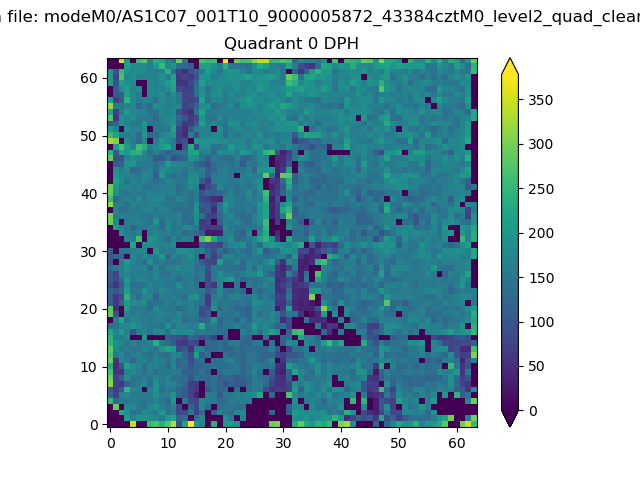 |
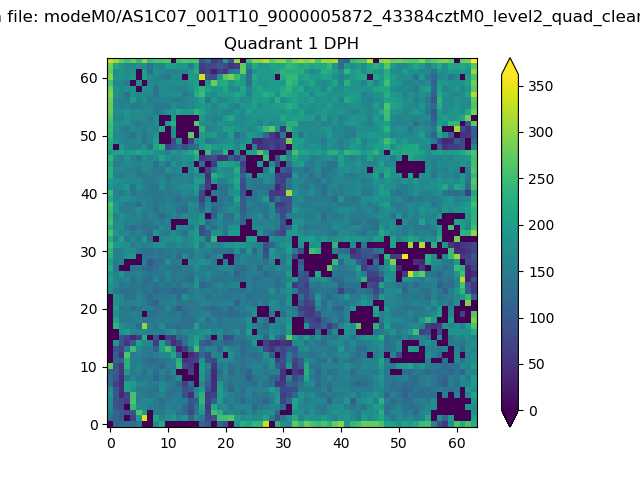 |
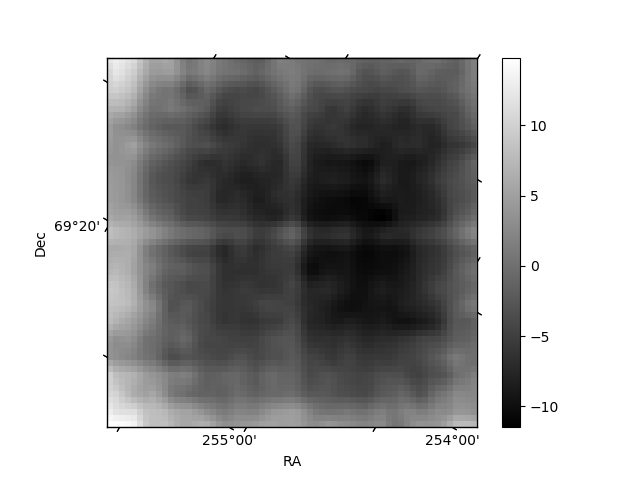
Quadrant B |
|---|---|---|---|
| Quadrant D | 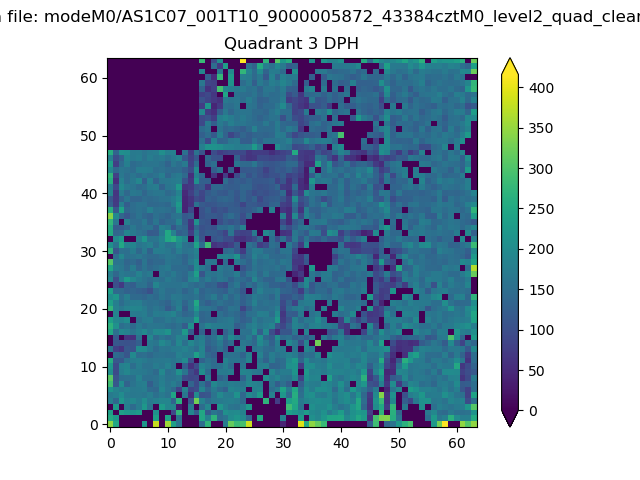 |
 |
Quadrant C |
| Plot type | Count rate plots | Images |
|---|---|---|
| Comparison with Poisson distribution Blue bars denote a histogram of data divided into 1 sec bins. Red curve is a Poisson curve with rate = median count rate of data. |
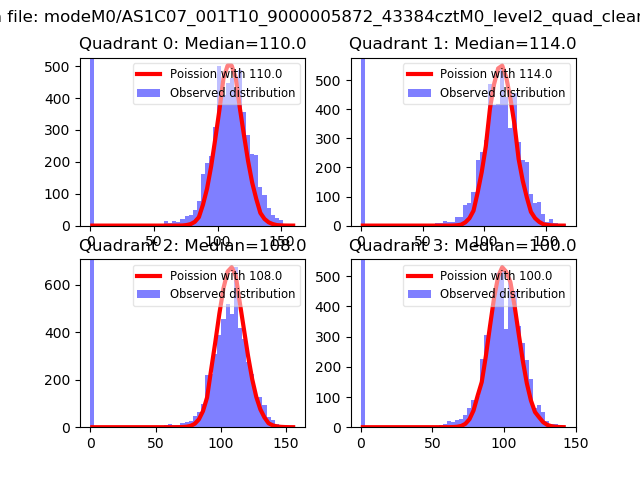 |
 |
| Quadrant-wise count rates Data is divided into 100 sec bins |
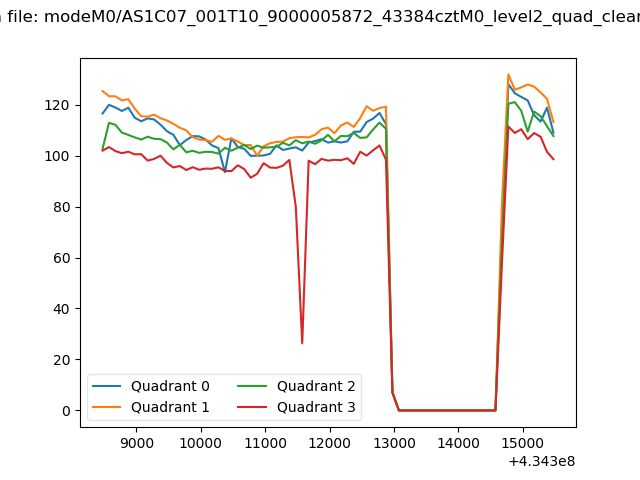 |
|
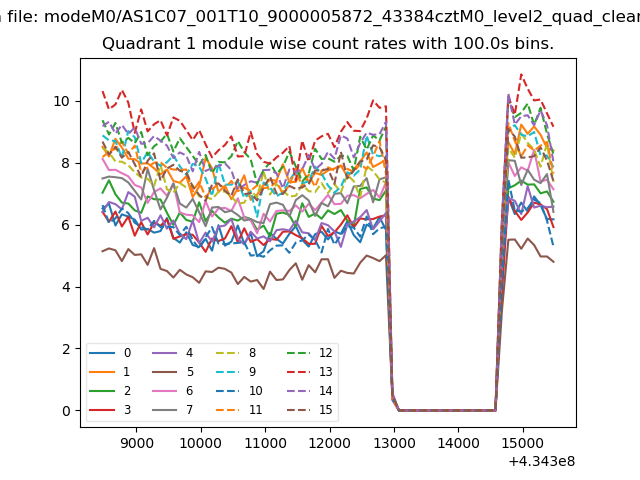
| Module-wise count rates for Quadrant A Data is divided into 100 sec bins |
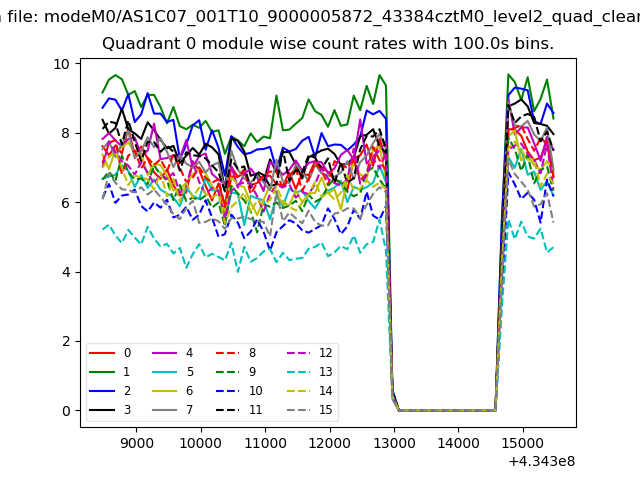 |
 |
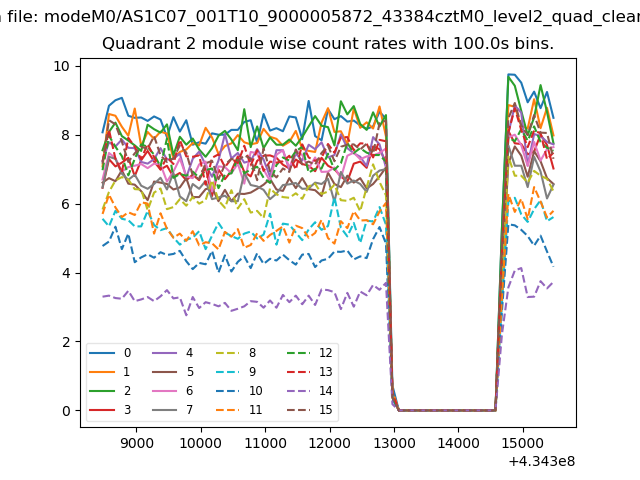
| Module-wise count rates for Quadrant B Data is divided into 100 sec bins |
 |
 |
| Module-wise count rates for Quadrant C Data is divided into 100 sec bins |
 |
 |
| Module-wise count rates for Quadrant D Data is divided into 100 sec bins |
 |
 |
| Parameter | Plot |
|---|---|
| CZT HV Monitor | 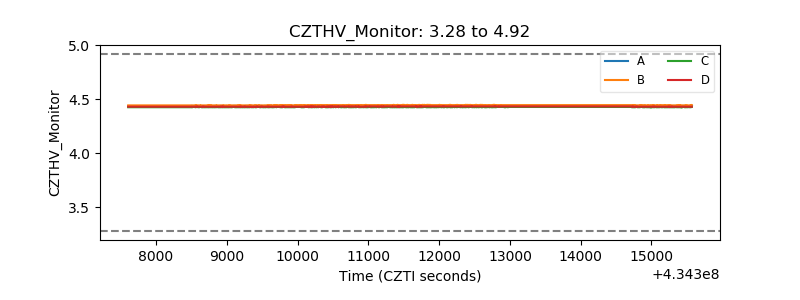 |
| D_VDD | 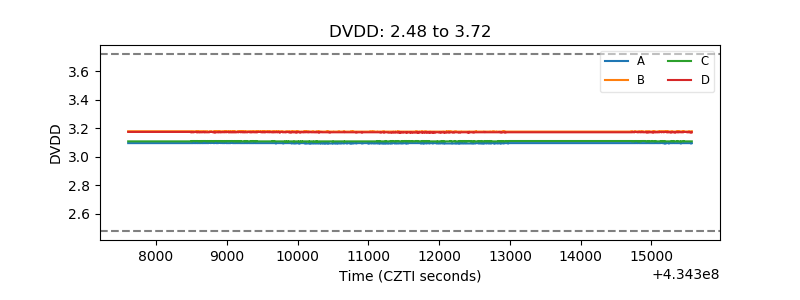 |
| Temperature 1 | 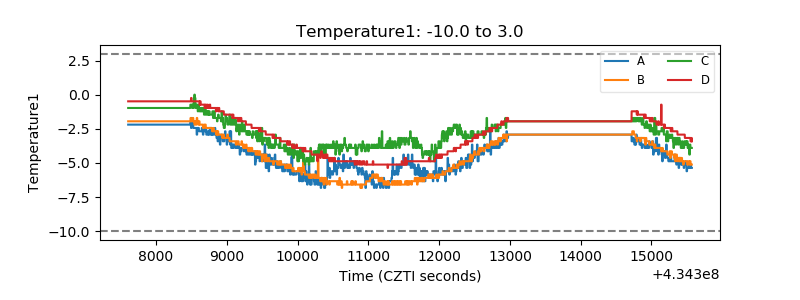 |
| Veto HV Monitor | 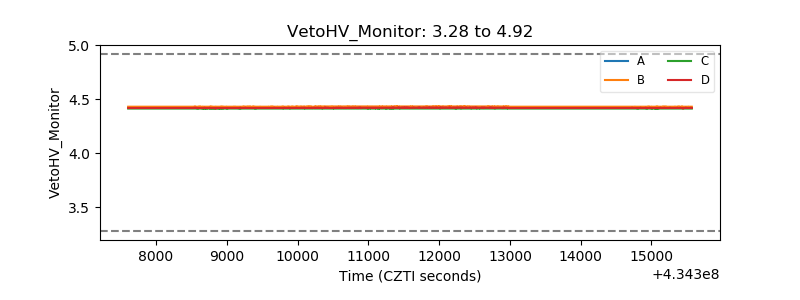 |
| Veto LLD | 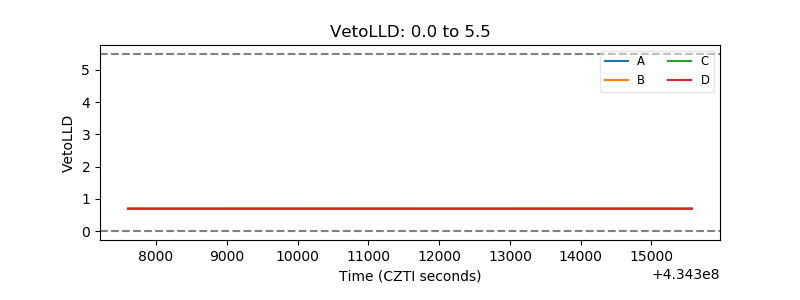 |
| Alpha Counter | 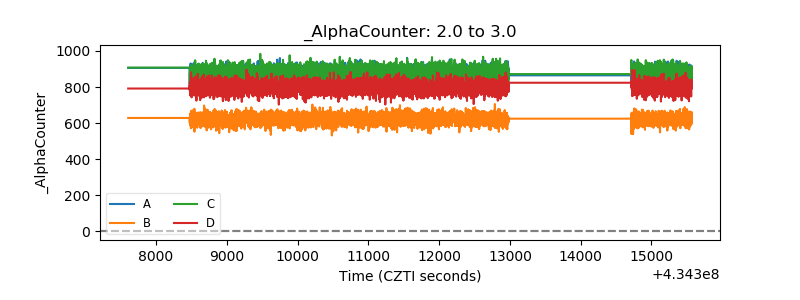 |
| _CPM_Rate | 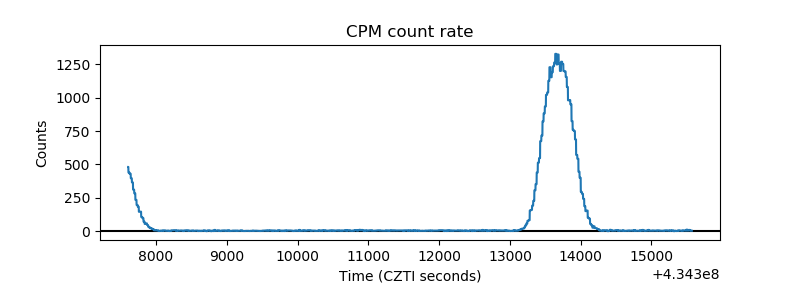 |
| CZT Counter | 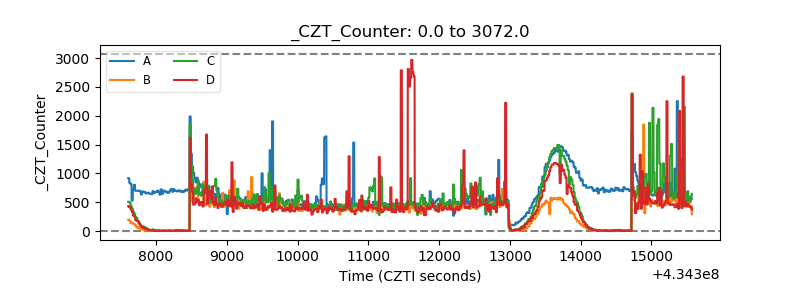 |
| +2.5 Volts monitor | 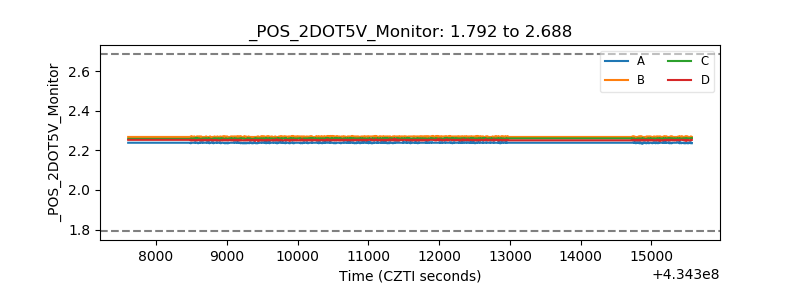 |
| +5 Volts monitor | 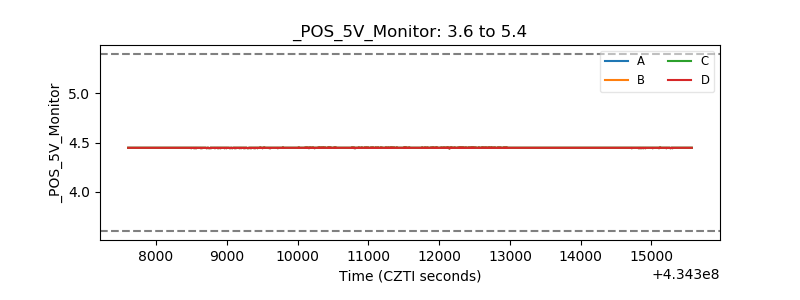 |
| _ROLL_ROT | 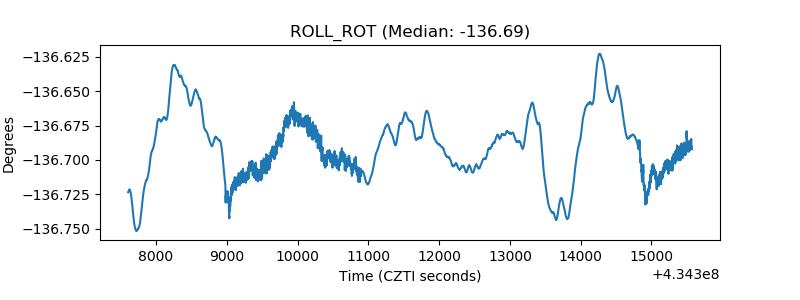 |
| _Roll_DEC | 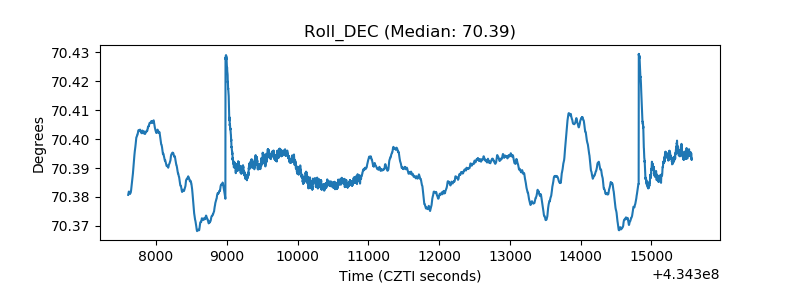 |
| _Roll_RA | 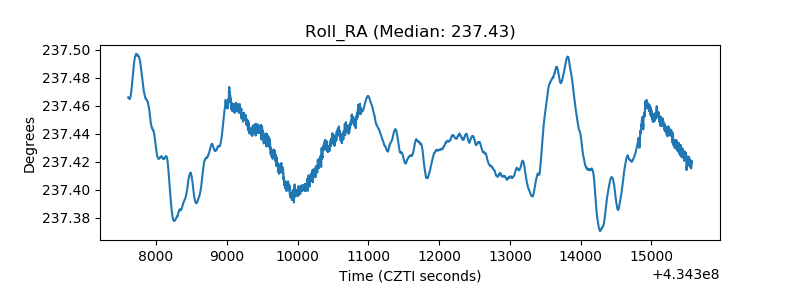 |
| Veto Counter | 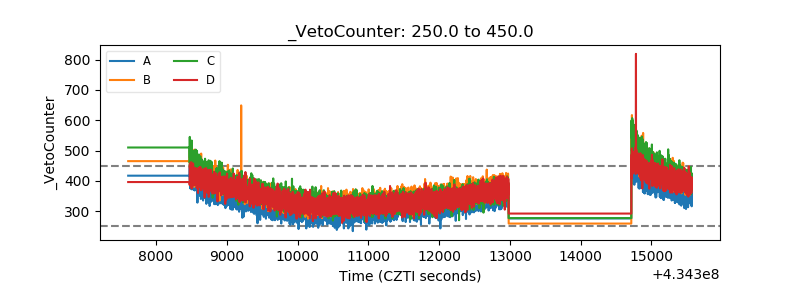 |