| Param | Original file | Final file |
|---|---|---|
| Filename | modeM0/AS1C07_001T10_9000005872_43385cztM0_level2.fits | modeM0/AS1C07_001T10_9000005872_43385cztM0_level2_quad_clean.evt |
| Size (bytes) | 323,184,960 | 89,507,520 |
| Size | 308.2 MB | 85.4 MB |
| Events in quadrant A | 3,145,369 | 593,474 |
| Events in quadrant B | 2,392,961 | 621,624 |
| Events in quadrant C | 3,138,205 | 589,915 |
| Events in quadrant D | 2,876,865 | 537,133 |
| Mode SS | |||
|---|---|---|---|
| Quadrant | BADHDUFLAG | Total packets | Discarded packets |
| A | 0 | 106 | 0 |
| B | 0 | 106 | 0 |
| C | 0 | 106 | 0 |
| D | 0 | 106 | 0 |
| Mode M9 | |||
|---|---|---|---|
| Quadrant | BADHDUFLAG | Total packets | Discarded packets |
| A | 0 | 29 | 0 |
| B | 0 | 30 | 0 |
| C | 0 | 30 | 0 |
| D | 0 | 30 | 0 |
| Mode M0 | |||
|---|---|---|---|
| Quadrant | BADHDUFLAG | Total packets | Discarded packets |
| A | 0 | 12663 | 2 |
| B | 0 | 10831 | 2 |
| C | 0 | 12770 | 3 |
| D | 0 | 12488 | 2 |
| Quadrant | Total seconds | Saturated seconds | Saturation percentage |
|---|---|---|---|
| A | 5261 | 90 | 1.710701% |
| B | 5261 | 21 | 0.399164% |
| C | 5260 | 47 | 0.893536% |
| D | 5260 | 122 | 2.319392% |
Noise dominated data is calculated using 1-second bins in cleaned event files. If a bin has >2000 counts, and if more than 50% of those come from <1% of pixels, then it is considered to be noise-dominated and hence unusable.
| Quadrant | # 1 sec bins | Bins with >0 counts | Bins with >2000 counts | High rate bins dominated by noise | Noise dominated (total time) | Noise dominated (detector-on time) | Marked lightcurve |
|---|---|---|---|---|---|---|---|
| A | 7144 | 5262 | 67 | 67 | 0.94% | 1.27% | 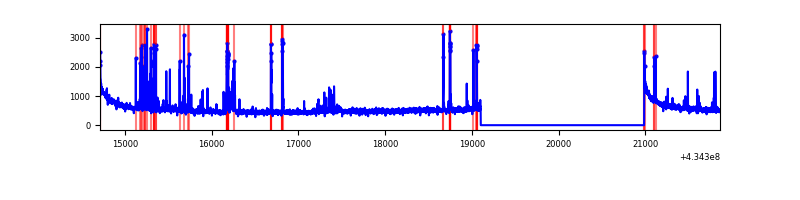 |
| B | 7144 | 5262 | 11 | 11 | 0.15% | 0.21% | 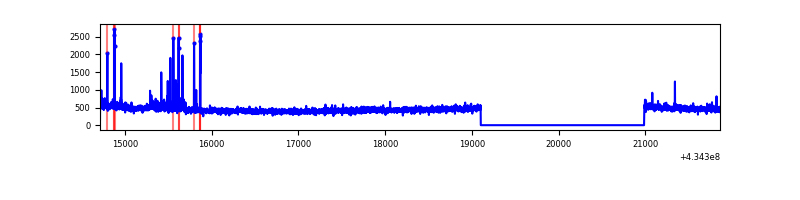 |
| C | 7143 | 5261 | 33 | 33 | 0.46% | 0.63% | 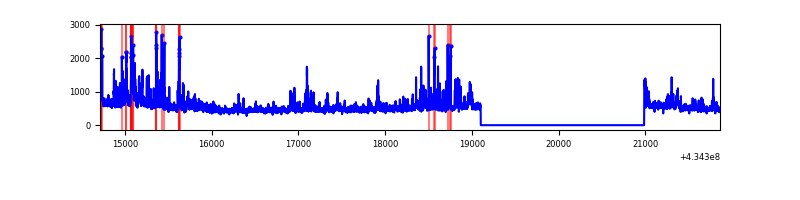 |
| D | 7143 | 5261 | 112 | 112 | 1.57% | 2.13% | 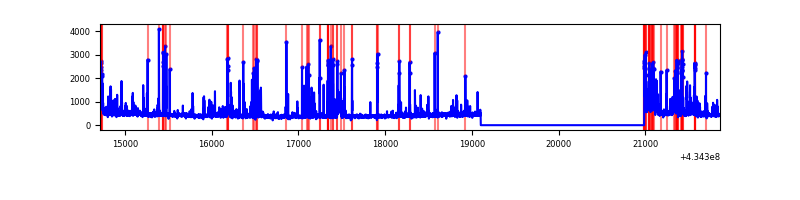 |
Top three noisy pixels from each quadrant. If the there are fewer than three noisy pixels in the level2.evt file, extra rows are filled as -1
| Pixel properties | Quadrant properties | ||||||
|---|---|---|---|---|---|---|---|
| Quadrant | DetID | PixID | Counts | Sigma | Mean | Median | Sigma |
| A | 10 | 83 | 579263 | 4999.61 | 565 | 554 | 115.8 |
| A | 15 | 237 | 338946 | 2923.45 | 565 | 554 | 115.8 |
| A | 13 | 6 | 16907 | 141.28 | 565 | 554 | 115.8 |
| B | 5 | 172 | 45983 | 412.77 | 573 | 557 | 110.1 |
| B | 3 | 112 | 33662 | 300.82 | 573 | 557 | 110.1 |
| B | 15 | 85 | 24293 | 215.68 | 573 | 557 | 110.1 |
| C | 3 | 233 | 599334 | 4588.0 | 563 | 566 | 130.5 |
| C | 15 | 214 | 216728 | 1656.32 | 563 | 566 | 130.5 |
| C | 0 | 239 | 67440 | 512.42 | 563 | 566 | 130.5 |
| D | 12 | 218 | 182056 | 1331.38 | 556 | 539 | 136.3 |
| D | 1 | 52 | 136338 | 996.05 | 556 | 539 | 136.3 |
| D | 13 | 249 | 129793 | 948.05 | 556 | 539 | 136.3 |
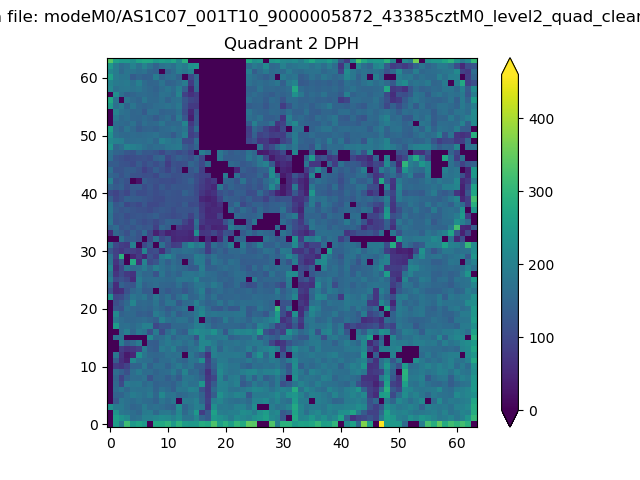
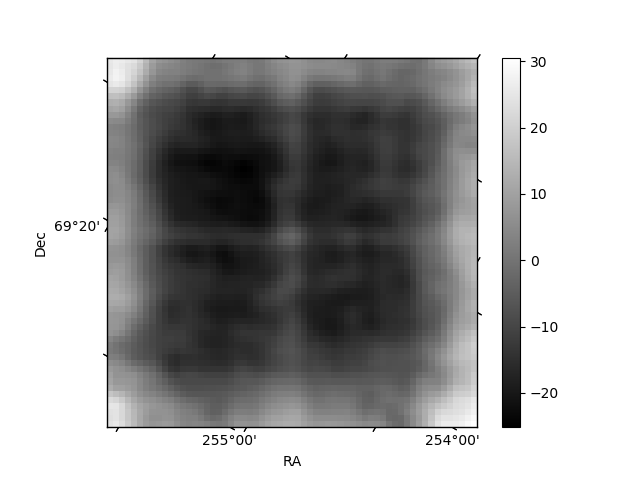
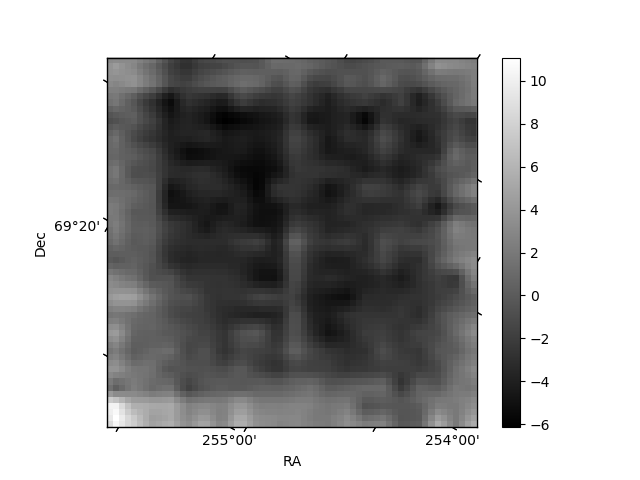
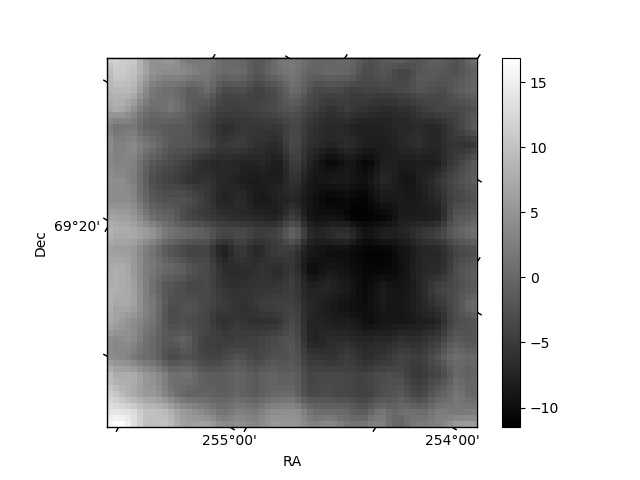
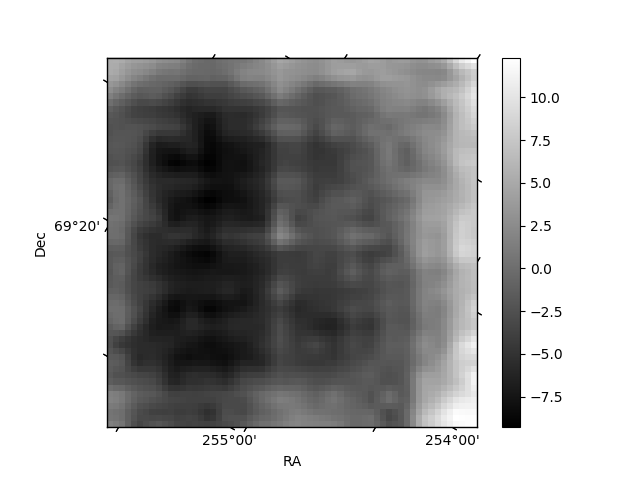
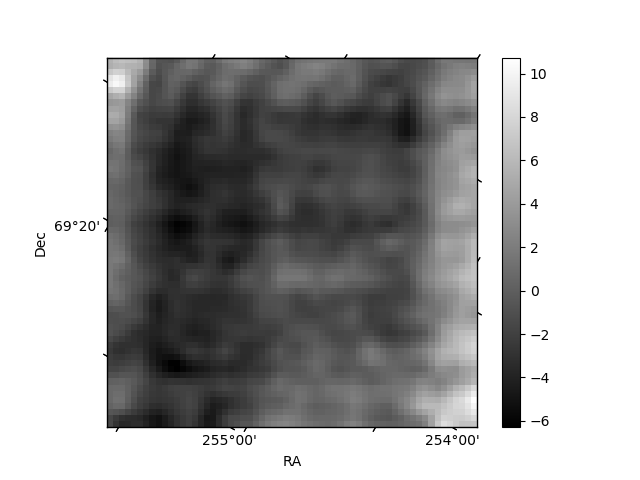
Histogram calculated using DETX and DETY for each event in the final _common_clean file
| Quadrant A | 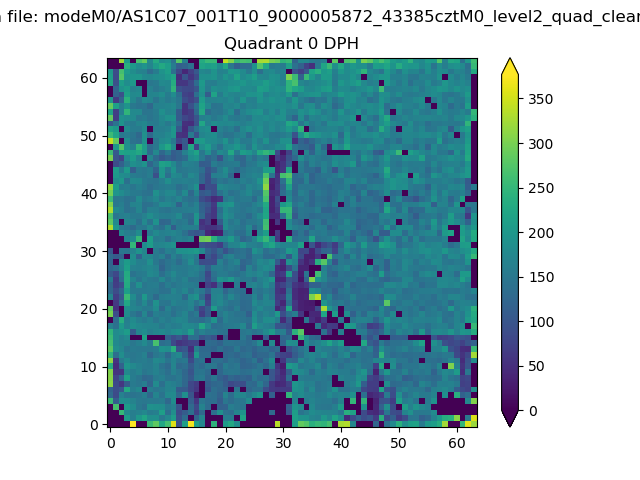 |
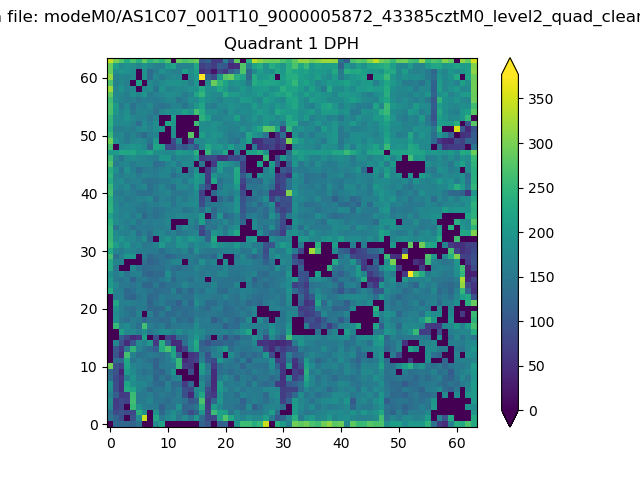 |
Quadrant B |
|---|---|---|---|
| Quadrant D | 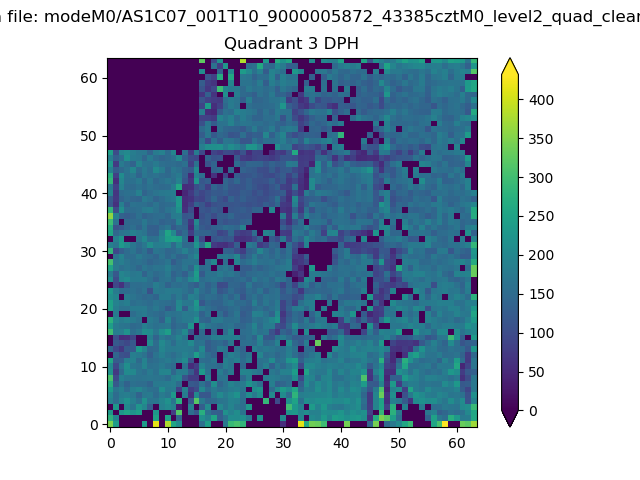 |
 |
Quadrant C |
| Plot type | Count rate plots | Images |
|---|---|---|
| Comparison with Poisson distribution Blue bars denote a histogram of data divided into 1 sec bins. Red curve is a Poisson curve with rate = median count rate of data. |
 |
 |
| Quadrant-wise count rates Data is divided into 100 sec bins |
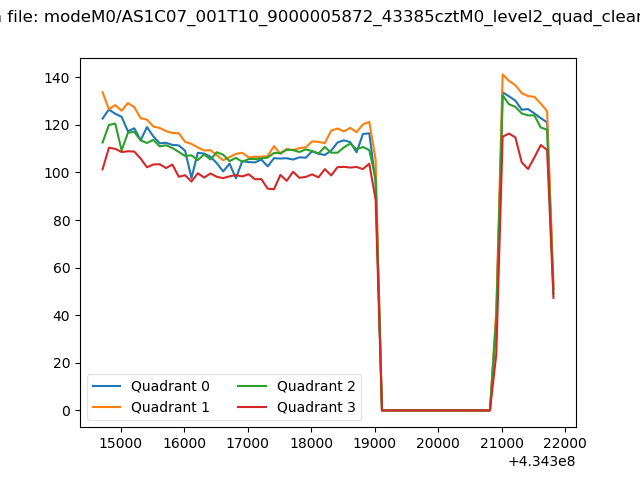 |
|
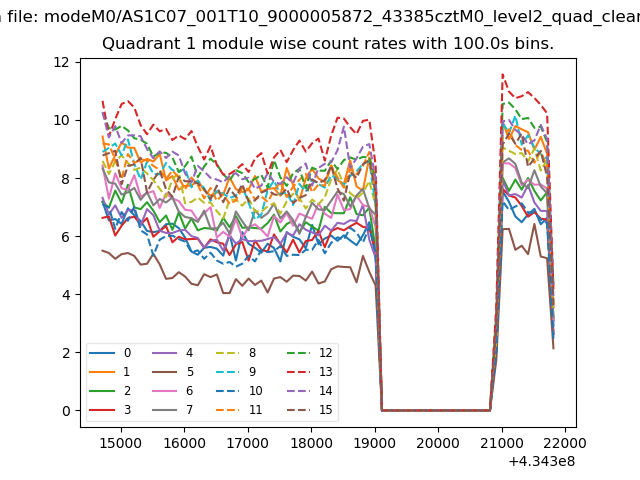
| Module-wise count rates for Quadrant A Data is divided into 100 sec bins |
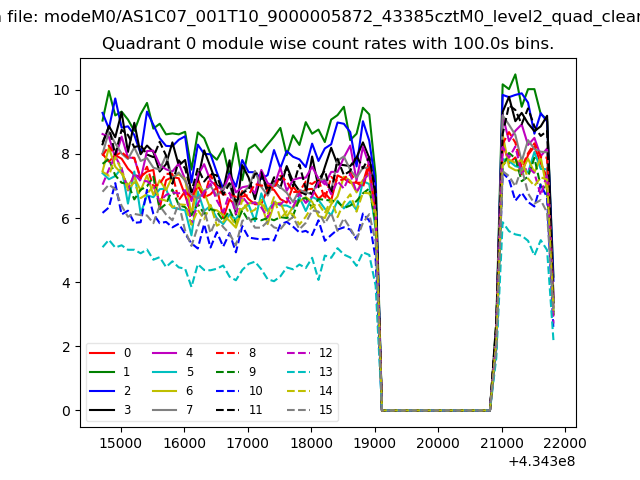 |
 |
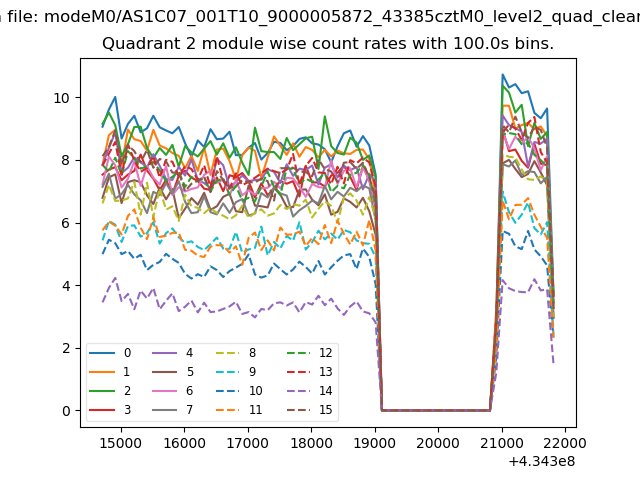
| Module-wise count rates for Quadrant B Data is divided into 100 sec bins |
 |
 |
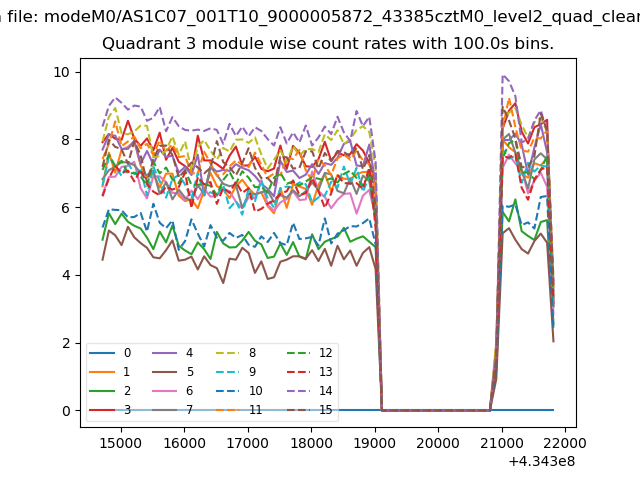
| Module-wise count rates for Quadrant C Data is divided into 100 sec bins |
 |
 |
| Module-wise count rates for Quadrant D Data is divided into 100 sec bins |
 |
 |
| Parameter | Plot |
|---|---|
| CZT HV Monitor | 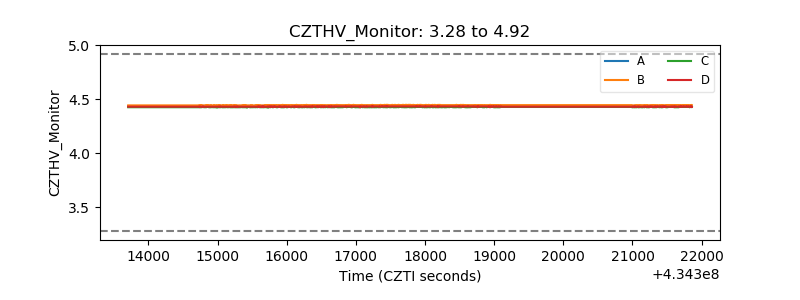 |
| D_VDD | 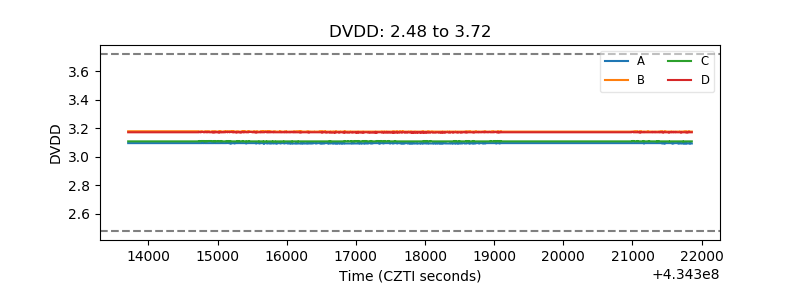 |
| Temperature 1 | 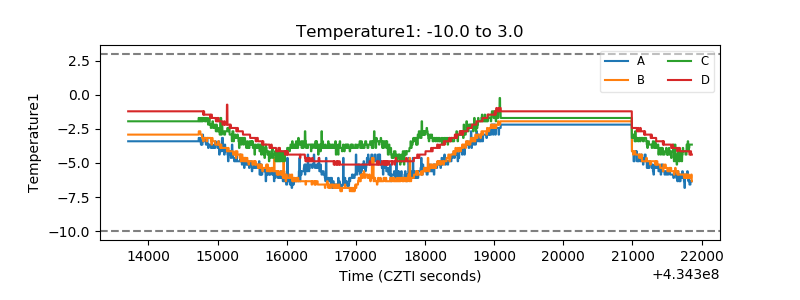 |
| Veto HV Monitor | 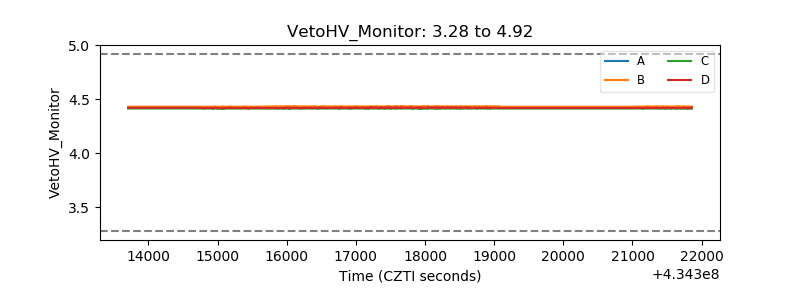 |
| Veto LLD | 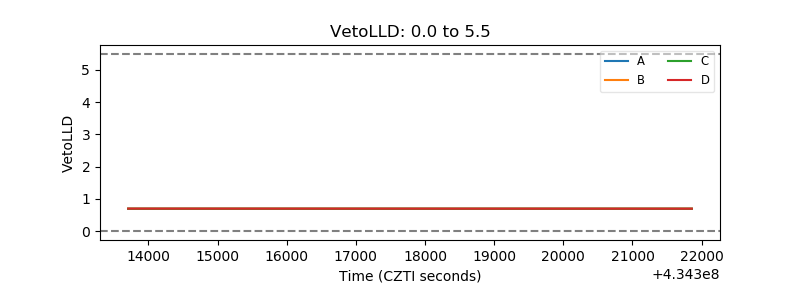 |
| Alpha Counter | 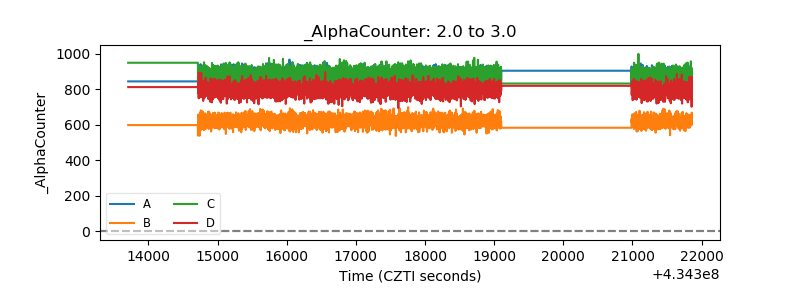 |
| _CPM_Rate | 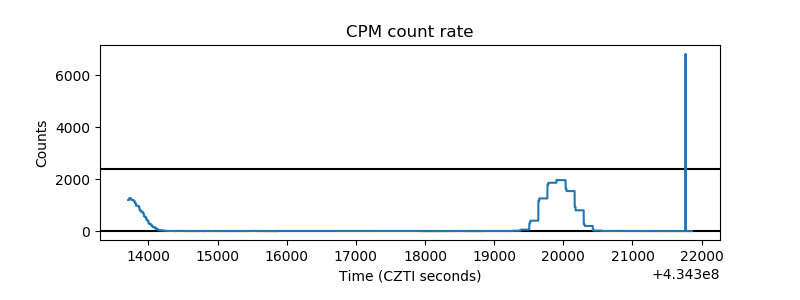 |
| CZT Counter | 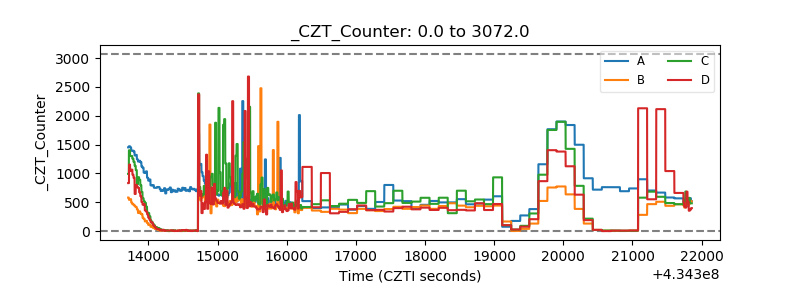 |
| +2.5 Volts monitor | 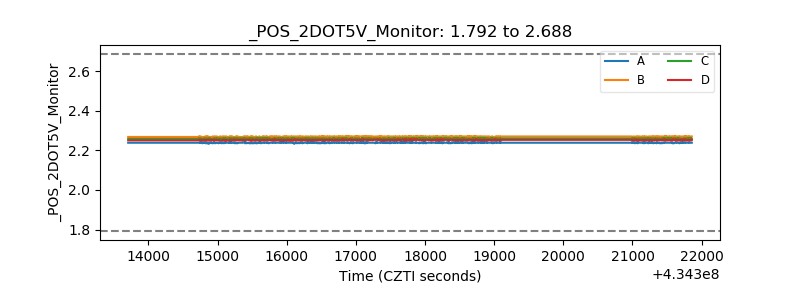 |
| +5 Volts monitor | 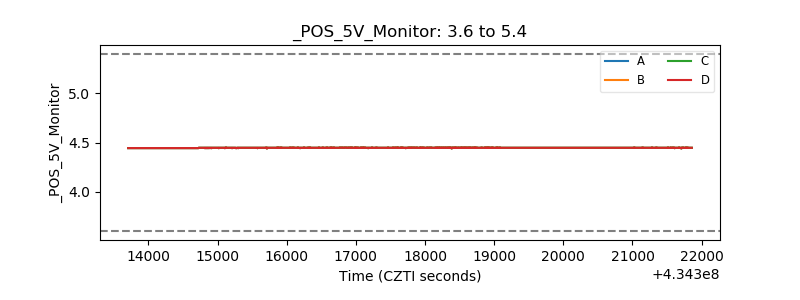 |
| _ROLL_ROT | 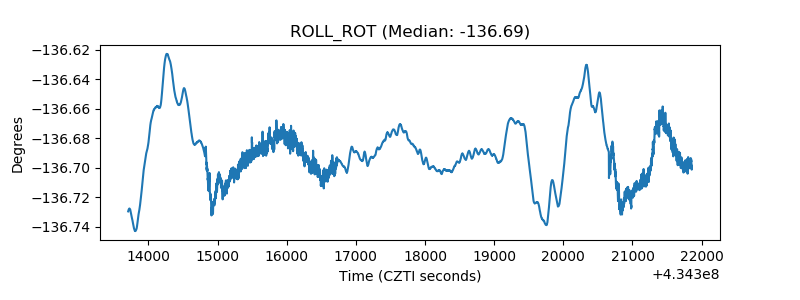 |
| _Roll_DEC | 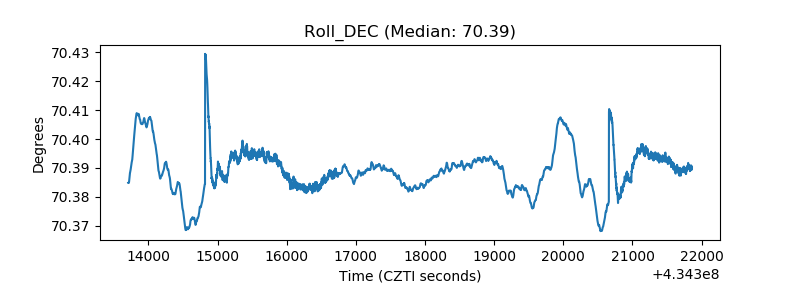 |
| _Roll_RA | 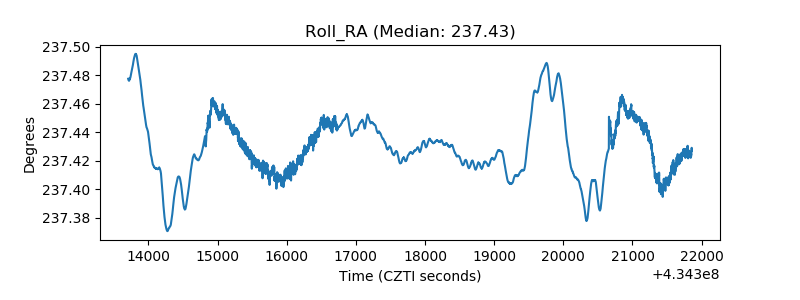 |
| Veto Counter | 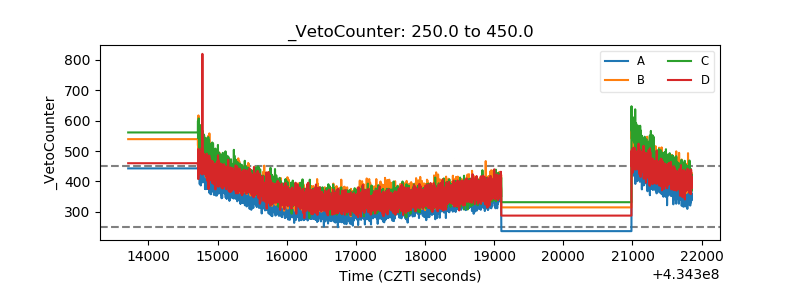 |