| Param | Original file | Final file |
|---|---|---|
| Filename | modeM0/AS1C07_001T10_9000005872_43386cztM0_level2.fits | modeM0/AS1C07_001T10_9000005872_43386cztM0_level2_quad_clean.evt |
| Size (bytes) | 303,649,920 | 88,188,480 |
| Size | 289.6 MB | 84.1 MB |
| Events in quadrant A | 3,045,992 | 582,500 |
| Events in quadrant B | 2,287,130 | 617,090 |
| Events in quadrant C | 2,683,519 | 588,118 |
| Events in quadrant D | 2,827,680 | 527,036 |
| Mode SS | |||
|---|---|---|---|
| Quadrant | BADHDUFLAG | Total packets | Discarded packets |
| A | 0 | 104 | 0 |
| B | 0 | 104 | 0 |
| C | 0 | 104 | 0 |
| D | 0 | 104 | 0 |
| Mode M9 | |||
|---|---|---|---|
| Quadrant | BADHDUFLAG | Total packets | Discarded packets |
| A | 0 | 31 | 0 |
| B | 0 | 32 | 0 |
| C | 0 | 32 | 0 |
| D | 0 | 32 | 0 |
| Mode M0 | |||
|---|---|---|---|
| Quadrant | BADHDUFLAG | Total packets | Discarded packets |
| A | 0 | 12240 | 2 |
| B | 0 | 10362 | 2 |
| C | 0 | 11099 | 2 |
| D | 0 | 12174 | 5 |
| Quadrant | Total seconds | Saturated seconds | Saturation percentage |
|---|---|---|---|
| A | 5076 | 109 | 2.147360% |
| B | 5076 | 12 | 0.236407% |
| C | 5076 | 7 | 0.137904% |
| D | 5075 | 142 | 2.798030% |
Noise dominated data is calculated using 1-second bins in cleaned event files. If a bin has >2000 counts, and if more than 50% of those come from <1% of pixels, then it is considered to be noise-dominated and hence unusable.
| Quadrant | # 1 sec bins | Bins with >0 counts | Bins with >2000 counts | High rate bins dominated by noise | Noise dominated (total time) | Noise dominated (detector-on time) | Marked lightcurve |
|---|---|---|---|---|---|---|---|
| A | 7079 | 5077 | 89 | 89 | 1.26% | 1.75% |  |
| B | 7079 | 5077 | 3 | 3 | 0.04% | 0.06% | 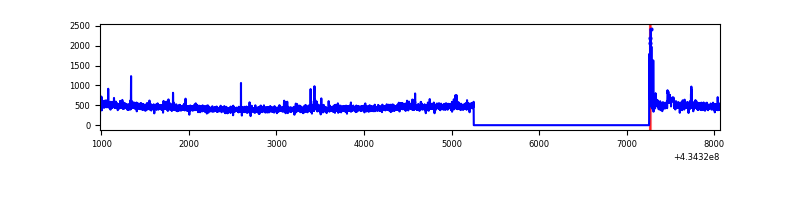 |
| C | 7079 | 5077 | 0 | 0 | 0.00% | 0.00% | 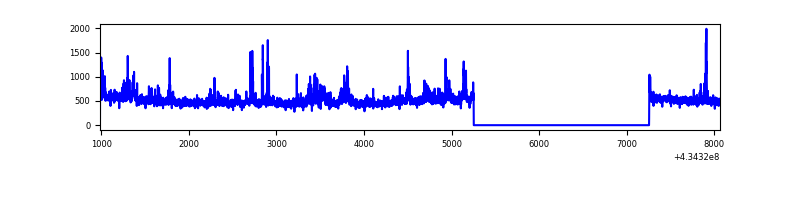 |
| D | 7078 | 5076 | 127 | 127 | 1.79% | 2.50% | 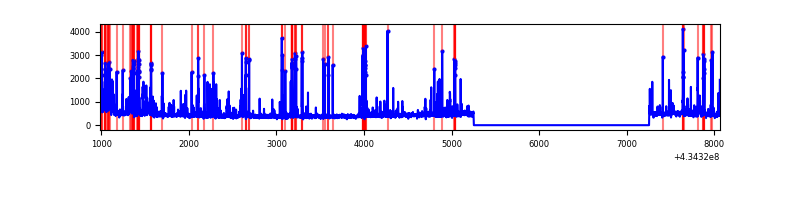 |
Top three noisy pixels from each quadrant. If the there are fewer than three noisy pixels in the level2.evt file, extra rows are filled as -1
| Pixel properties | Quadrant properties | ||||||
|---|---|---|---|---|---|---|---|
| Quadrant | DetID | PixID | Counts | Sigma | Mean | Median | Sigma |
| A | 10 | 83 | 543398 | 4843.91 | 548 | 539 | 112.1 |
| A | 15 | 237 | 335502 | 2988.86 | 548 | 539 | 112.1 |
| A | 13 | 6 | 17280 | 149.38 | 548 | 539 | 112.1 |
| B | 0 | 189 | 37802 | 349.78 | 559 | 543 | 106.5 |
| B | 0 | 245 | 24505 | 224.95 | 559 | 543 | 106.5 |
| B | 5 | 172 | 19691 | 179.76 | 559 | 543 | 106.5 |
| C | 3 | 233 | 264562 | 2086.05 | 549 | 553 | 126.6 |
| C | 15 | 214 | 208811 | 1645.54 | 549 | 553 | 126.6 |
| C | 15 | 111 | 34093 | 265.01 | 549 | 553 | 126.6 |
| D | 12 | 218 | 199750 | 1526.57 | 536 | 521 | 130.5 |
| D | 13 | 249 | 164251 | 1254.56 | 536 | 521 | 130.5 |
| D | 12 | 6 | 135730 | 1036.02 | 536 | 521 | 130.5 |
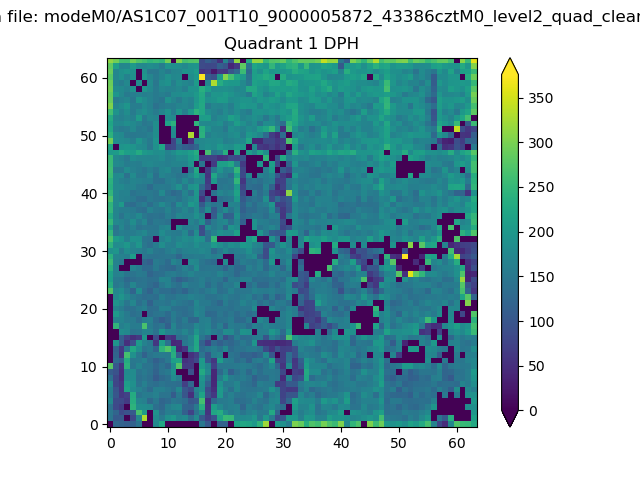
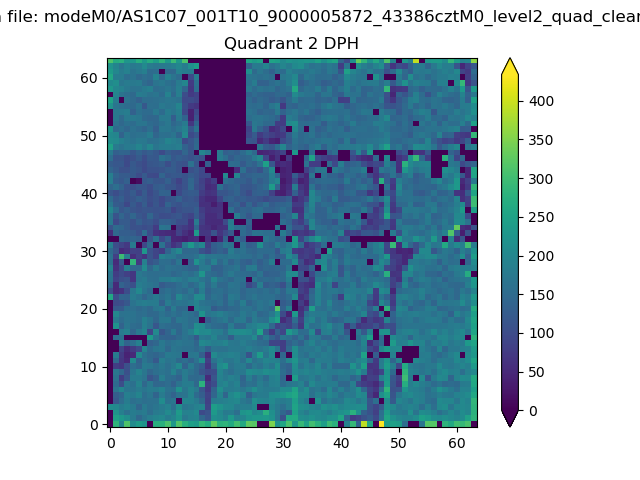
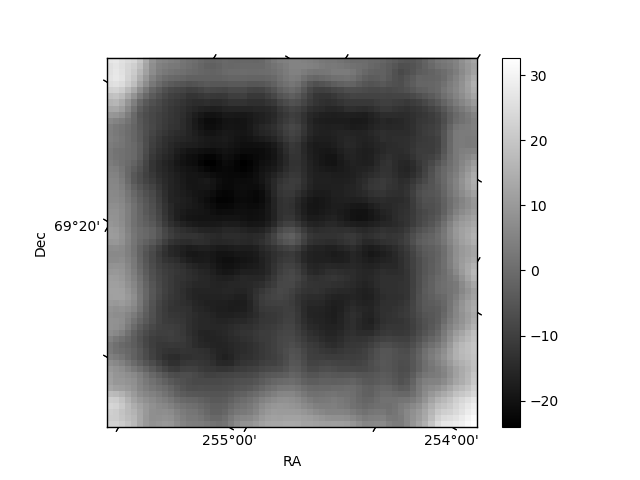
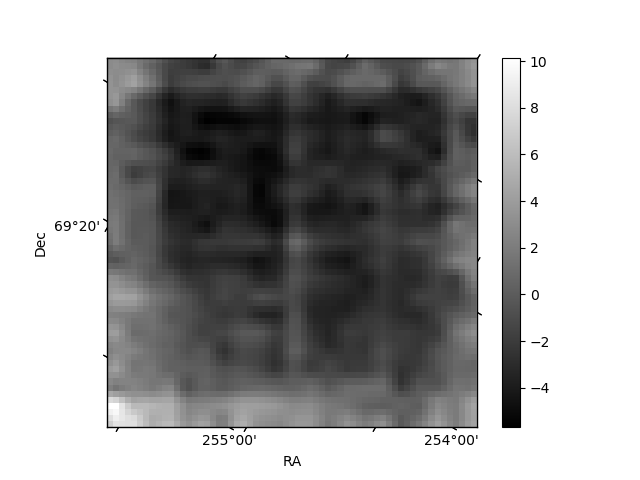
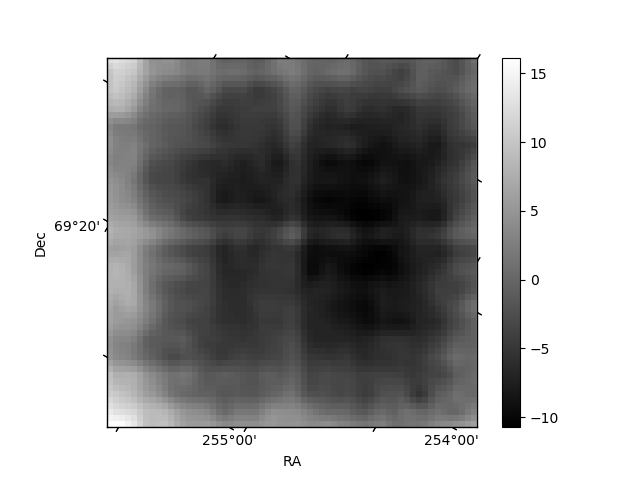
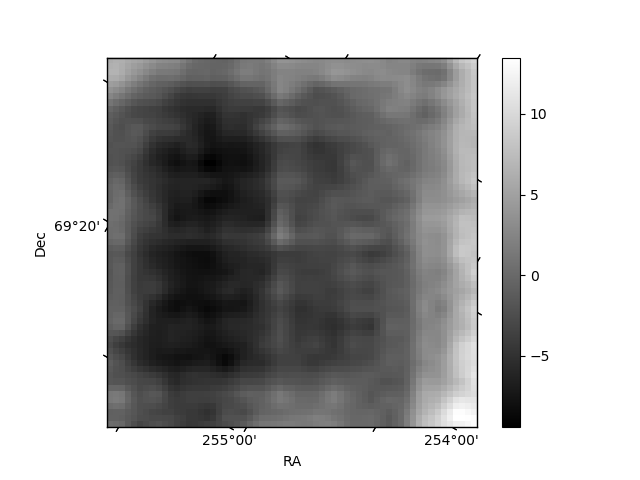
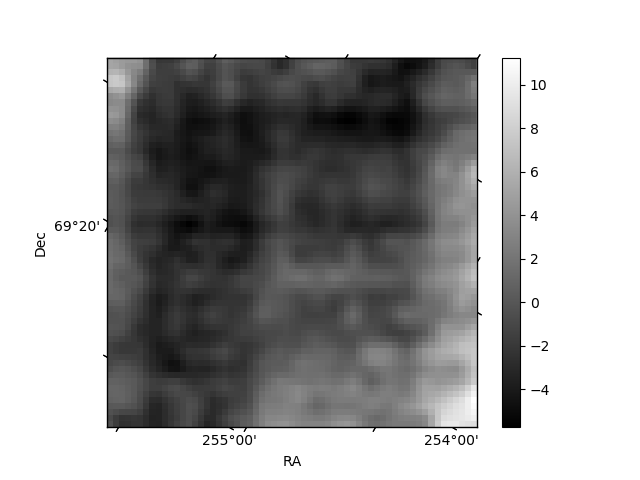
Histogram calculated using DETX and DETY for each event in the final _common_clean file
| Quadrant A | 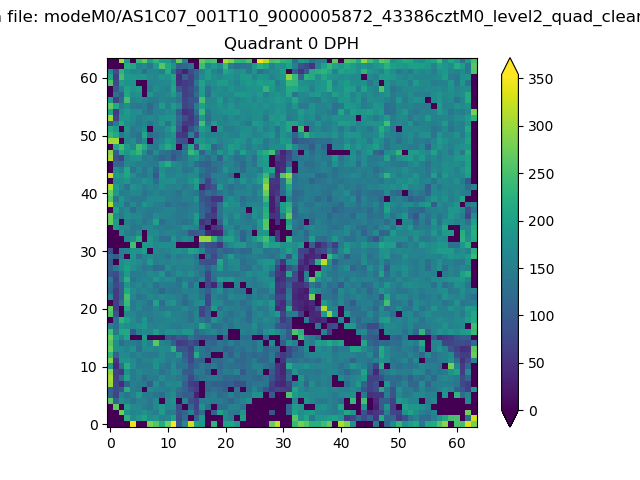 |
 |
Quadrant B |
|---|---|---|---|
| Quadrant D | 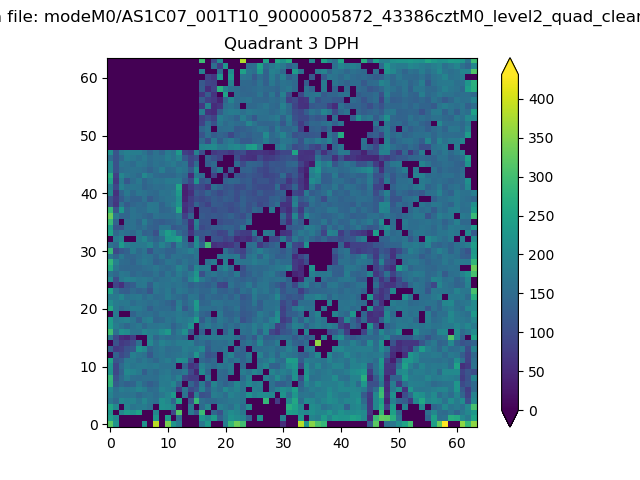 |
 |
Quadrant C |
| Plot type | Count rate plots | Images |
|---|---|---|
| Comparison with Poisson distribution Blue bars denote a histogram of data divided into 1 sec bins. Red curve is a Poisson curve with rate = median count rate of data. |
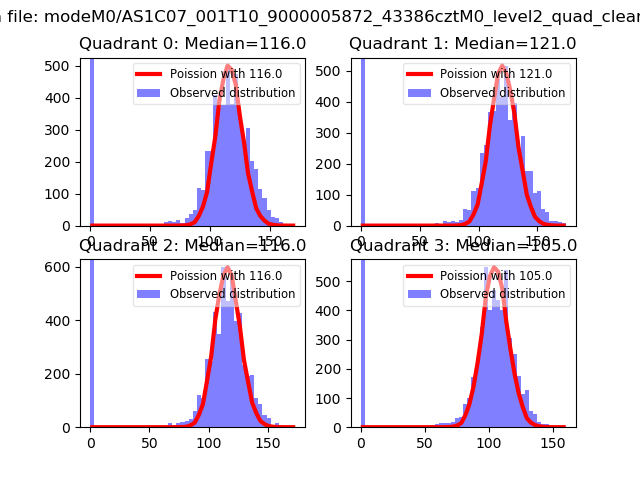 |
 |
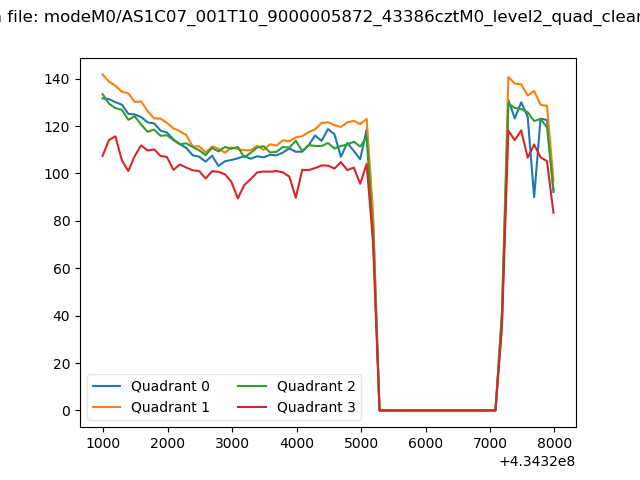
| Quadrant-wise count rates Data is divided into 100 sec bins |
 |
|
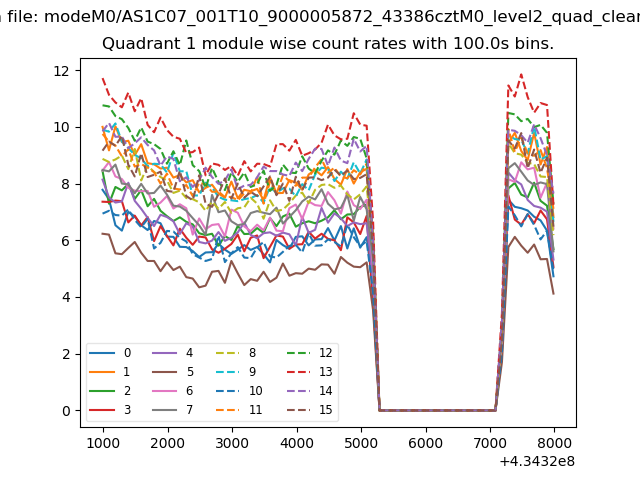
| Module-wise count rates for Quadrant A Data is divided into 100 sec bins |
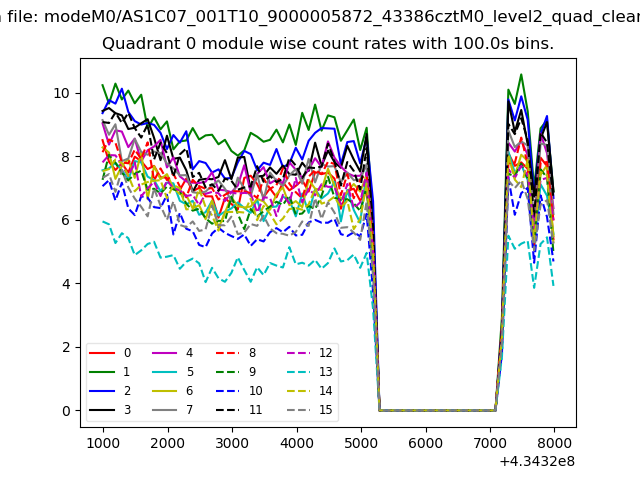 |
 |
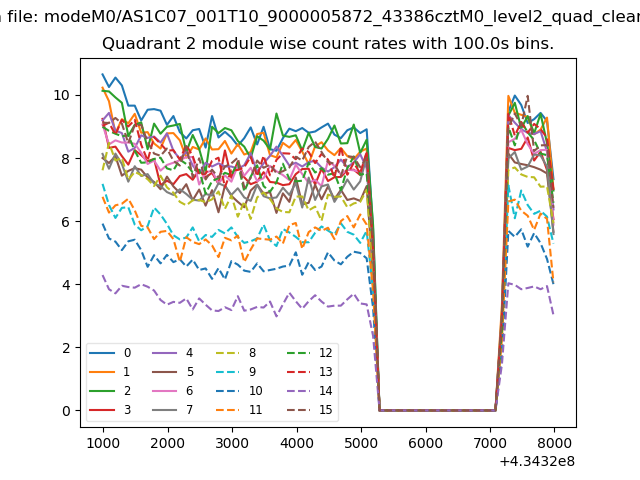
| Module-wise count rates for Quadrant B Data is divided into 100 sec bins |
 |
 |
| Module-wise count rates for Quadrant C Data is divided into 100 sec bins |
 |
 |
| Module-wise count rates for Quadrant D Data is divided into 100 sec bins |
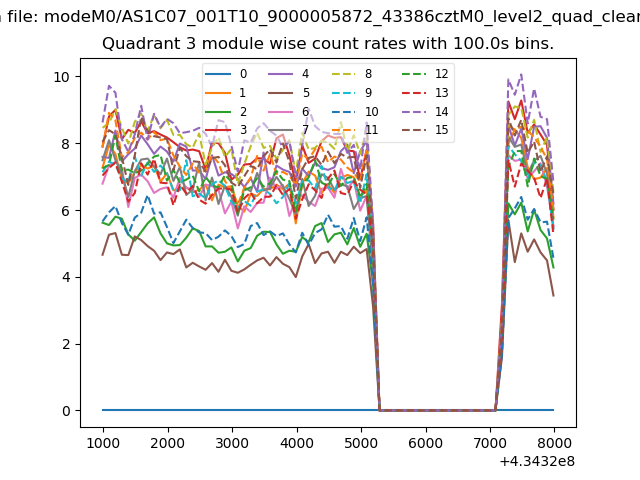 |
 |
| Parameter | Plot |
|---|---|
| CZT HV Monitor | 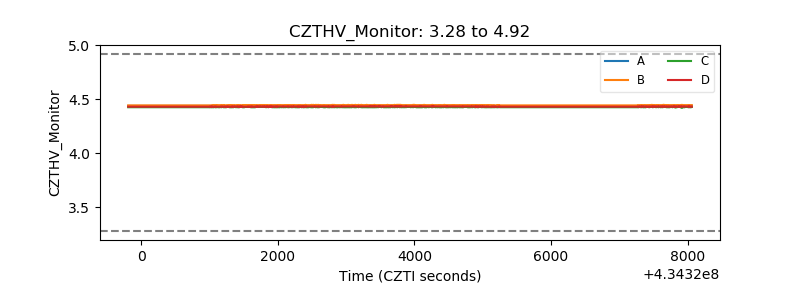 |
| D_VDD | 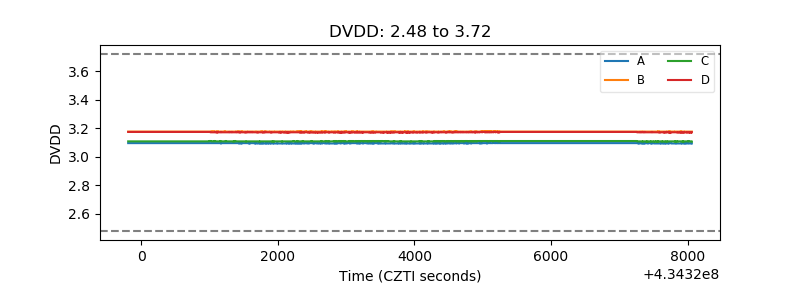 |
| Temperature 1 | 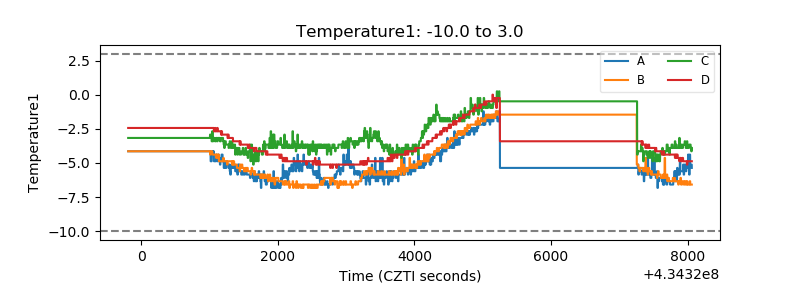 |
| Veto HV Monitor | 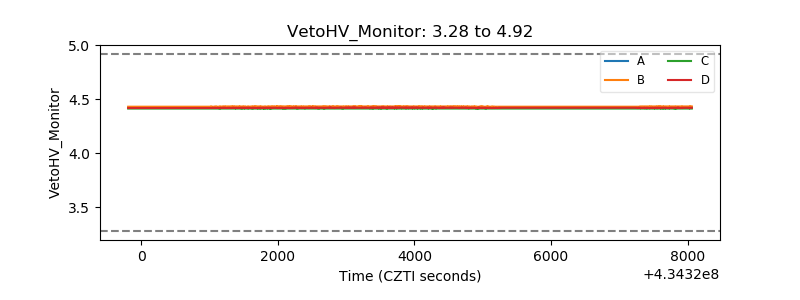 |
| Veto LLD | 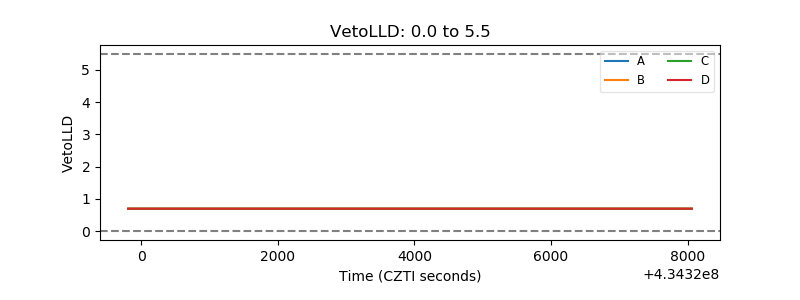 |
| Alpha Counter | 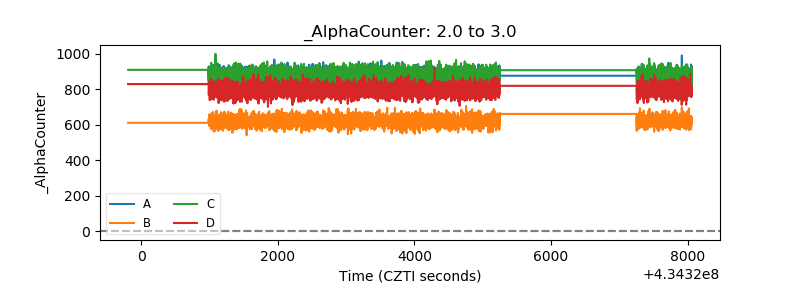 |
| _CPM_Rate | 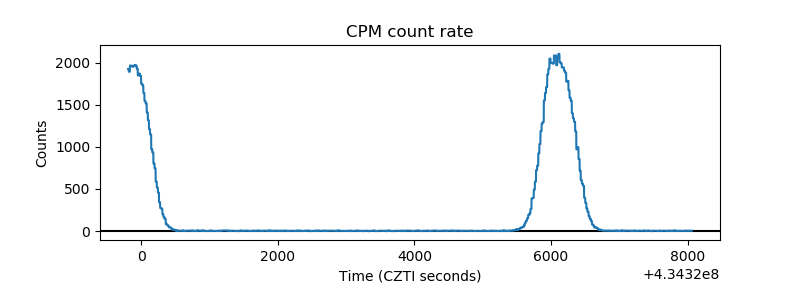 |
| CZT Counter | 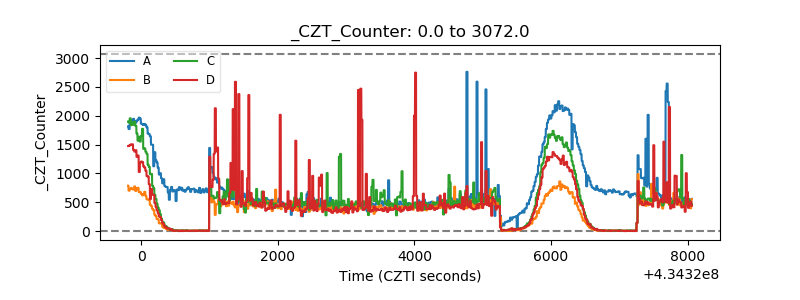 |
| +2.5 Volts monitor | 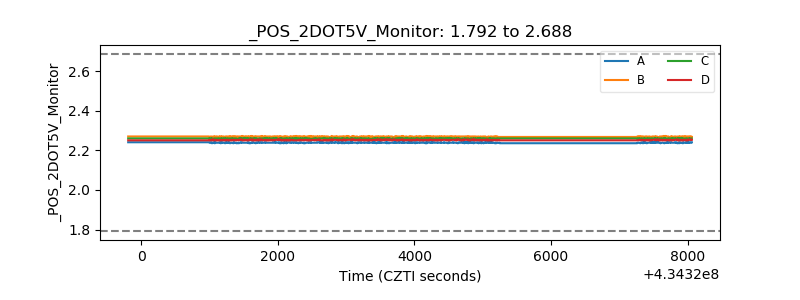 |
| +5 Volts monitor | 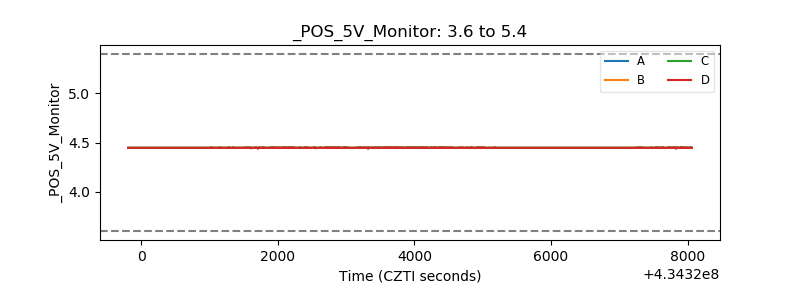 |
| _ROLL_ROT | 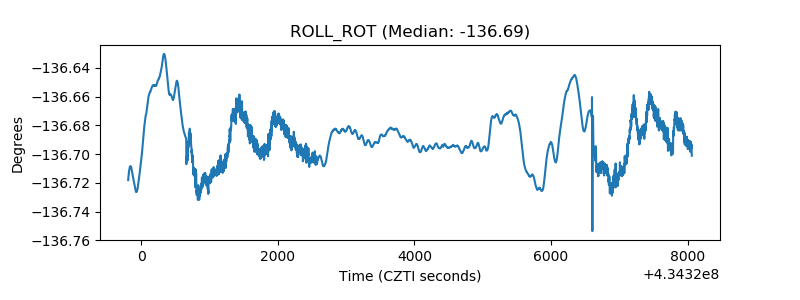 |
| _Roll_DEC | 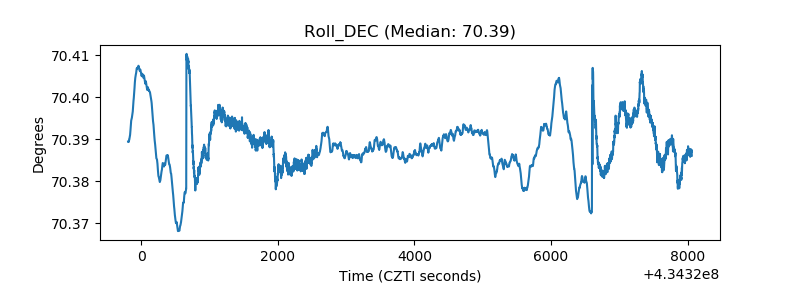 |
| _Roll_RA | 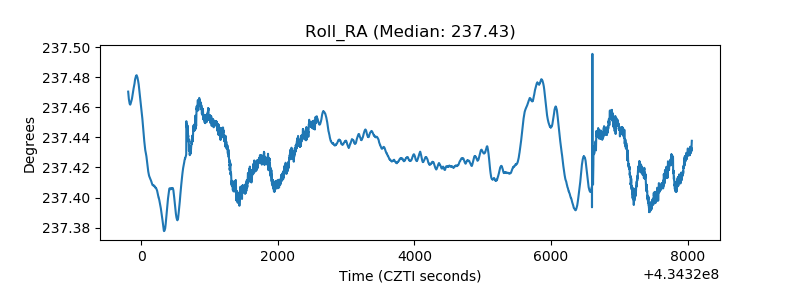 |
| Veto Counter | 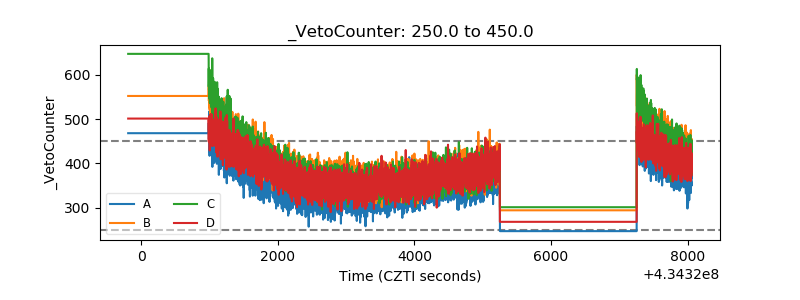 |