| Param | Original file | Final file |
|---|---|---|
| Filename | modeM0/AS1C07_001T10_9000005872_43387cztM0_level2.fits | modeM0/AS1C07_001T10_9000005872_43387cztM0_level2_quad_clean.evt |
| Size (bytes) | 318,404,160 | 89,893,440 |
| Size | 303.7 MB | 85.7 MB |
| Events in quadrant A | 3,019,776 | 595,719 |
| Events in quadrant B | 2,355,880 | 629,851 |
| Events in quadrant C | 2,638,720 | 599,678 |
| Events in quadrant D | 3,368,093 | 533,810 |
| Mode SS | |||
|---|---|---|---|
| Quadrant | BADHDUFLAG | Total packets | Discarded packets |
| A | 0 | 106 | 0 |
| B | 0 | 106 | 0 |
| C | 0 | 106 | 0 |
| D | 0 | 106 | 0 |
| Mode M9 | |||
|---|---|---|---|
| Quadrant | BADHDUFLAG | Total packets | Discarded packets |
| A | 0 | 34 | 0 |
| B | 0 | 35 | 0 |
| C | 0 | 35 | 0 |
| D | 0 | 35 | 0 |
| Mode M0 | |||
|---|---|---|---|
| Quadrant | BADHDUFLAG | Total packets | Discarded packets |
| A | 0 | 12195 | 2 |
| B | 0 | 10686 | 2 |
| C | 0 | 11048 | 2 |
| D | 0 | 13673 | 2 |
| Quadrant | Total seconds | Saturated seconds | Saturation percentage |
|---|---|---|---|
| A | 5182 | 74 | 1.428020% |
| B | 5182 | 21 | 0.405249% |
| C | 5182 | 12 | 0.231571% |
| D | 5182 | 192 | 3.705133% |
Noise dominated data is calculated using 1-second bins in cleaned event files. If a bin has >2000 counts, and if more than 50% of those come from <1% of pixels, then it is considered to be noise-dominated and hence unusable.
| Quadrant | # 1 sec bins | Bins with >0 counts | Bins with >2000 counts | High rate bins dominated by noise | Noise dominated (total time) | Noise dominated (detector-on time) | Marked lightcurve |
|---|---|---|---|---|---|---|---|
| A | 7276 | 5183 | 62 | 62 | 0.85% | 1.20% | 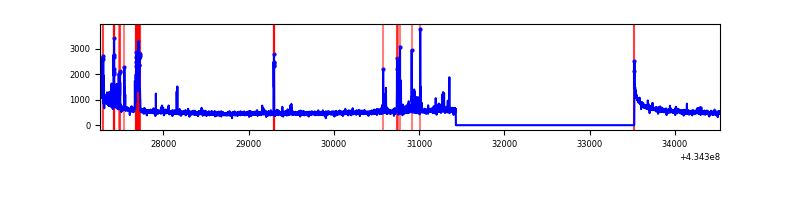 |
| B | 7276 | 5183 | 13 | 13 | 0.18% | 0.25% | 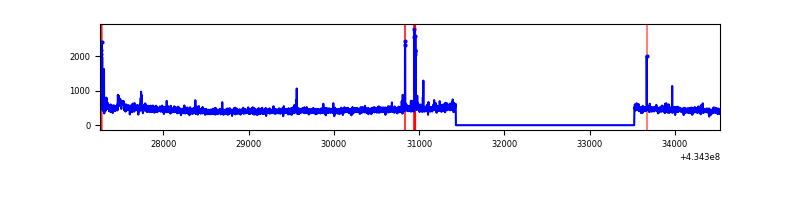 |
| C | 7276 | 5183 | 4 | 4 | 0.05% | 0.08% | 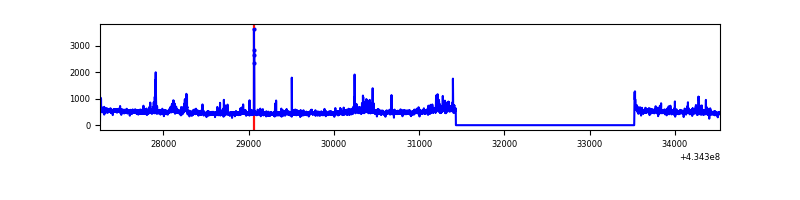 |
| D | 7276 | 5183 | 203 | 203 | 2.79% | 3.92% | 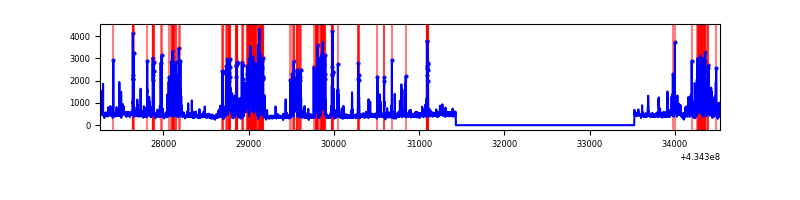 |
Top three noisy pixels from each quadrant. If the there are fewer than three noisy pixels in the level2.evt file, extra rows are filled as -1
| Pixel properties | Quadrant properties | ||||||
|---|---|---|---|---|---|---|---|
| Quadrant | DetID | PixID | Counts | Sigma | Mean | Median | Sigma |
| A | 10 | 83 | 555911 | 4840.39 | 562 | 550 | 114.7 |
| A | 15 | 237 | 239342 | 2081.25 | 562 | 550 | 114.7 |
| A | 13 | 248 | 33930 | 290.93 | 562 | 550 | 114.7 |
| B | 5 | 172 | 55092 | 506.55 | 568 | 553 | 107.7 |
| B | 0 | 189 | 29137 | 265.48 | 568 | 553 | 107.7 |
| B | 0 | 245 | 24889 | 226.03 | 568 | 553 | 107.7 |
| C | 15 | 214 | 214692 | 1663.83 | 556 | 559 | 128.7 |
| C | 3 | 233 | 187044 | 1449.0 | 556 | 559 | 128.7 |
| C | 15 | 111 | 56941 | 438.09 | 556 | 559 | 128.7 |
| D | 12 | 6 | 792484 | 6006.62 | 542 | 525 | 131.8 |
| D | 13 | 249 | 139199 | 1051.77 | 542 | 525 | 131.8 |
| D | 12 | 217 | 117763 | 889.19 | 542 | 525 | 131.8 |
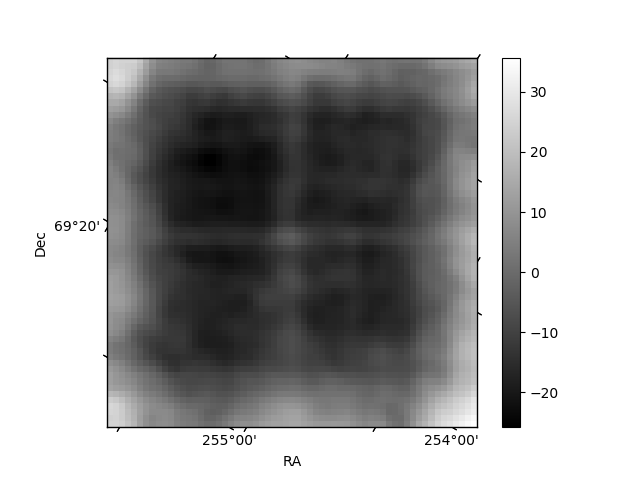
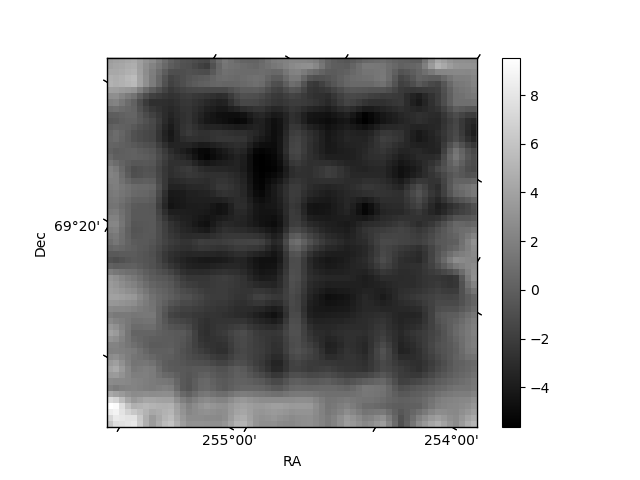
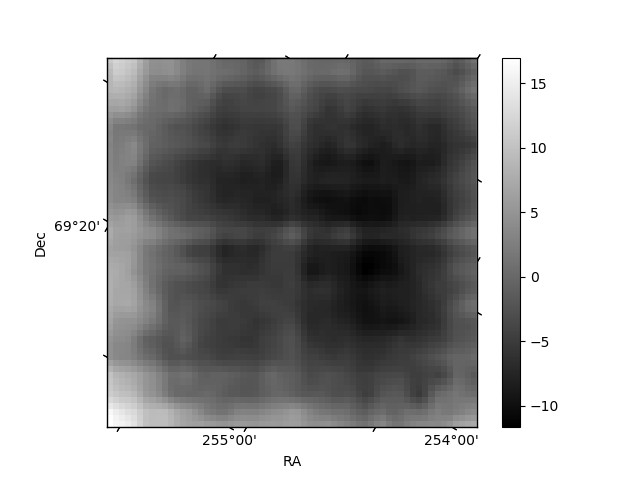
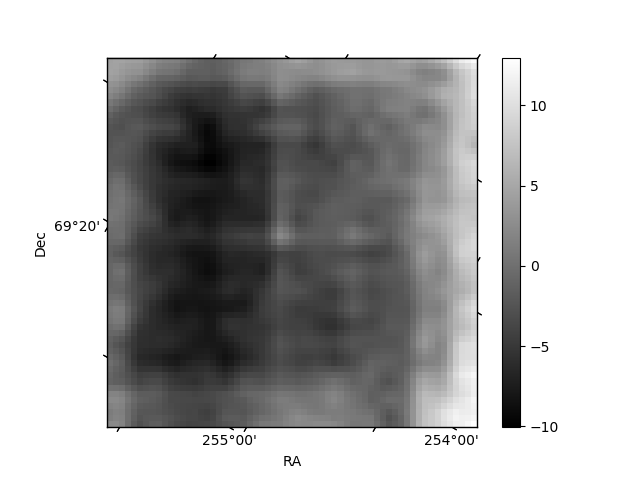
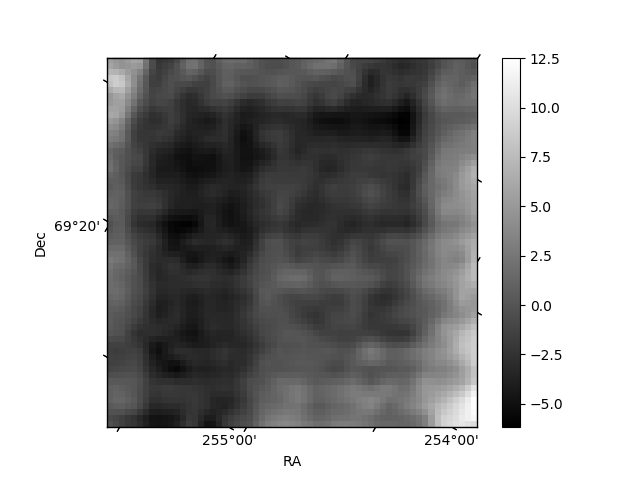
Histogram calculated using DETX and DETY for each event in the final _common_clean file
| Quadrant A | 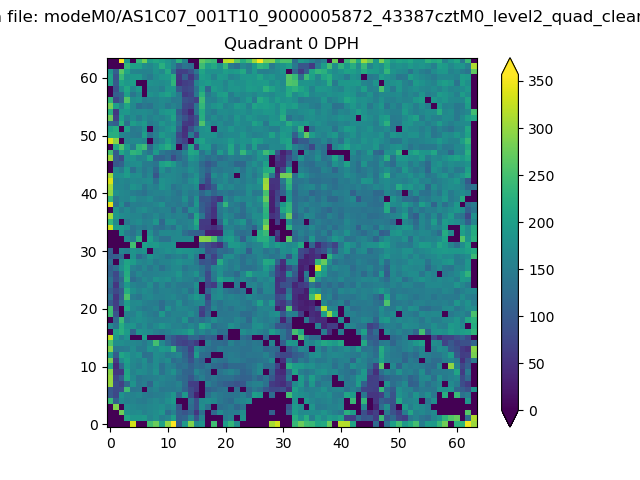 |
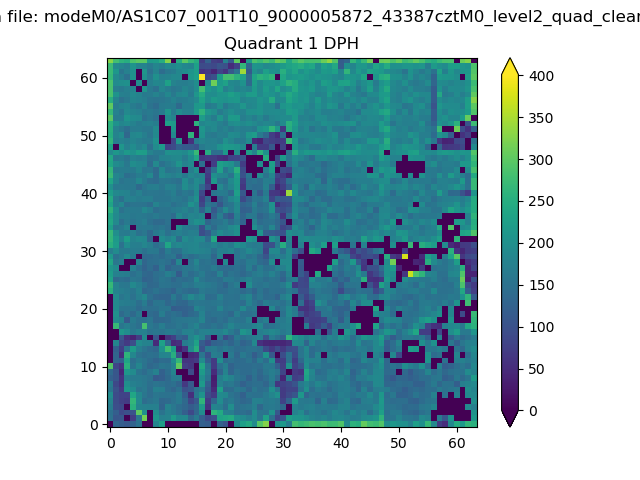 |
Quadrant B |
|---|---|---|---|
| Quadrant D | 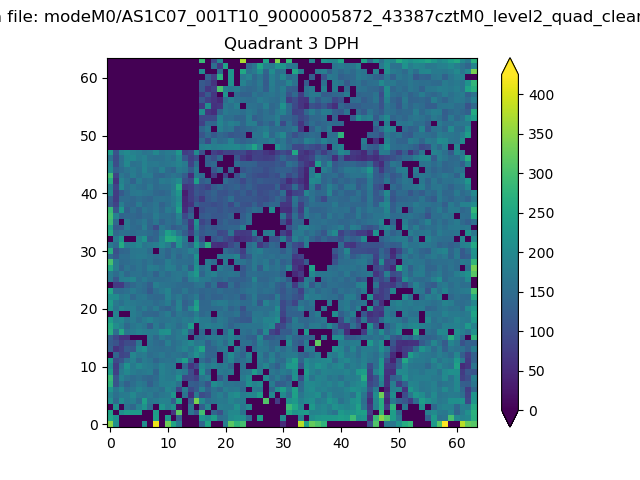 |
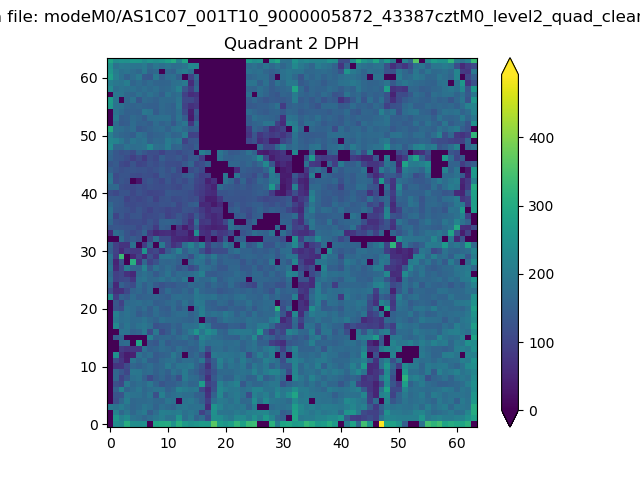 |
Quadrant C |
| Plot type | Count rate plots | Images |
|---|---|---|
| Comparison with Poisson distribution Blue bars denote a histogram of data divided into 1 sec bins. Red curve is a Poisson curve with rate = median count rate of data. |
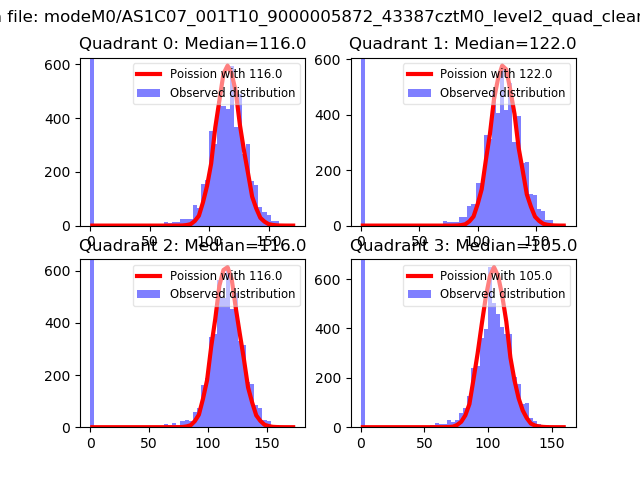 |
 |
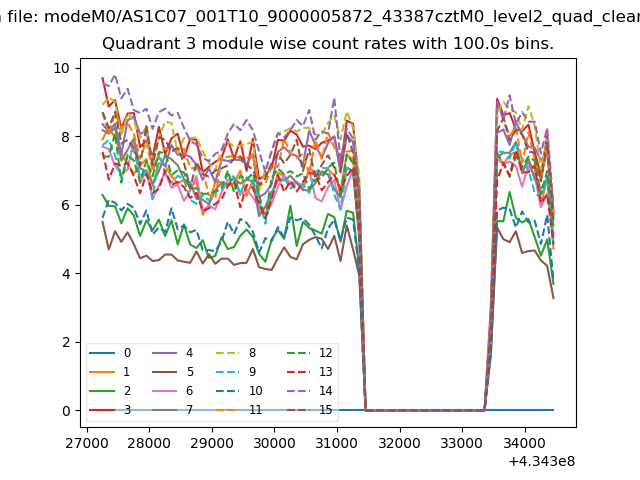
| Quadrant-wise count rates Data is divided into 100 sec bins |
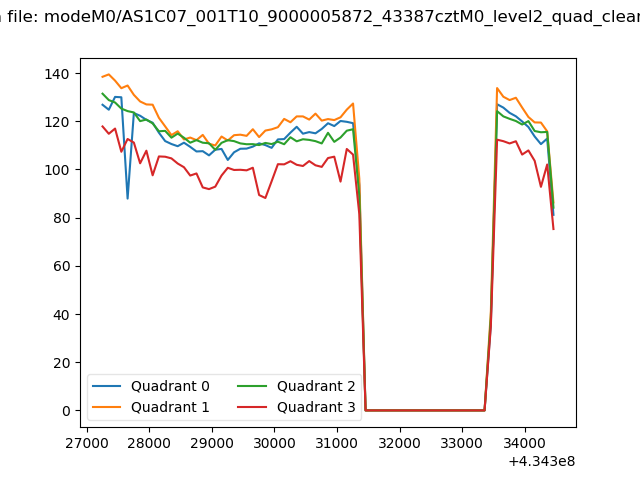 |
|
| Module-wise count rates for Quadrant A Data is divided into 100 sec bins |
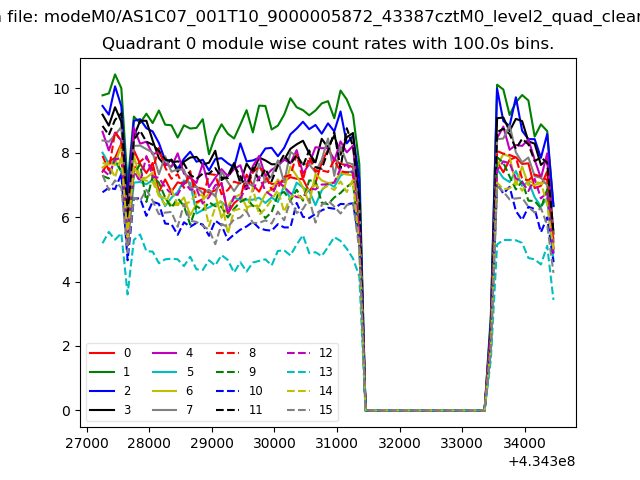 |
 |
| Module-wise count rates for Quadrant B Data is divided into 100 sec bins |
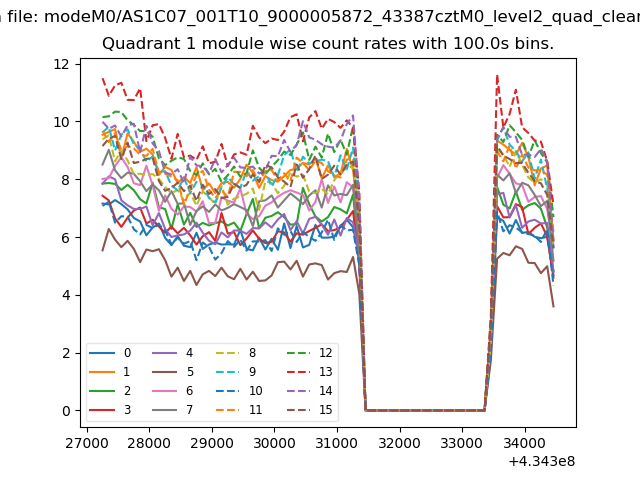 |
 |
| Module-wise count rates for Quadrant C Data is divided into 100 sec bins |
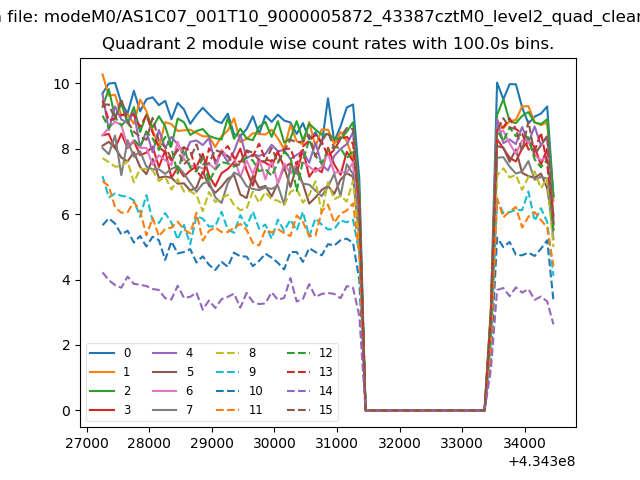 |
 |
| Module-wise count rates for Quadrant D Data is divided into 100 sec bins |
 |
 |
| Parameter | Plot |
|---|---|
| CZT HV Monitor | 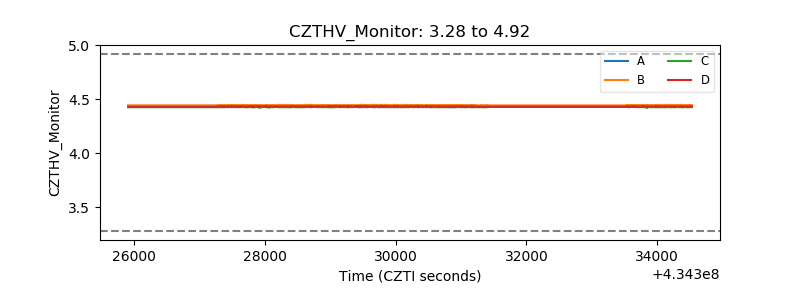 |
| D_VDD | 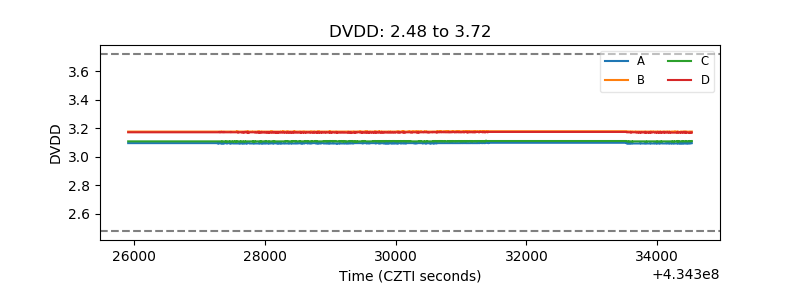 |
| Temperature 1 | 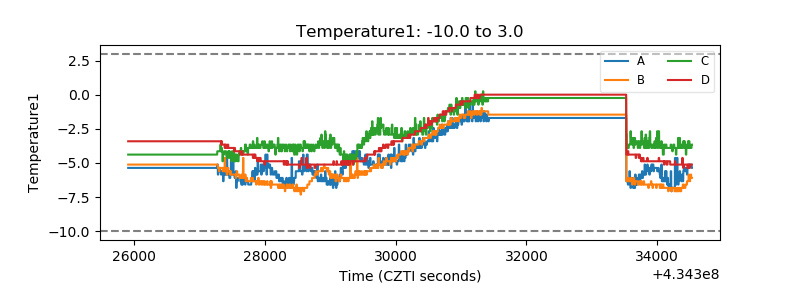 |
| Veto HV Monitor | 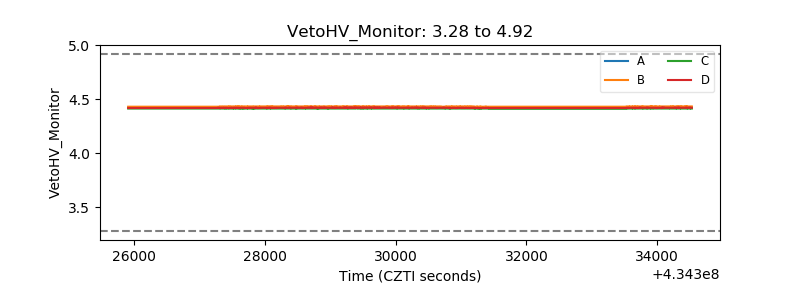 |
| Veto LLD | 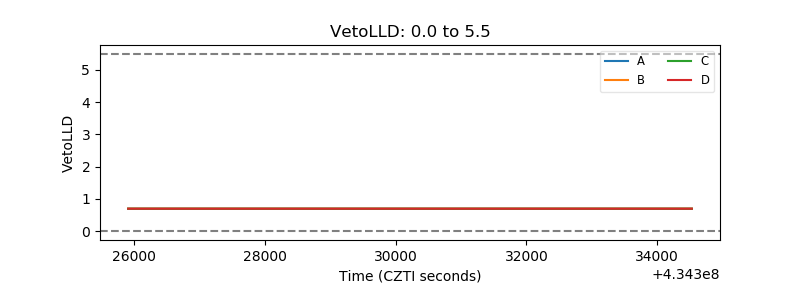 |
| Alpha Counter | 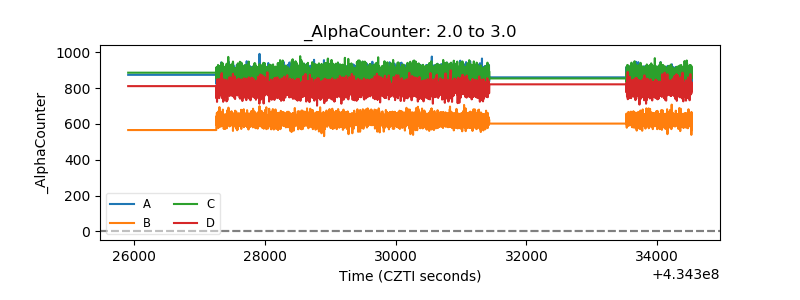 |
| _CPM_Rate | 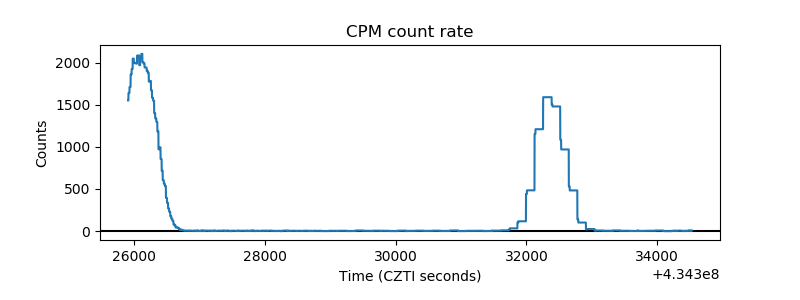 |
| CZT Counter | 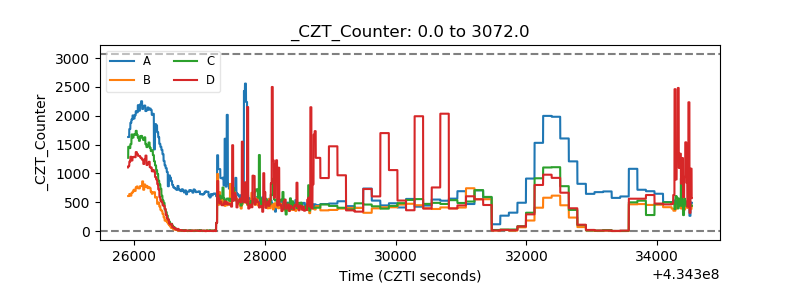 |
| +2.5 Volts monitor | 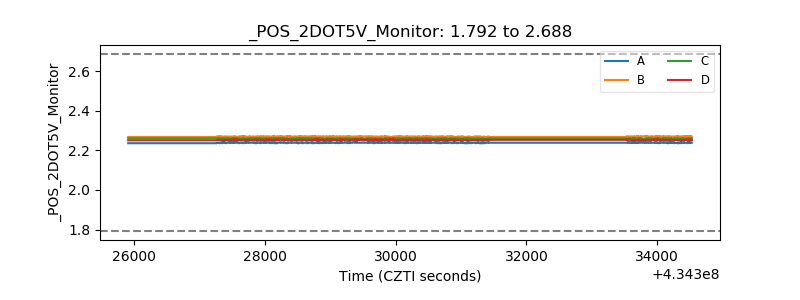 |
| +5 Volts monitor | 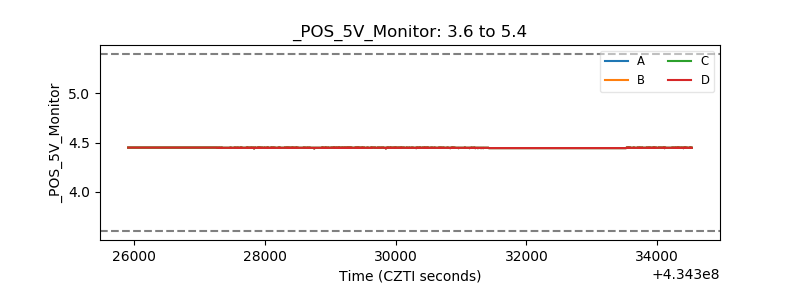 |
| _ROLL_ROT | 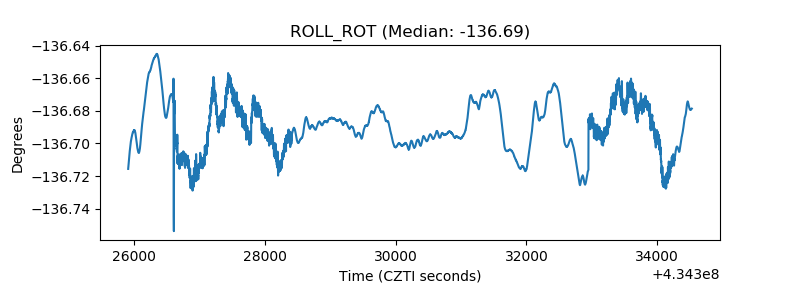 |
| _Roll_DEC | 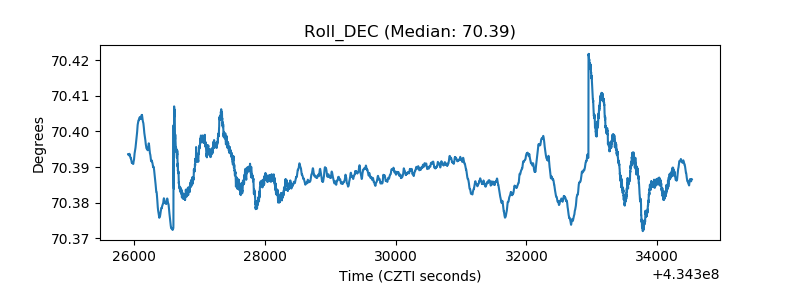 |
| _Roll_RA | 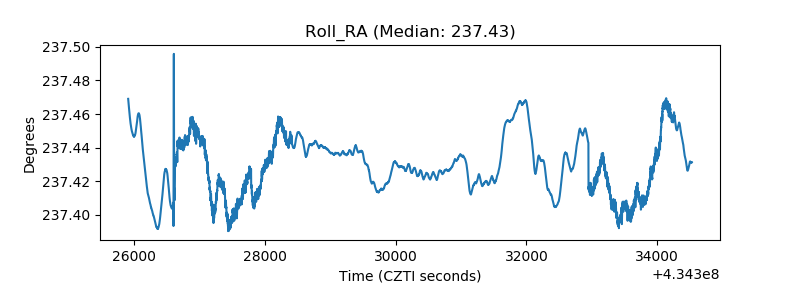 |
| Veto Counter | 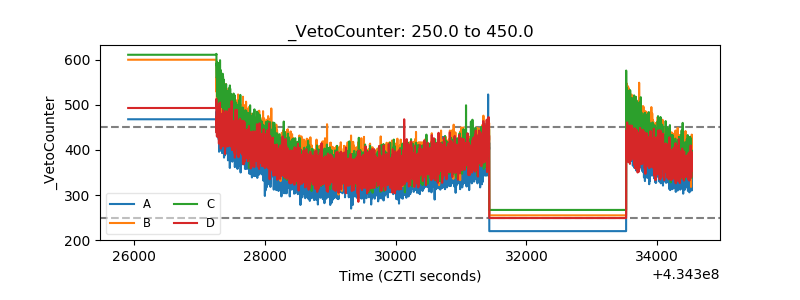 |