| Param | Original file | Final file |
|---|---|---|
| Filename | modeM0/AS1C07_001T10_9000005872_43388cztM0_level2.fits | modeM0/AS1C07_001T10_9000005872_43388cztM0_level2_quad_clean.evt |
| Size (bytes) | 279,938,880 | 78,448,320 |
| Size | 267.0 MB | 74.8 MB |
| Events in quadrant A | 2,570,799 | 523,074 |
| Events in quadrant B | 2,046,103 | 547,324 |
| Events in quadrant C | 2,334,762 | 517,173 |
| Events in quadrant D | 3,051,366 | 464,438 |
| Mode SS | |||
|---|---|---|---|
| Quadrant | BADHDUFLAG | Total packets | Discarded packets |
| A | 0 | 94 | 0 |
| B | 0 | 94 | 0 |
| C | 0 | 94 | 0 |
| D | 0 | 94 | 0 |
| Mode M9 | |||
|---|---|---|---|
| Quadrant | BADHDUFLAG | Total packets | Discarded packets |
| A | 0 | 36 | 0 |
| B | 0 | 37 | 0 |
| C | 0 | 37 | 0 |
| D | 0 | 37 | 0 |
| Mode M0 | |||
|---|---|---|---|
| Quadrant | BADHDUFLAG | Total packets | Discarded packets |
| A | 0 | 10490 | 2 |
| B | 0 | 9391 | 2 |
| C | 0 | 9855 | 2 |
| D | 0 | 12229 | 2 |
| Quadrant | Total seconds | Saturated seconds | Saturation percentage |
|---|---|---|---|
| A | 4604 | 34 | 0.738488% |
| B | 4604 | 11 | 0.238923% |
| C | 4604 | 6 | 0.130321% |
| D | 4604 | 151 | 3.279757% |
Noise dominated data is calculated using 1-second bins in cleaned event files. If a bin has >2000 counts, and if more than 50% of those come from <1% of pixels, then it is considered to be noise-dominated and hence unusable.
| Quadrant | # 1 sec bins | Bins with >0 counts | Bins with >2000 counts | High rate bins dominated by noise | Noise dominated (total time) | Noise dominated (detector-on time) | Marked lightcurve |
|---|---|---|---|---|---|---|---|
| A | 6757 | 4605 | 21 | 21 | 0.31% | 0.46% |  |
| B | 6757 | 4605 | 8 | 8 | 0.12% | 0.17% | 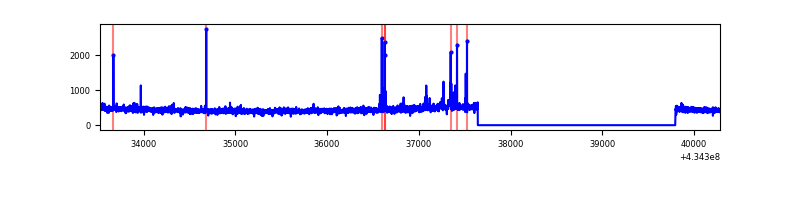 |
| C | 6757 | 4605 | 4 | 4 | 0.06% | 0.09% | 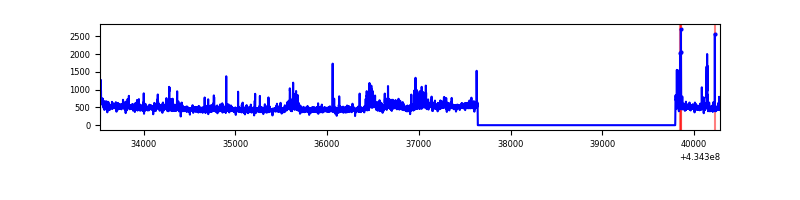 |
| D | 6757 | 4605 | 170 | 170 | 2.52% | 3.69% | 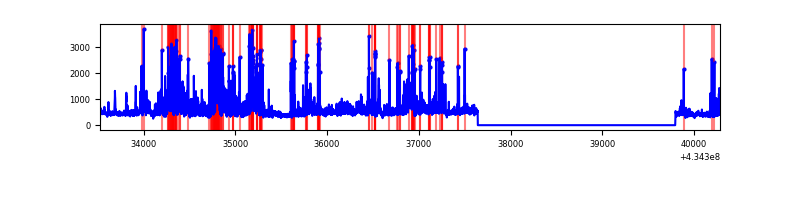 |
Top three noisy pixels from each quadrant. If the there are fewer than three noisy pixels in the level2.evt file, extra rows are filled as -1
| Pixel properties | Quadrant properties | ||||||
|---|---|---|---|---|---|---|---|
| Quadrant | DetID | PixID | Counts | Sigma | Mean | Median | Sigma |
| A | 10 | 83 | 518308 | 5076.37 | 496 | 486 | 102.0 |
| A | 15 | 237 | 74223 | 722.87 | 496 | 486 | 102.0 |
| A | 7 | 3 | 40873 | 395.93 | 496 | 486 | 102.0 |
| B | 0 | 186 | 20377 | 209.0 | 498 | 485 | 95.2 |
| B | 5 | 172 | 19378 | 198.5 | 498 | 485 | 95.2 |
| B | 0 | 245 | 17072 | 174.28 | 498 | 485 | 95.2 |
| C | 15 | 214 | 193768 | 1737.74 | 483 | 486 | 111.2 |
| C | 3 | 233 | 169632 | 1520.74 | 483 | 486 | 111.2 |
| C | 15 | 111 | 72547 | 647.88 | 483 | 486 | 111.2 |
| D | 12 | 6 | 437134 | 3813.27 | 473 | 459 | 114.5 |
| D | 1 | 52 | 252313 | 2199.32 | 473 | 459 | 114.5 |
| D | 12 | 217 | 250949 | 2187.41 | 473 | 459 | 114.5 |
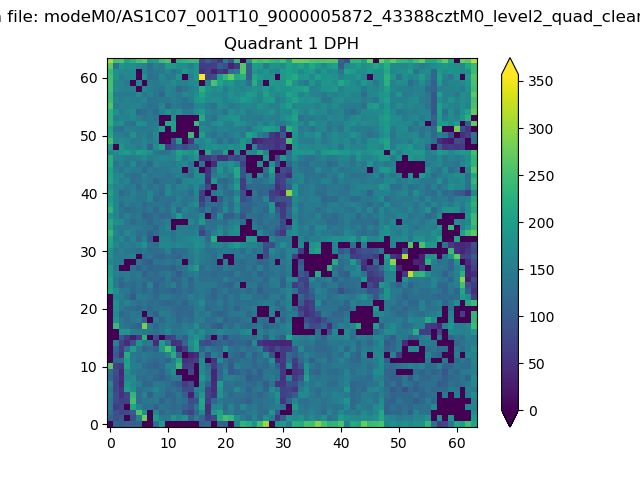
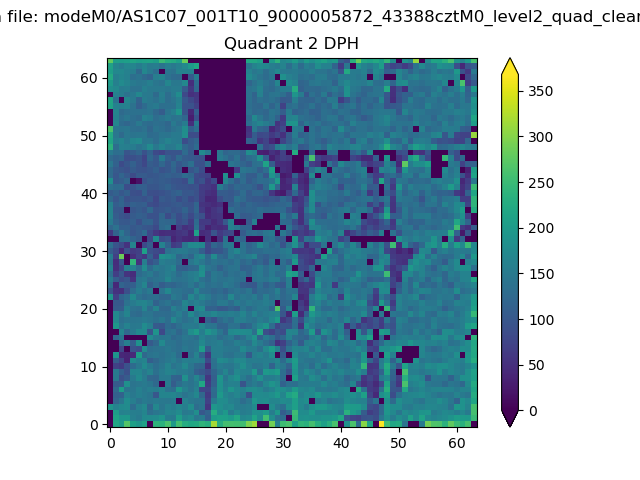
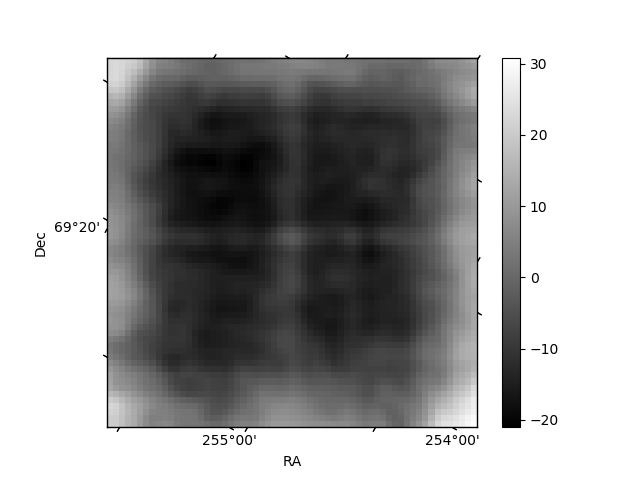
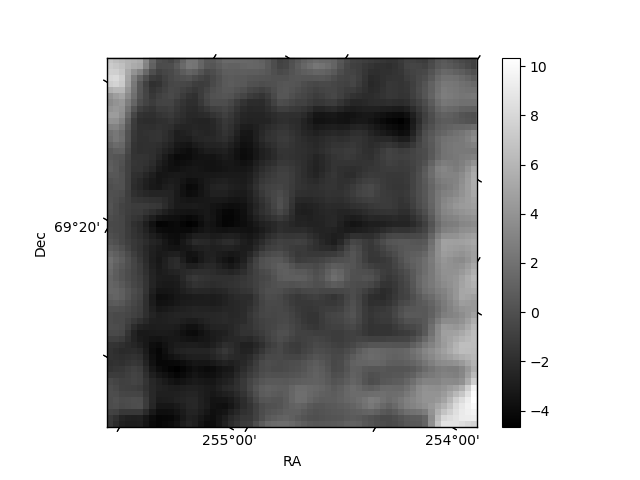
Histogram calculated using DETX and DETY for each event in the final _common_clean file
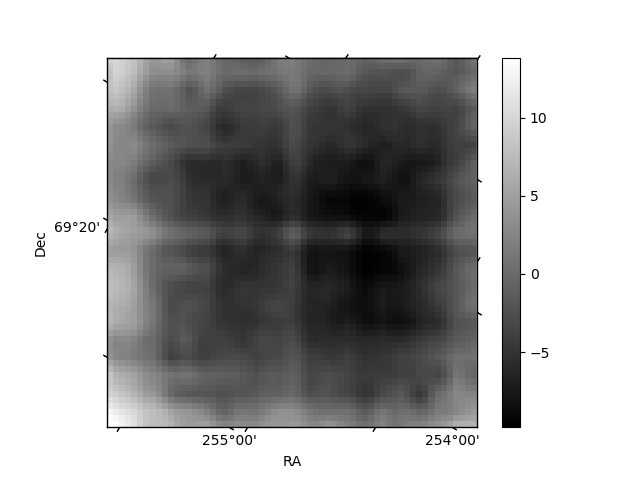
| Quadrant A | 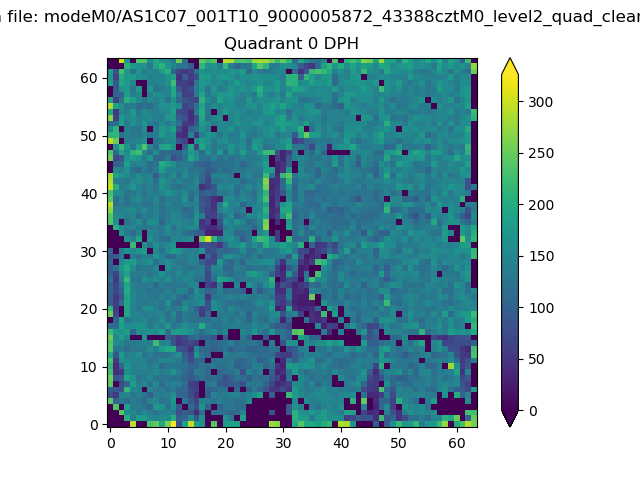 |
 |
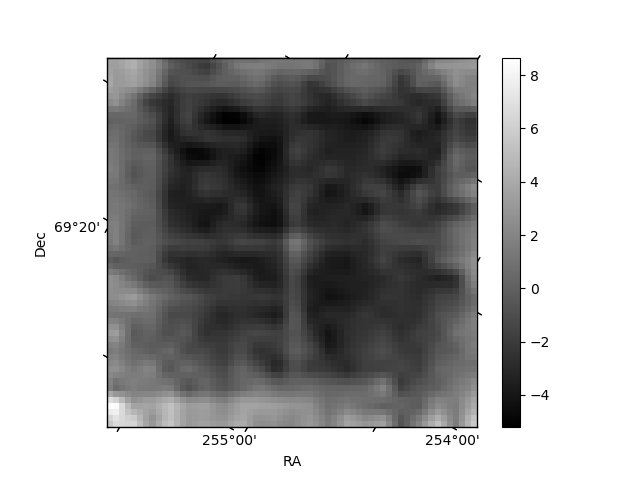
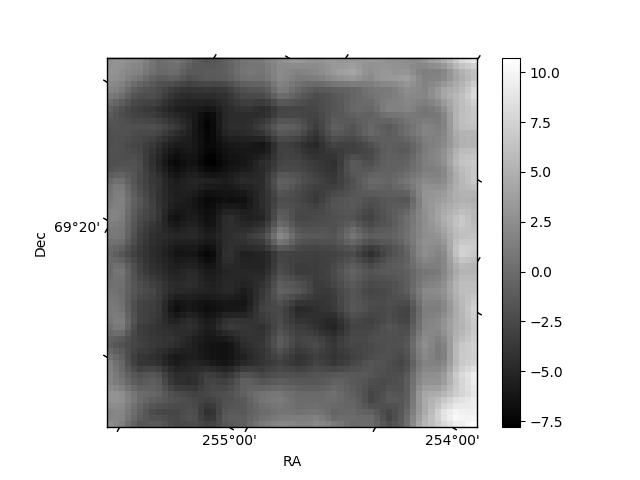
Quadrant B |
|---|---|---|---|
| Quadrant D | 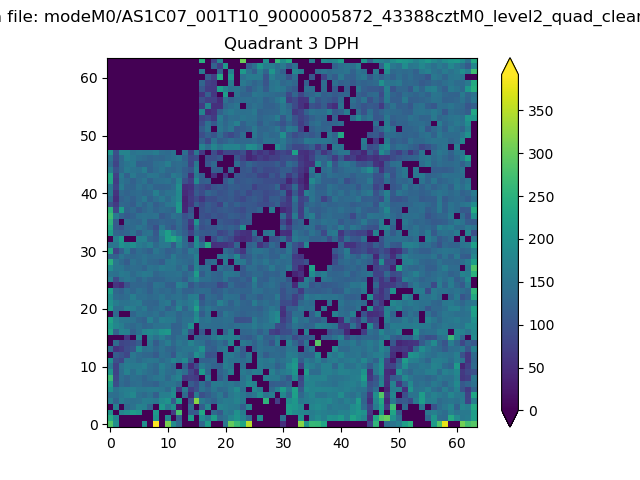 |
 |
Quadrant C |
| Plot type | Count rate plots | Images |
|---|---|---|
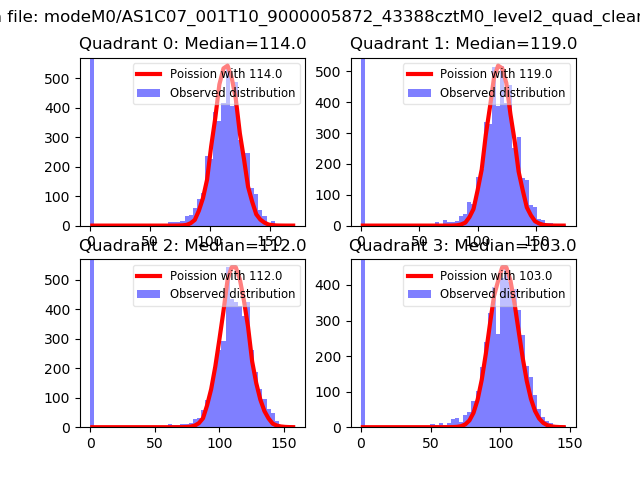
| Comparison with Poisson distribution Blue bars denote a histogram of data divided into 1 sec bins. Red curve is a Poisson curve with rate = median count rate of data. |
 |
 |
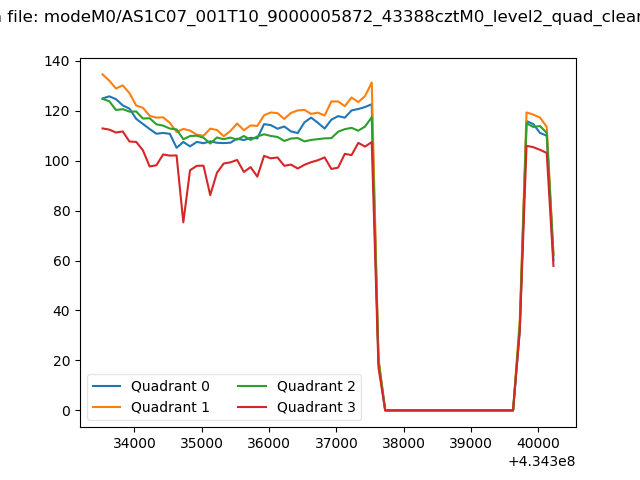
| Quadrant-wise count rates Data is divided into 100 sec bins |
 |
|
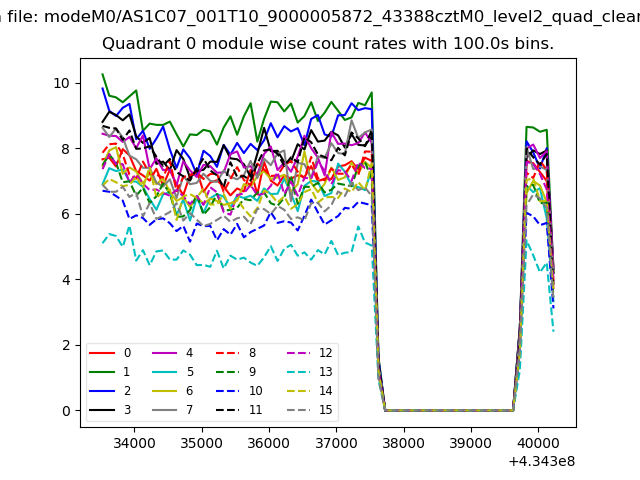
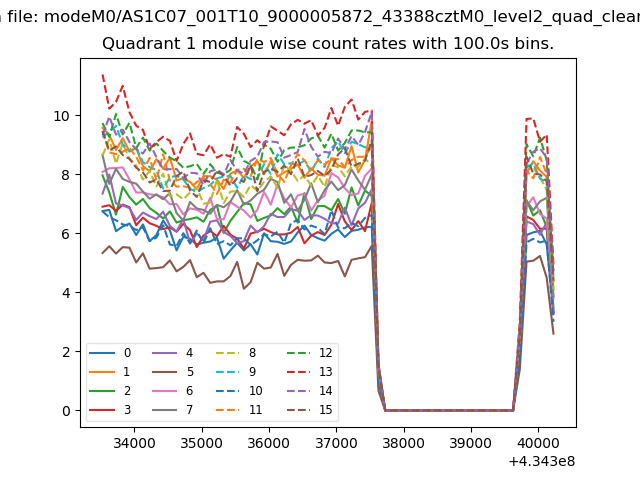
| Module-wise count rates for Quadrant A Data is divided into 100 sec bins |
 |
 |
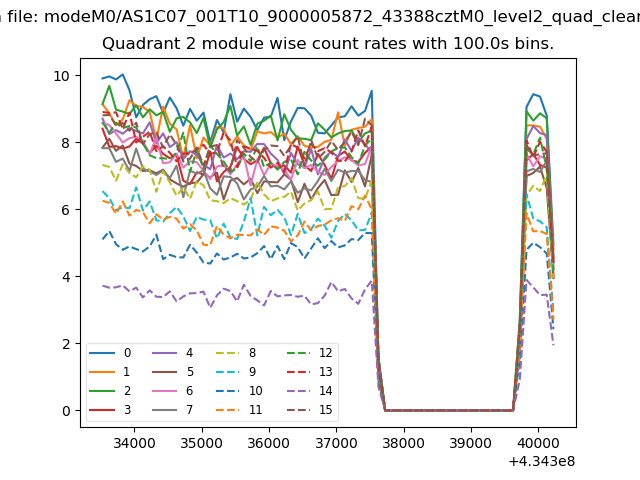
| Module-wise count rates for Quadrant B Data is divided into 100 sec bins |
 |
 |
| Module-wise count rates for Quadrant C Data is divided into 100 sec bins |
 |
 |
| Module-wise count rates for Quadrant D Data is divided into 100 sec bins |
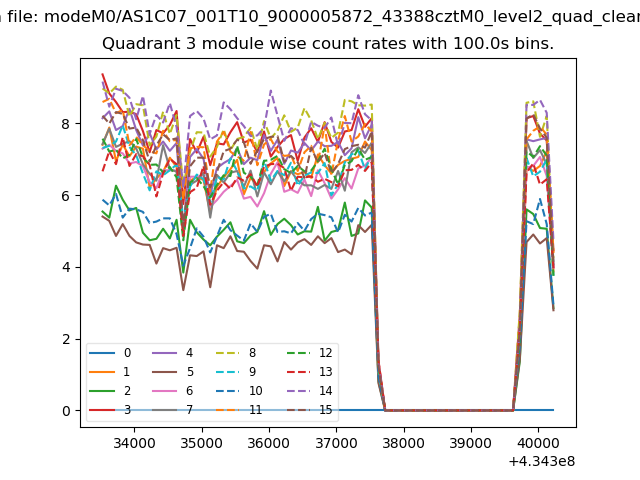 |
 |
| Parameter | Plot |
|---|---|
| CZT HV Monitor | 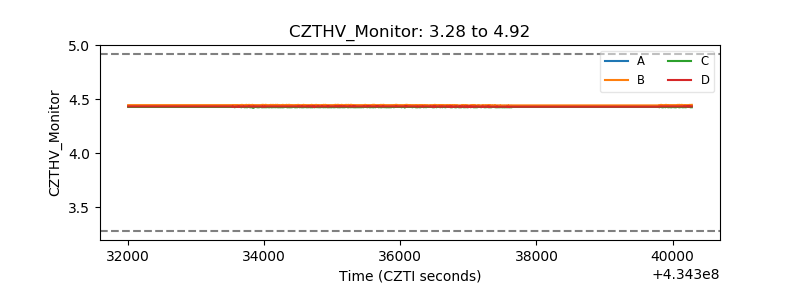 |
| D_VDD | 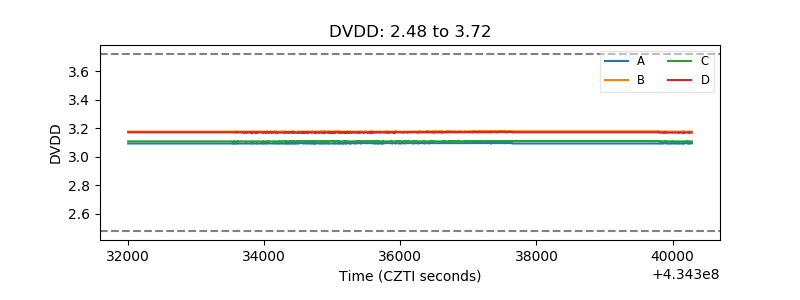 |
| Temperature 1 | 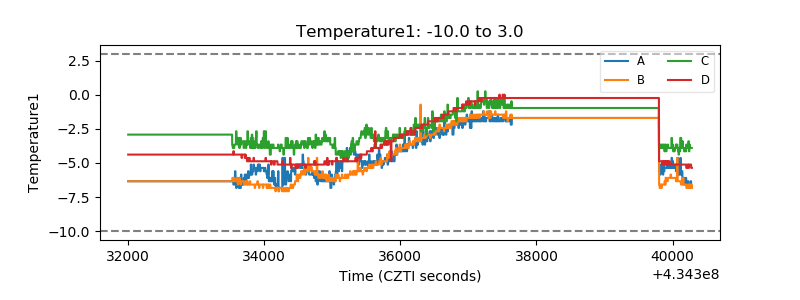 |
| Veto HV Monitor | 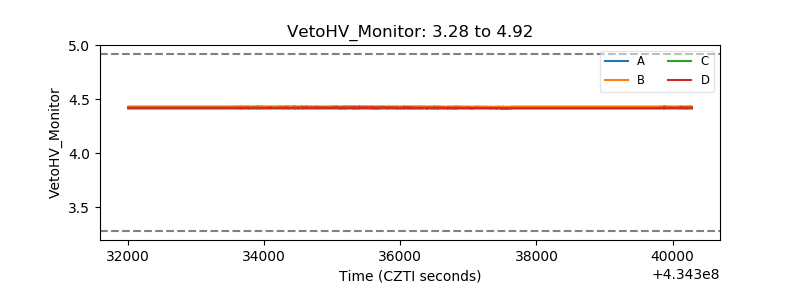 |
| Veto LLD | 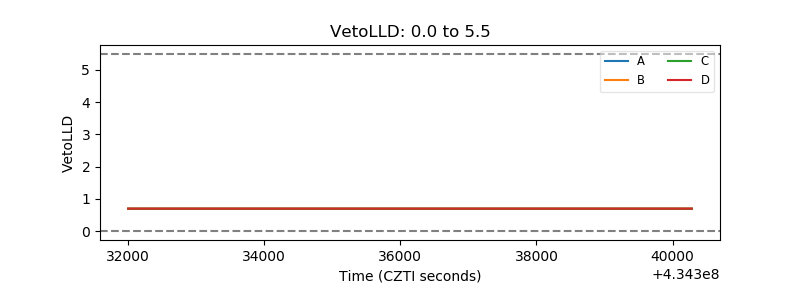 |
| Alpha Counter | 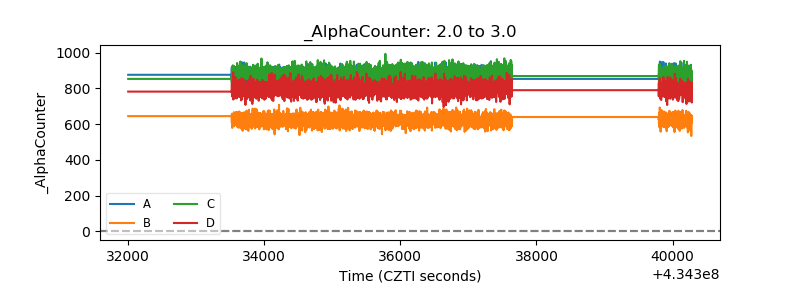 |
| _CPM_Rate | 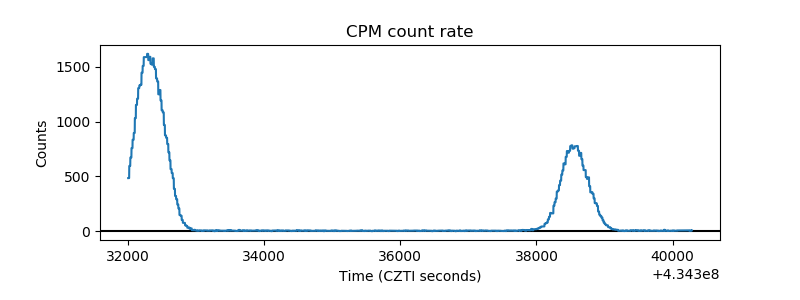 |
| CZT Counter | 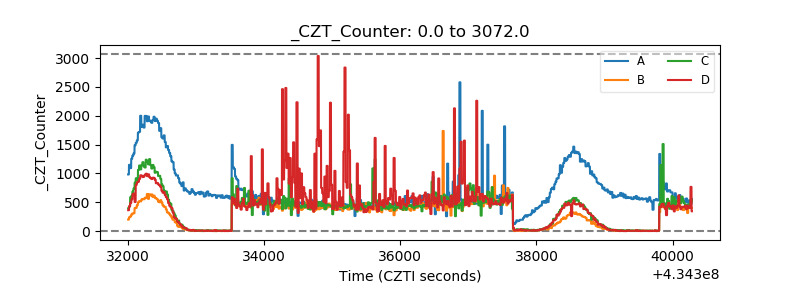 |
| +2.5 Volts monitor | 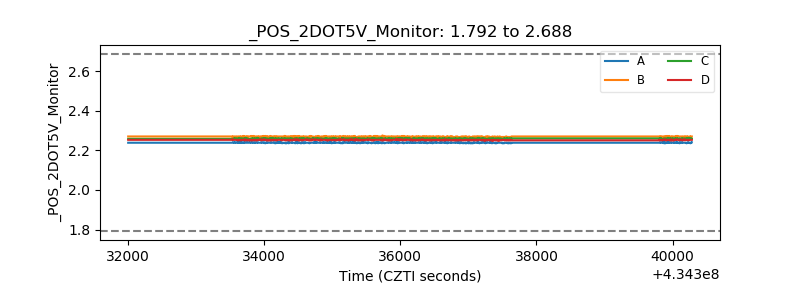 |
| +5 Volts monitor | 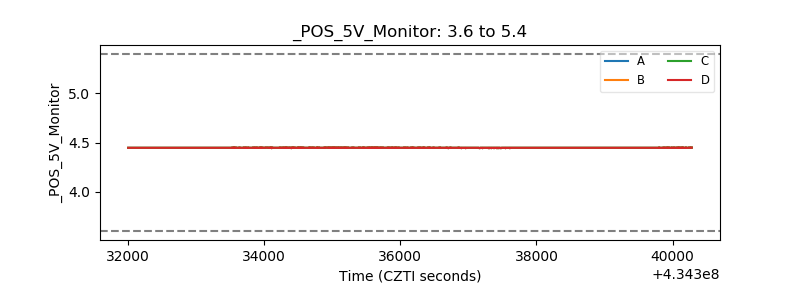 |
| _ROLL_ROT | 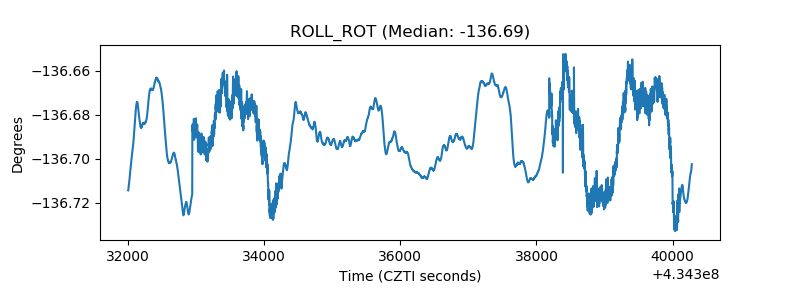 |
| _Roll_DEC |  |
| _Roll_RA | 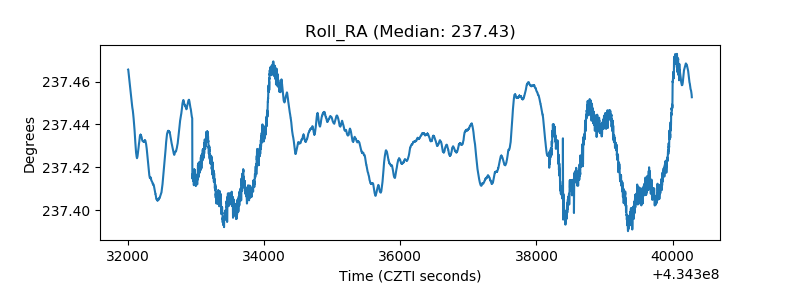 |
| Veto Counter | 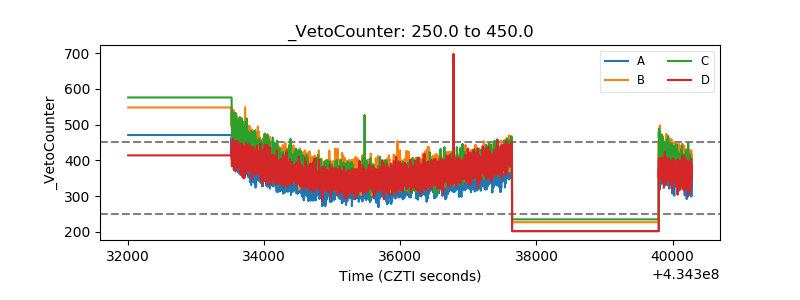 |