| Param | Original file | Final file |
|---|---|---|
| Filename | modeM0/AS1A12_018T01_9000005874_43388cztM0_level2.fits | modeM0/AS1A12_018T01_9000005874_43388cztM0_level2_quad_clean.evt |
| Size (bytes) | 6,399,360 | 763,200 |
| Size | 6.1 MB | 745.3 KB |
| Events in quadrant A | 55,677 | 1,869 |
| Events in quadrant B | 43,639 | 1,591 |
| Events in quadrant C | 50,835 | 1,926 |
| Events in quadrant D | 74,404 | 1,482 |
| Mode M0 | |||
|---|---|---|---|
| Quadrant | BADHDUFLAG | Total packets | Discarded packets |
| A | 0 | 231 | 0 |
| B | 0 | 218 | 0 |
| C | 0 | 229 | 0 |
| D | 0 | 303 | 4 |
| Mode SS | |||
|---|---|---|---|
| Quadrant | BADHDUFLAG | Total packets | Discarded packets |
| A | 0 | 4 | 0 |
| B | 0 | 4 | 0 |
| C | 0 | 4 | 0 |
| D | 0 | 4 | 0 |
| Quadrant | Total seconds | Saturated seconds | Saturation percentage |
|---|---|---|---|
| A | 109 | 0 | 0.000000% |
| B | 109 | 0 | 0.000000% |
| C | 109 | 0 | 0.000000% |
| D | 108 | 3 | 2.777778% |
Noise dominated data is calculated using 1-second bins in cleaned event files. If a bin has >2000 counts, and if more than 50% of those come from <1% of pixels, then it is considered to be noise-dominated and hence unusable.
| Quadrant | # 1 sec bins | Bins with >0 counts | Bins with >2000 counts | High rate bins dominated by noise | Noise dominated (total time) | Noise dominated (detector-on time) | Marked lightcurve |
|---|---|---|---|---|---|---|---|
| A | 109 | 109 | 0 | 0 | 0.00% | 0.00% | 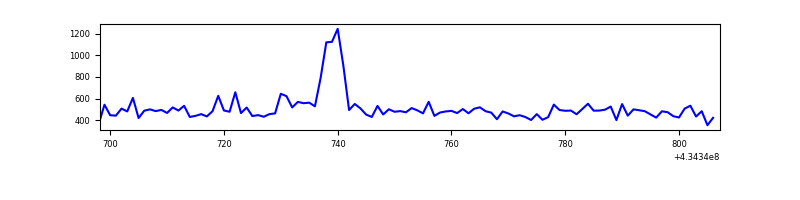 |
| B | 109 | 109 | 0 | 0 | 0.00% | 0.00% | 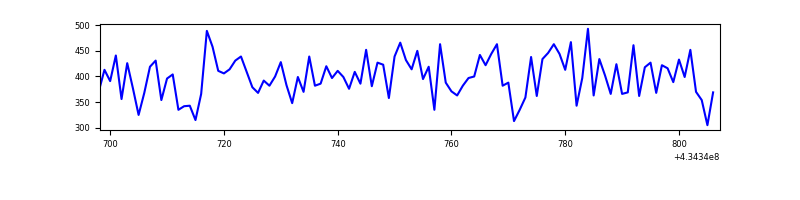 |
| C | 109 | 109 | 0 | 0 | 0.00% | 0.00% | 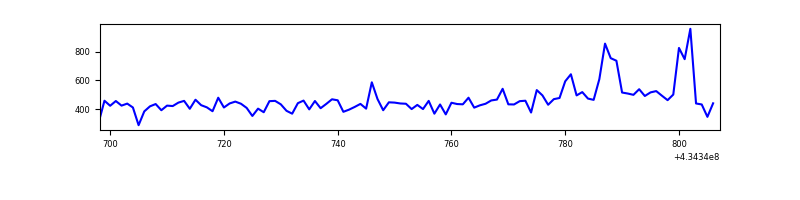 |
| D | 108 | 108 | 4 | 4 | 3.70% | 3.70% | 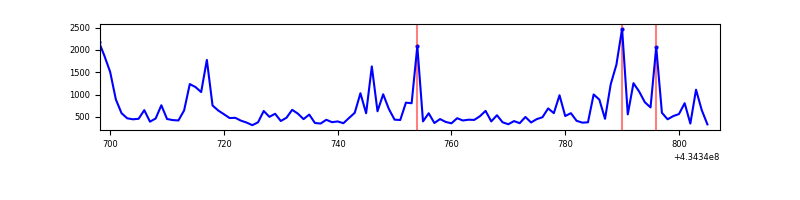 |
Top three noisy pixels from each quadrant. If the there are fewer than three noisy pixels in the level2.evt file, extra rows are filled as -1
| Pixel properties | Quadrant properties | ||||||
|---|---|---|---|---|---|---|---|
| Quadrant | DetID | PixID | Counts | Sigma | Mean | Median | Sigma |
| A | 10 | 83 | 8024 | 1924.12 | 11 | 10 | 4.2 |
| A | 15 | 237 | 4229 | 1012.96 | 11 | 10 | 4.2 |
| A | 13 | 248 | 261 | 60.26 | 11 | 10 | 4.2 |
| B | 12 | 111 | 302 | 75.15 | 10 | 10 | 3.9 |
| B | 11 | 111 | 271 | 67.17 | 10 | 10 | 3.9 |
| B | 14 | 111 | 259 | 64.08 | 10 | 10 | 3.9 |
| C | 15 | 214 | 4141 | 1018.11 | 10 | 10 | 4.1 |
| C | 5 | 1 | 3085 | 757.86 | 10 | 10 | 4.1 |
| C | 15 | 111 | 1491 | 365.0 | 10 | 10 | 4.1 |
| D | 12 | 6 | 32169 | 7596.4 | 10 | 9 | 4.2 |
| D | 1 | 52 | 2104 | 494.85 | 10 | 9 | 4.2 |
| D | 13 | 249 | 600 | 139.6 | 10 | 9 | 4.2 |
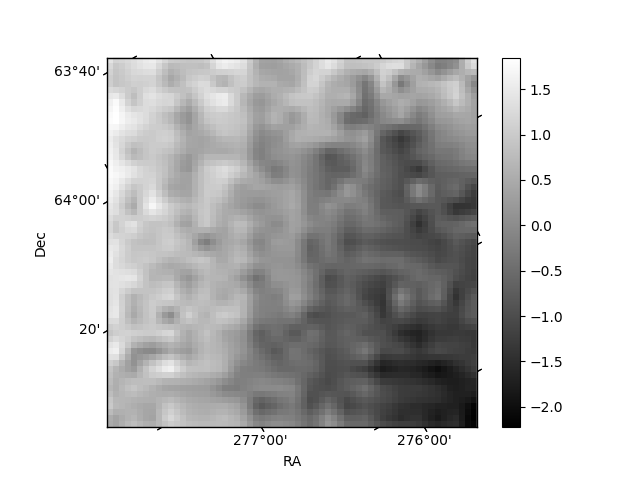
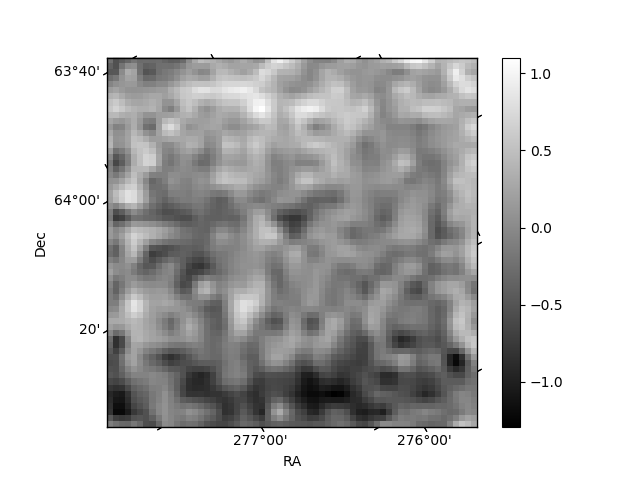
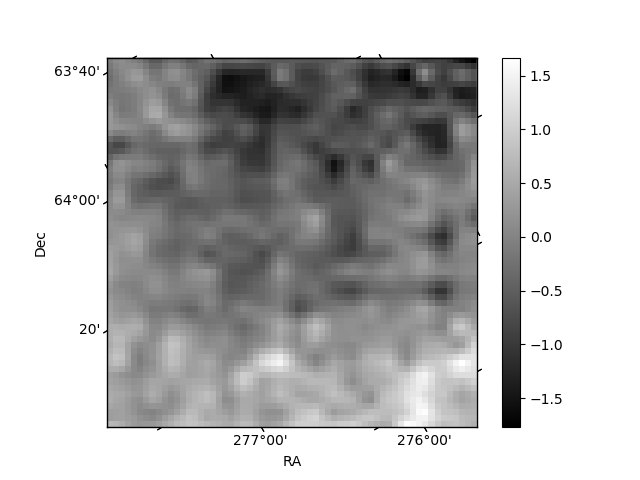
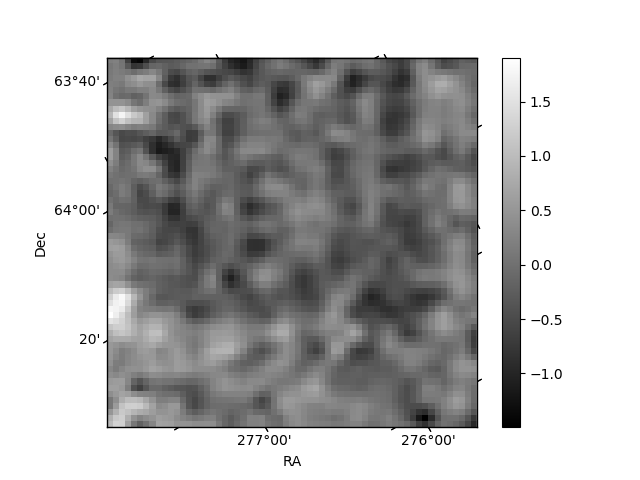
Histogram calculated using DETX and DETY for each event in the final _common_clean file
| Quadrant A | 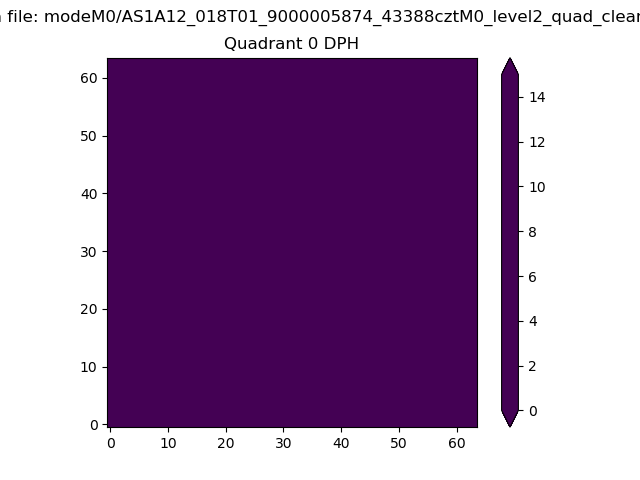 |
 |
Quadrant B |
|---|---|---|---|
| Quadrant D |  |
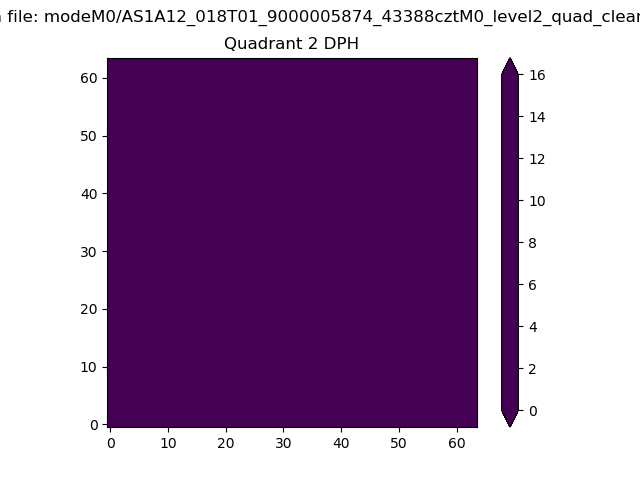 |
Quadrant C |
| Plot type | Count rate plots | Images |
|---|---|---|
| Comparison with Poisson distribution Blue bars denote a histogram of data divided into 1 sec bins. Red curve is a Poisson curve with rate = median count rate of data. |
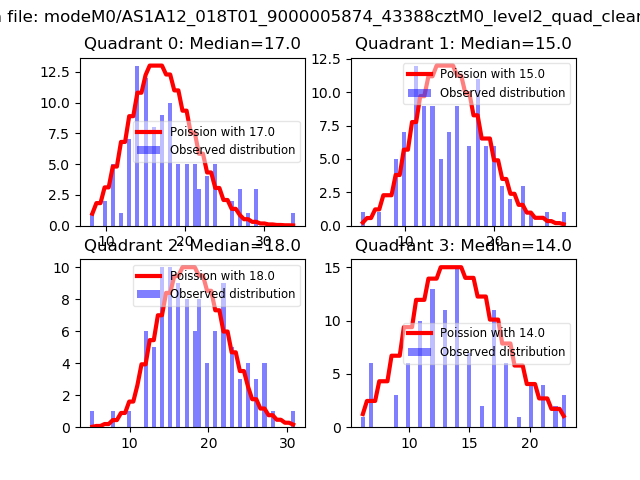 |
 |
| Quadrant-wise count rates Data is divided into 100 sec bins |
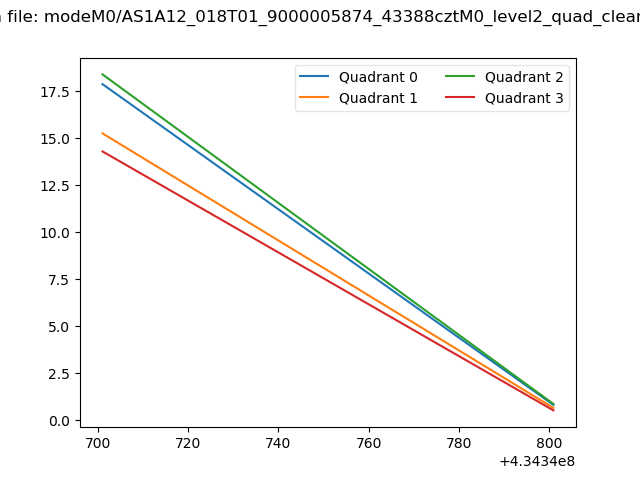 |
|
| Module-wise count rates for Quadrant A Data is divided into 100 sec bins |
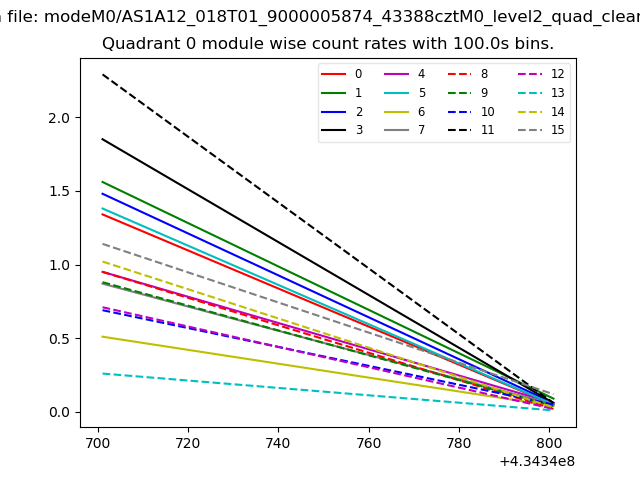 |
 |
| Module-wise count rates for Quadrant B Data is divided into 100 sec bins |
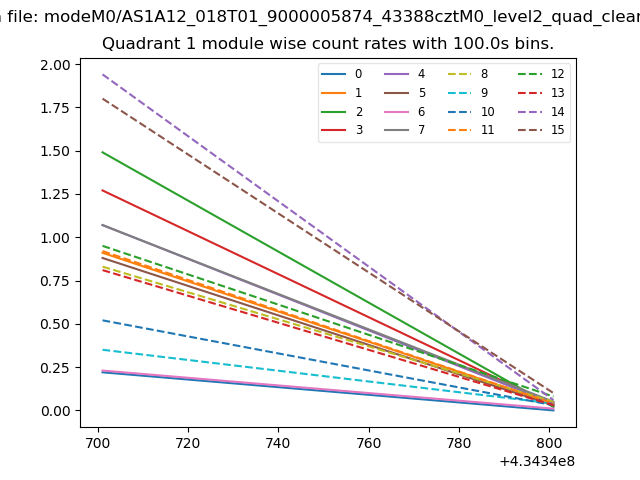 |
 |
| Module-wise count rates for Quadrant C Data is divided into 100 sec bins |
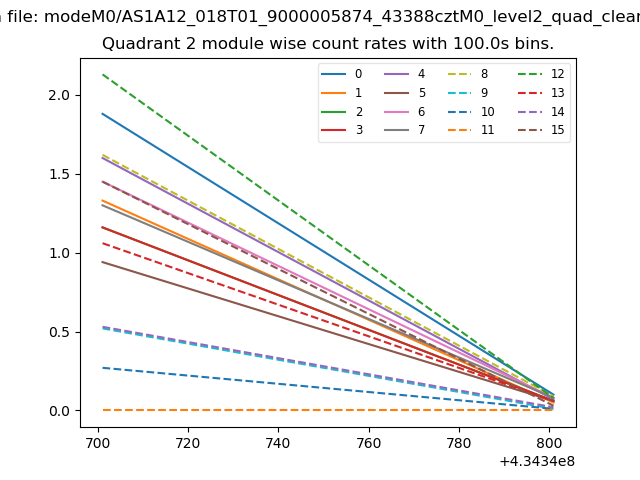 |
 |
| Module-wise count rates for Quadrant D Data is divided into 100 sec bins |
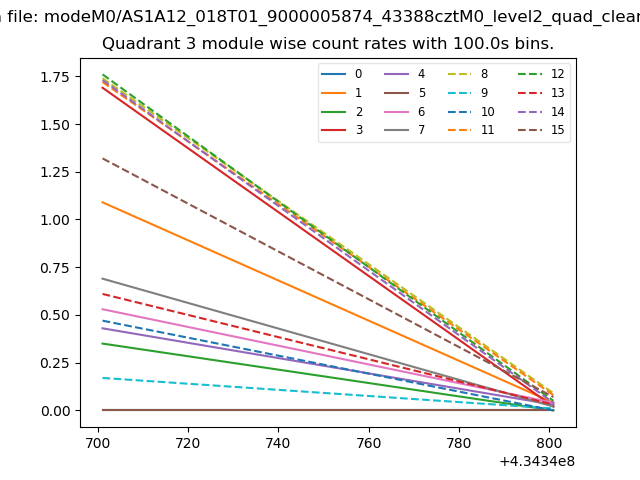 |
 |
| Parameter | Plot |
|---|---|
| CZT HV Monitor | 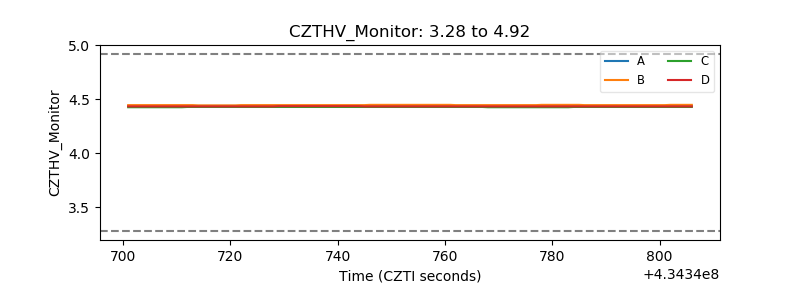 |
| D_VDD | 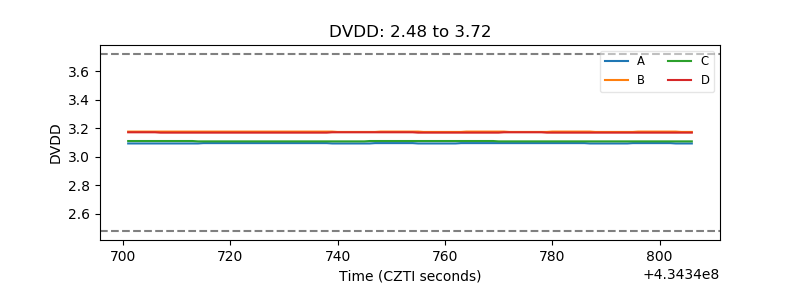 |
| Temperature 1 | 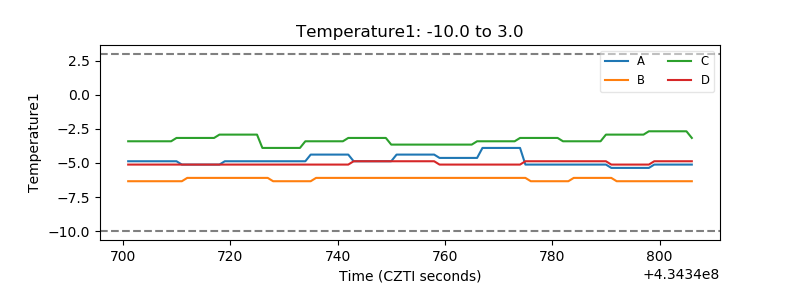 |
| Veto HV Monitor | 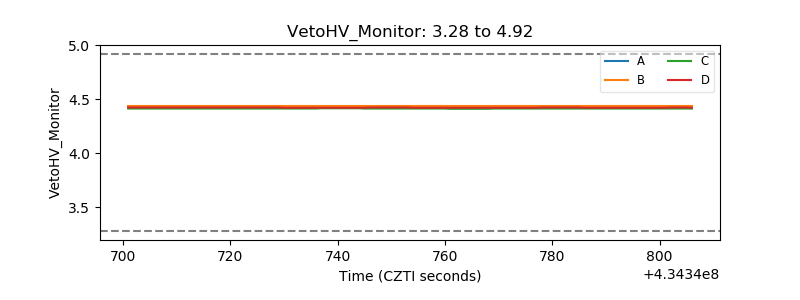 |
| Veto LLD | 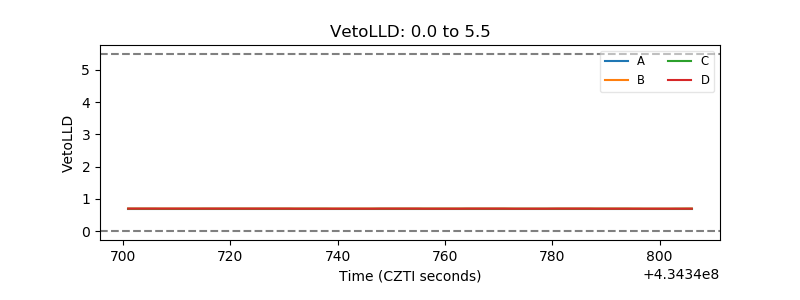 |
| Alpha Counter | 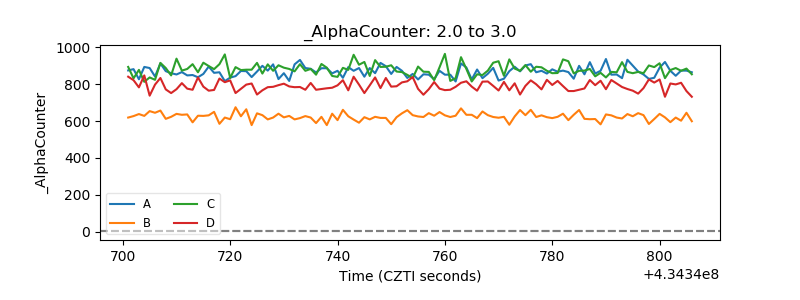 |
| _CPM_Rate | 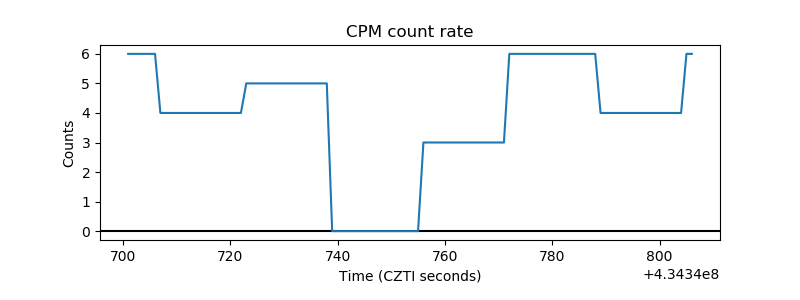 |
| CZT Counter | 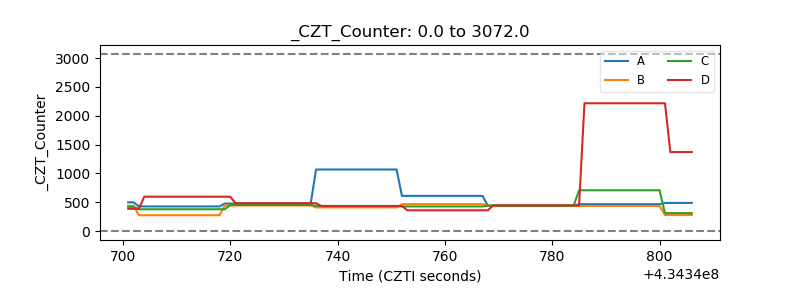 |
| +2.5 Volts monitor | 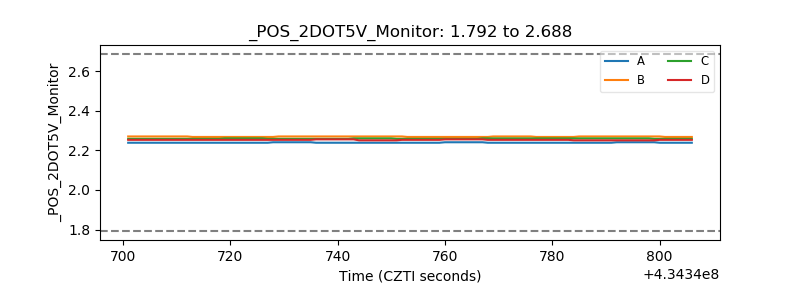 |
| +5 Volts monitor | 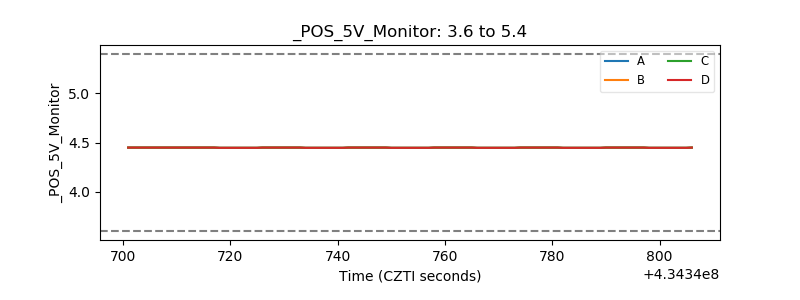 |
| _ROLL_ROT | 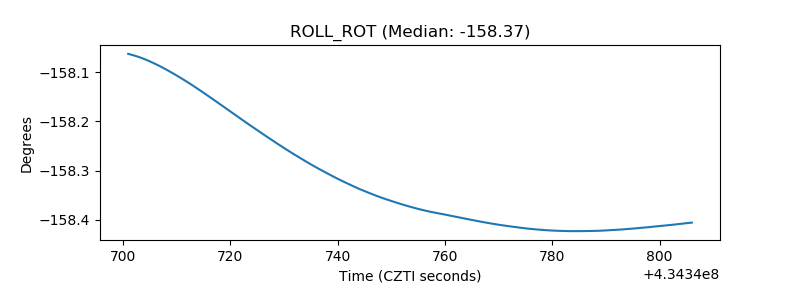 |
| _Roll_DEC | 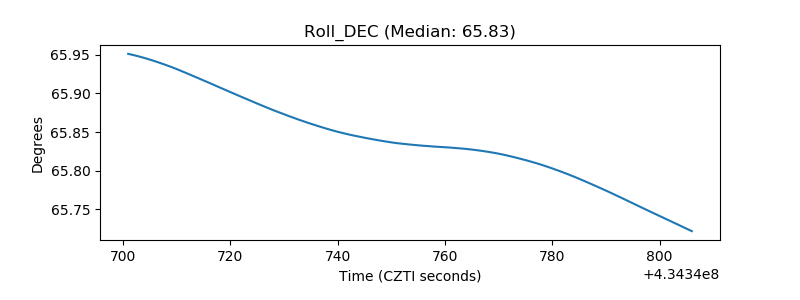 |
| _Roll_RA | 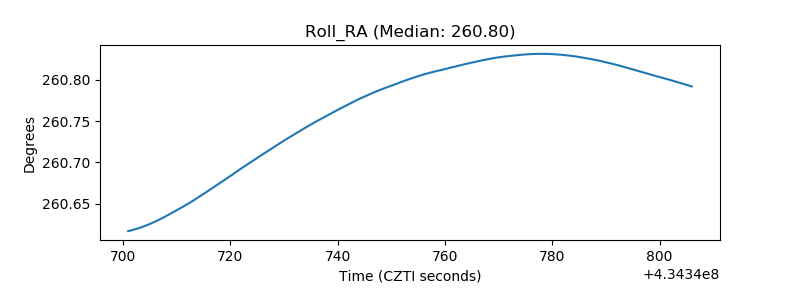 |
| Veto Counter | 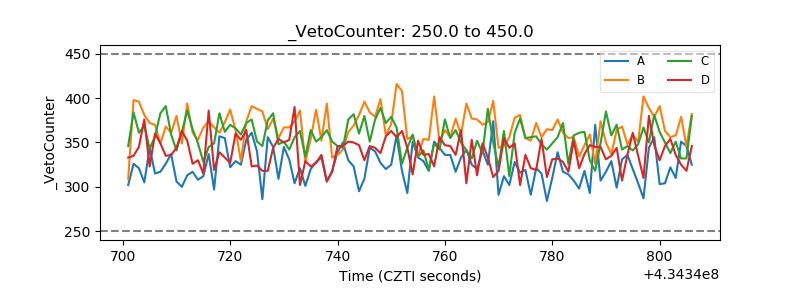 |