| Param | Original file | Final file |
|---|---|---|
| Filename | modeM0/AS1A12_018T01_9000005874_43389cztM0_level2.fits | modeM0/AS1A12_018T01_9000005874_43389cztM0_level2_quad_clean.evt |
| Size (bytes) | 251,608,320 | 67,674,240 |
| Size | 240.0 MB | 64.5 MB |
| Events in quadrant A | 2,827,469 | 441,031 |
| Events in quadrant B | 2,016,366 | 466,219 |
| Events in quadrant C | 2,005,666 | 445,608 |
| Events in quadrant D | 2,139,376 | 403,375 |
| Mode M0 | |||
|---|---|---|---|
| Quadrant | BADHDUFLAG | Total packets | Discarded packets |
| A | 0 | 10963 | 1 |
| B | 0 | 9131 | 1 |
| C | 0 | 8835 | 1 |
| D | 0 | 9559 | 1 |
| Mode M9 | |||
|---|---|---|---|
| Quadrant | BADHDUFLAG | Total packets | Discarded packets |
| A | 0 | 21 | 0 |
| B | 0 | 21 | 0 |
| C | 0 | 21 | 0 |
| D | 0 | 21 | 0 |
| Mode SS | |||
|---|---|---|---|
| Quadrant | BADHDUFLAG | Total packets | Discarded packets |
| A | 0 | 86 | 0 |
| B | 0 | 86 | 0 |
| C | 0 | 86 | 0 |
| D | 0 | 86 | 0 |
| Quadrant | Total seconds | Saturated seconds | Saturation percentage |
|---|---|---|---|
| A | 4154 | 191 | 4.597978% |
| B | 4154 | 66 | 1.588830% |
| C | 4154 | 2 | 0.048146% |
| D | 4154 | 90 | 2.166586% |
Noise dominated data is calculated using 1-second bins in cleaned event files. If a bin has >2000 counts, and if more than 50% of those come from <1% of pixels, then it is considered to be noise-dominated and hence unusable.
| Quadrant | # 1 sec bins | Bins with >0 counts | Bins with >2000 counts | High rate bins dominated by noise | Noise dominated (total time) | Noise dominated (detector-on time) | Marked lightcurve |
|---|---|---|---|---|---|---|---|
| A | 6248 | 4155 | 176 | 176 | 2.82% | 4.24% | 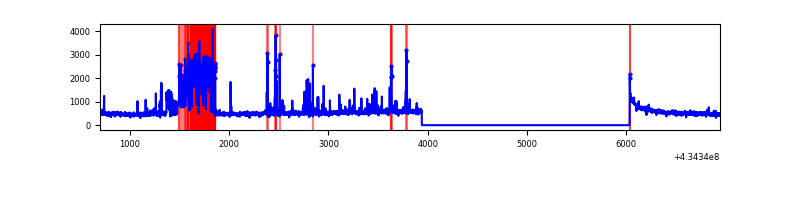 |
| B | 6248 | 4155 | 40 | 40 | 0.64% | 0.96% | 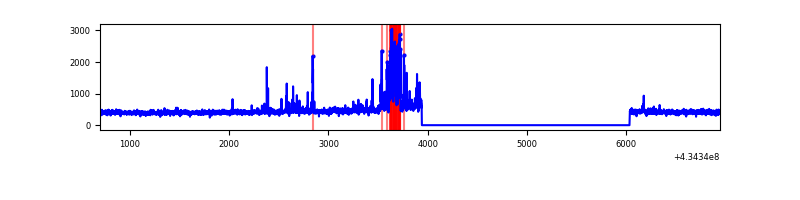 |
| C | 6248 | 4155 | 2 | 2 | 0.03% | 0.05% | 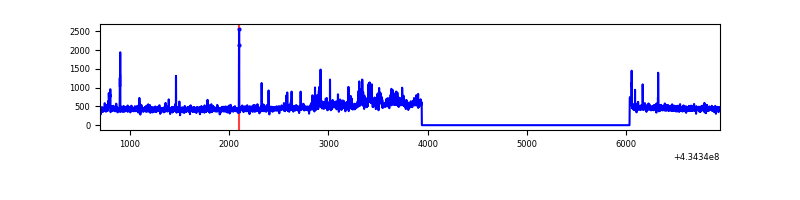 |
| D | 6248 | 4155 | 71 | 71 | 1.14% | 1.71% | 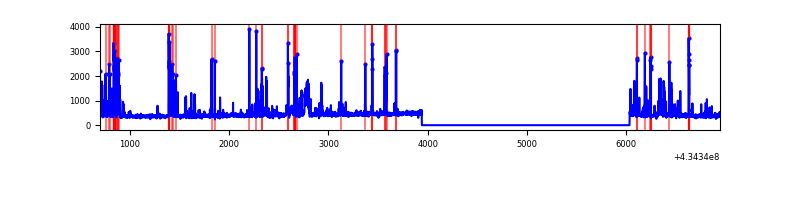 |
Top three noisy pixels from each quadrant. If the there are fewer than three noisy pixels in the level2.evt file, extra rows are filled as -1
| Pixel properties | Quadrant properties | ||||||
|---|---|---|---|---|---|---|---|
| Quadrant | DetID | PixID | Counts | Sigma | Mean | Median | Sigma |
| A | 15 | 237 | 715569 | 7924.73 | 434 | 425 | 90.2 |
| A | 10 | 83 | 399144 | 4418.33 | 434 | 425 | 90.2 |
| A | 13 | 248 | 18065 | 195.47 | 434 | 425 | 90.2 |
| B | 0 | 186 | 220822 | 2614.74 | 436 | 424 | 84.3 |
| B | 15 | 85 | 21850 | 254.19 | 436 | 424 | 84.3 |
| B | 4 | 67 | 19483 | 226.11 | 436 | 424 | 84.3 |
| C | 15 | 214 | 170521 | 1708.25 | 425 | 428 | 99.6 |
| C | 3 | 233 | 129015 | 1291.4 | 425 | 428 | 99.6 |
| C | 15 | 111 | 35978 | 357.03 | 425 | 428 | 99.6 |
| D | 13 | 249 | 264538 | 2556.17 | 421 | 408 | 103.3 |
| D | 12 | 6 | 209747 | 2025.92 | 421 | 408 | 103.3 |
| D | 2 | 234 | 22493 | 213.73 | 421 | 408 | 103.3 |
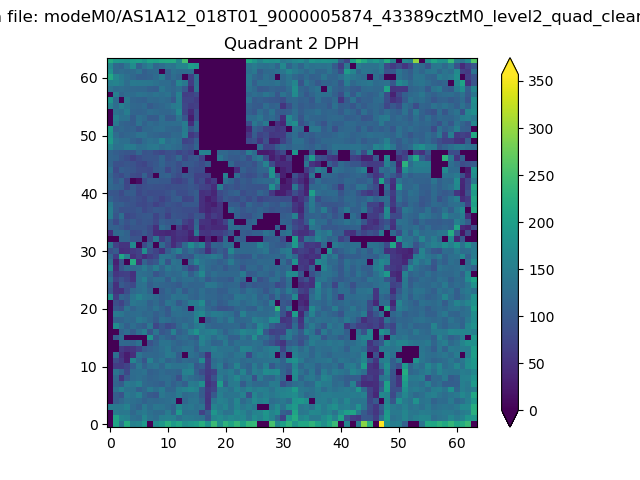
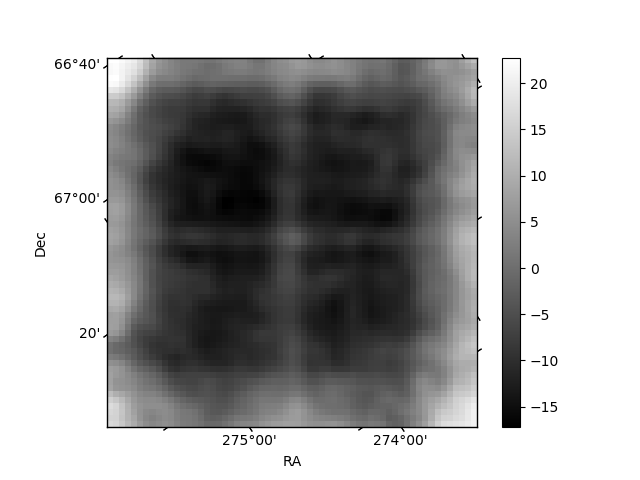
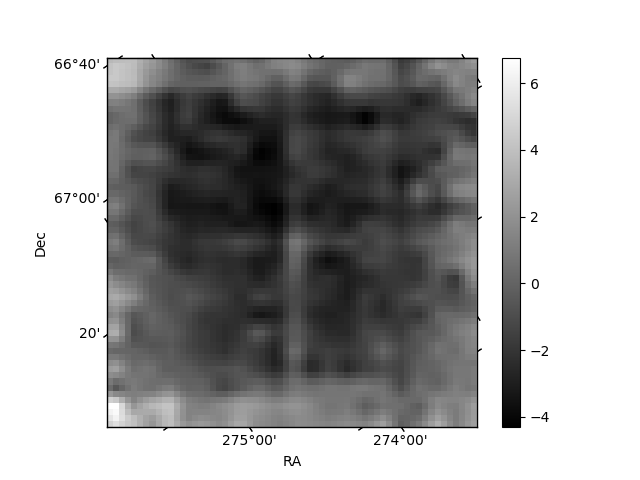
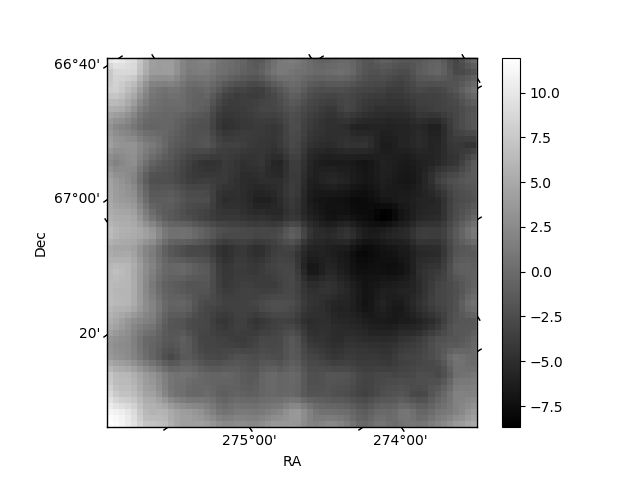
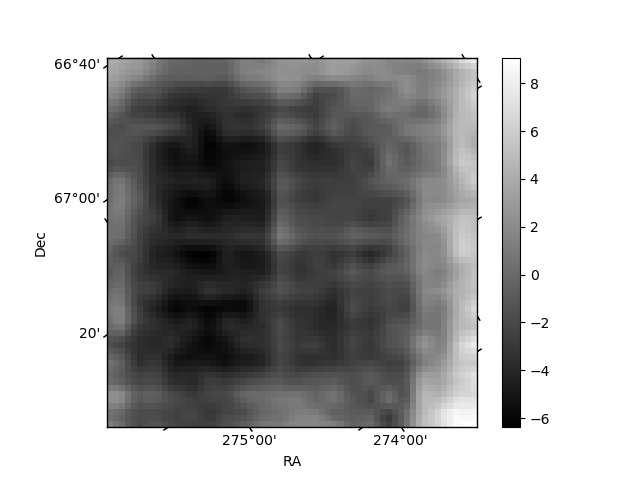
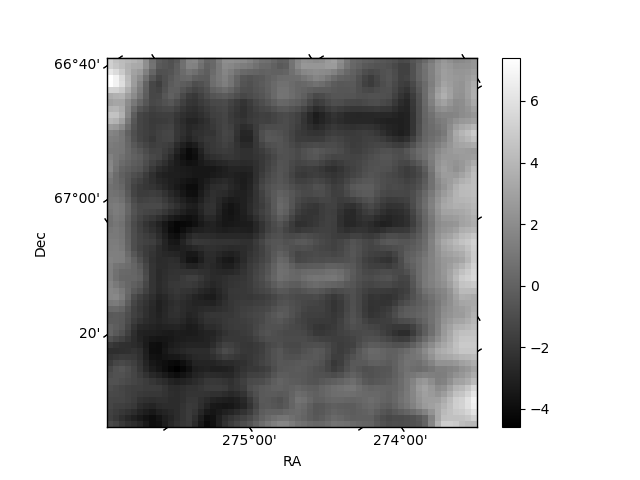
Histogram calculated using DETX and DETY for each event in the final _common_clean file
| Quadrant A | 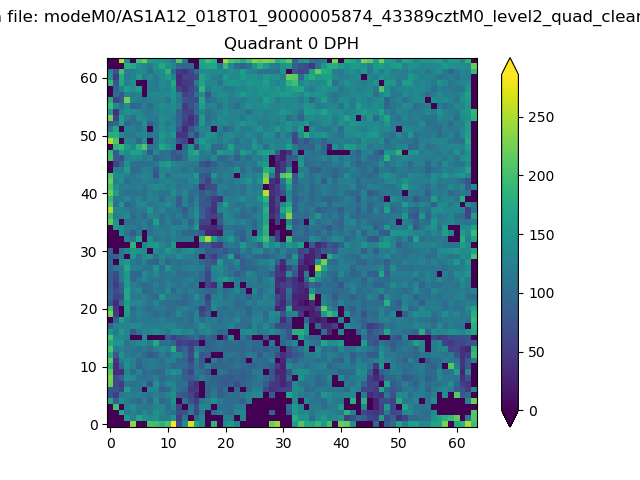 |
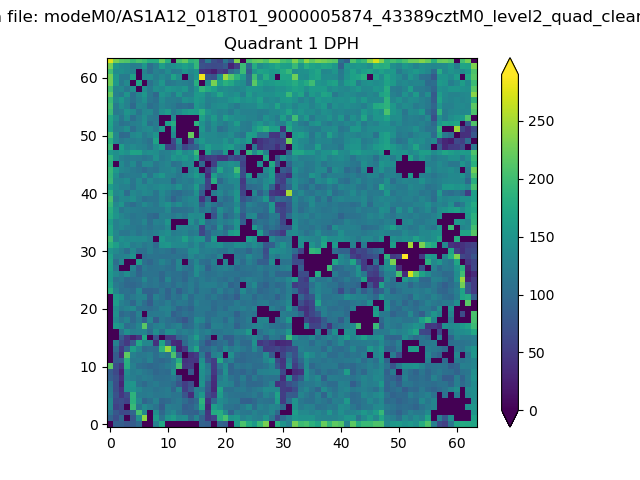 |
Quadrant B |
|---|---|---|---|
| Quadrant D | 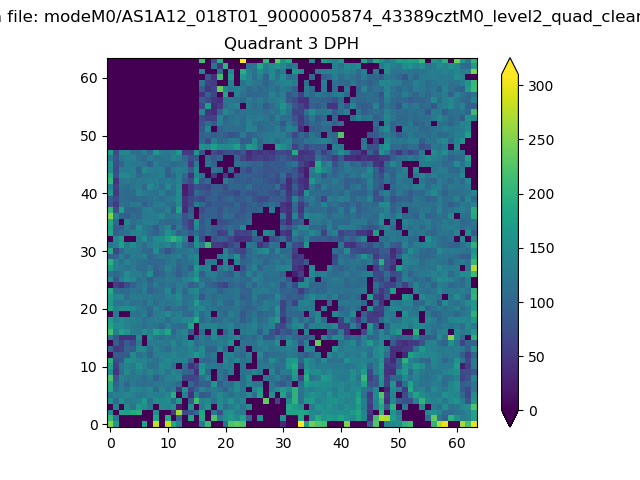 |
 |
Quadrant C |
| Plot type | Count rate plots | Images |
|---|---|---|
| Comparison with Poisson distribution Blue bars denote a histogram of data divided into 1 sec bins. Red curve is a Poisson curve with rate = median count rate of data. |
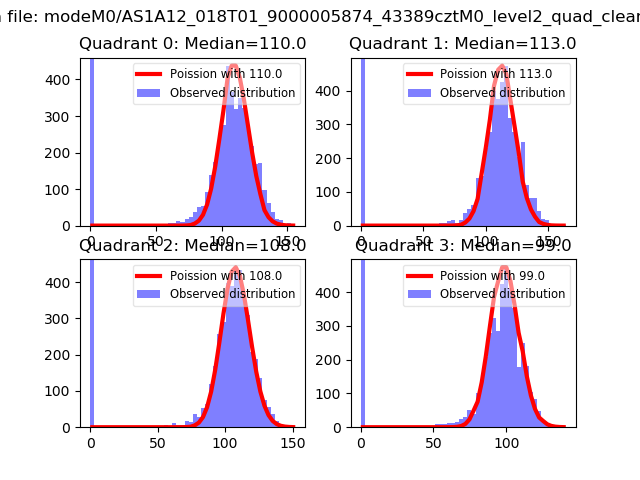 |
 |
| Quadrant-wise count rates Data is divided into 100 sec bins |
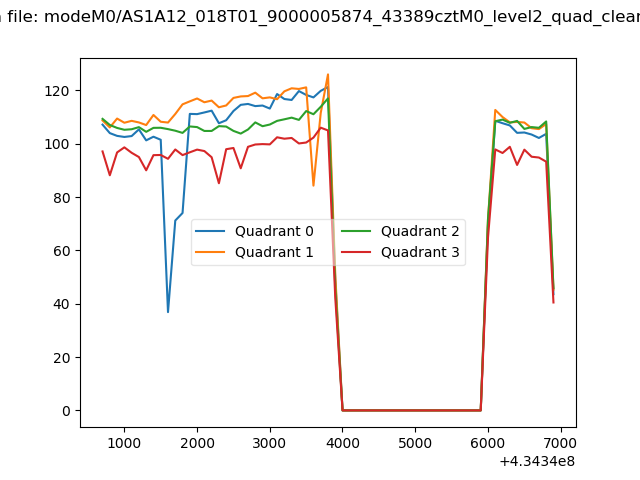 |
|
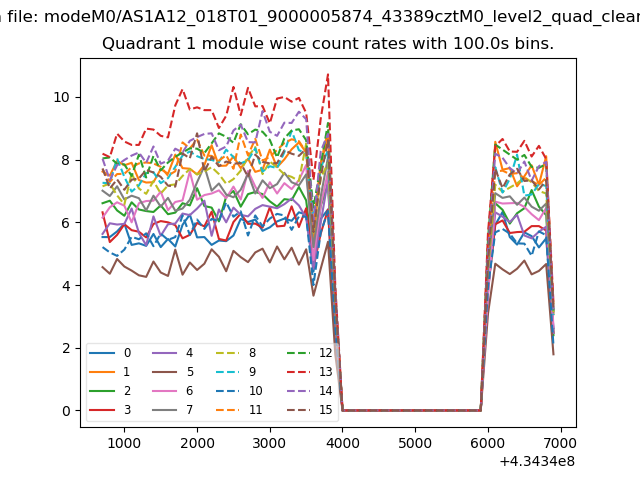
| Module-wise count rates for Quadrant A Data is divided into 100 sec bins |
 |
 |
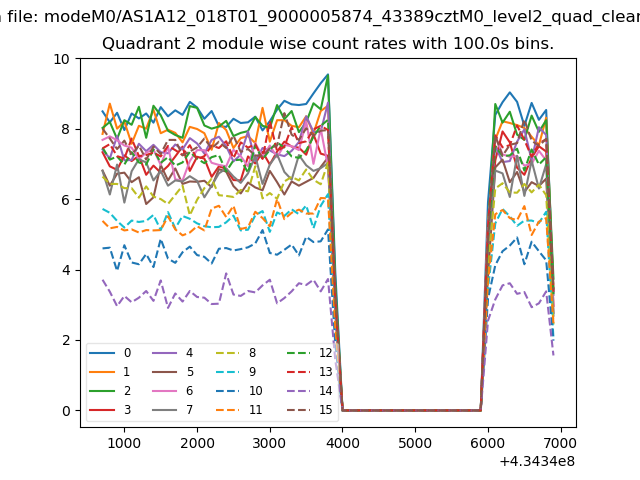
| Module-wise count rates for Quadrant B Data is divided into 100 sec bins |
 |
 |
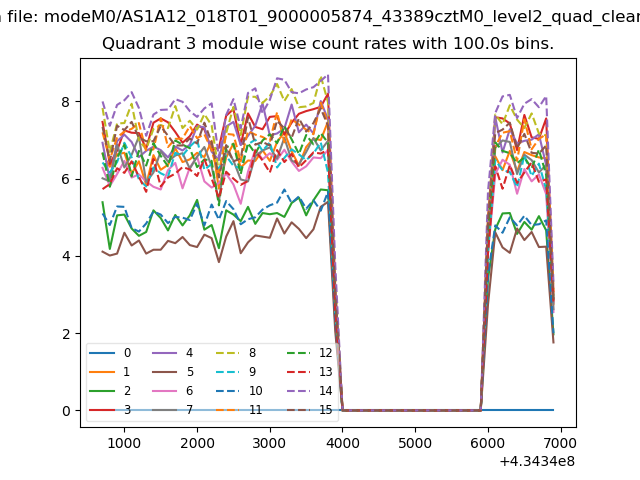
| Module-wise count rates for Quadrant C Data is divided into 100 sec bins |
 |
 |
| Module-wise count rates for Quadrant D Data is divided into 100 sec bins |
 |
 |
| Parameter | Plot |
|---|---|
| CZT HV Monitor | 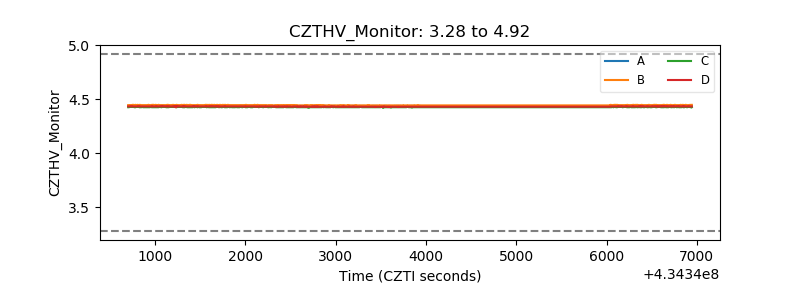 |
| D_VDD | 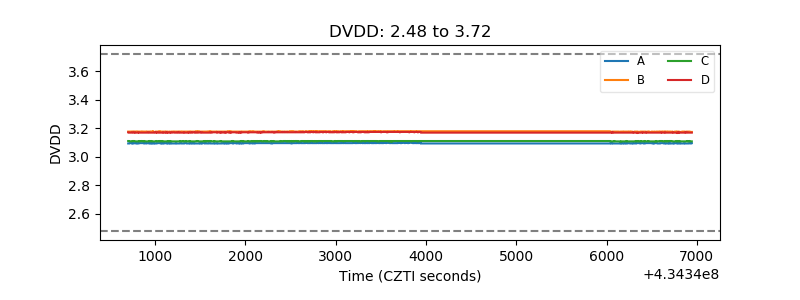 |
| Temperature 1 | 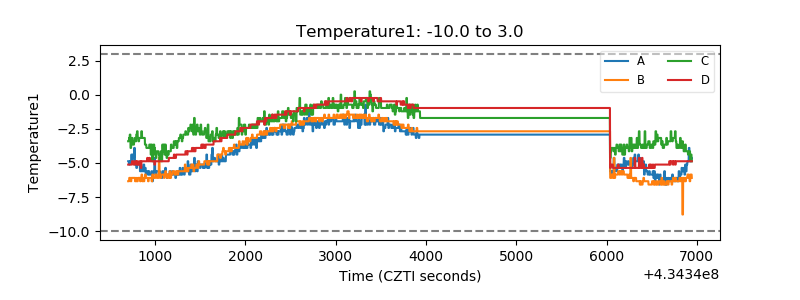 |
| Veto HV Monitor | 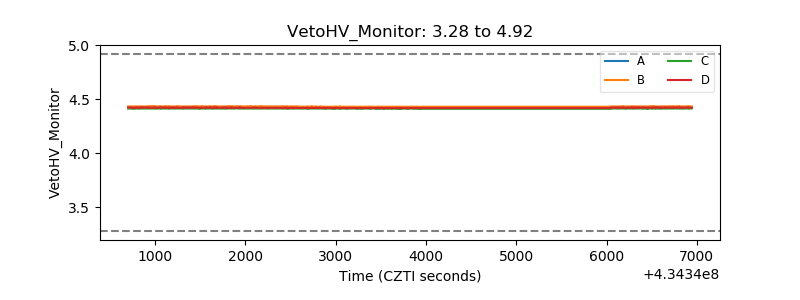 |
| Veto LLD | 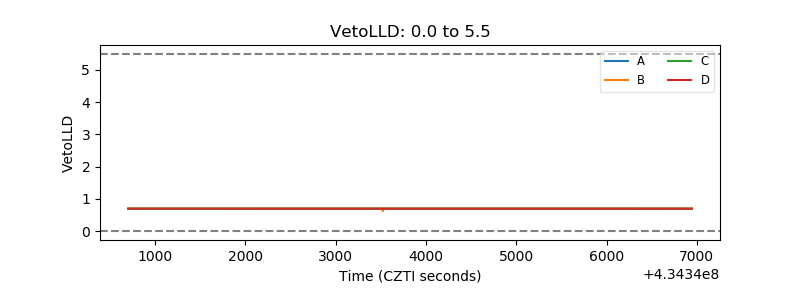 |
| Alpha Counter | 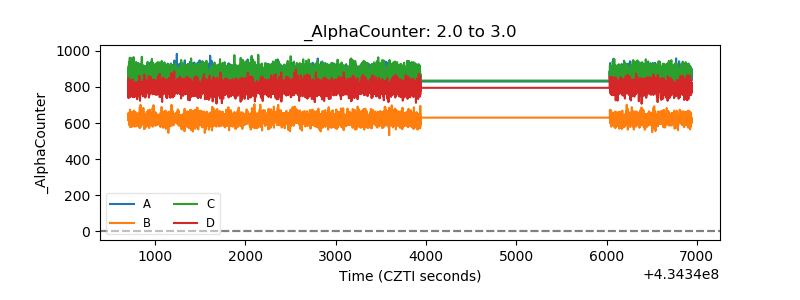 |
| _CPM_Rate | 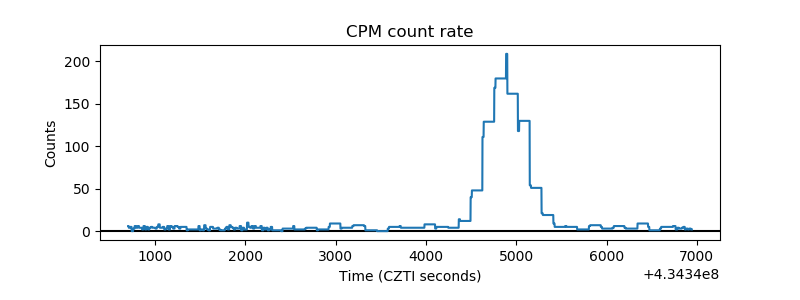 |
| CZT Counter | 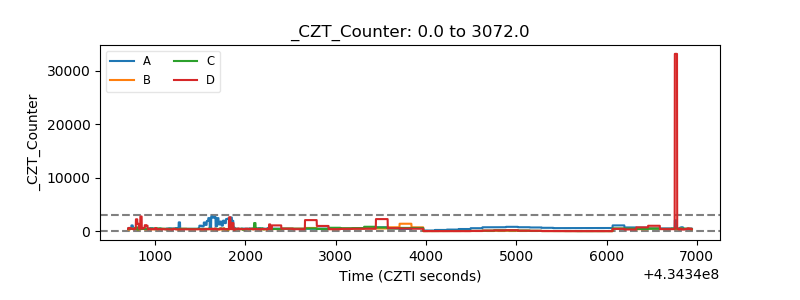 |
| +2.5 Volts monitor | 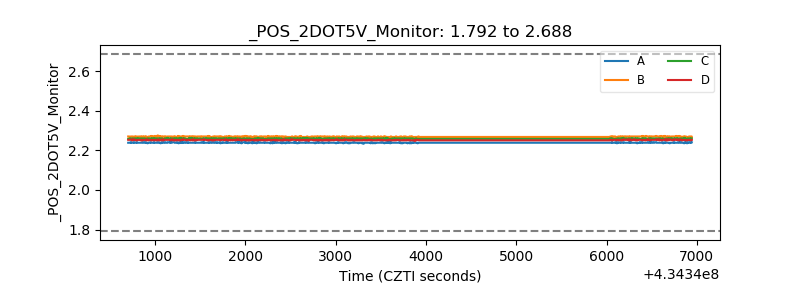 |
| +5 Volts monitor | 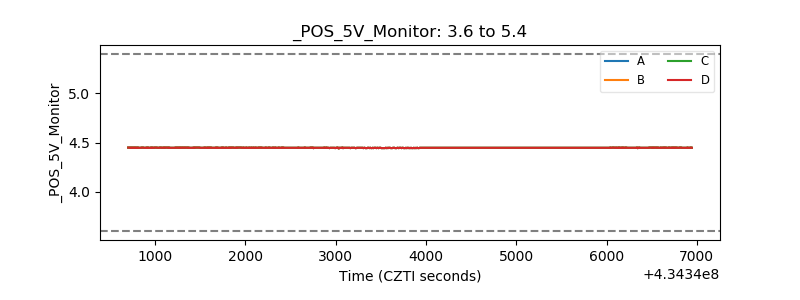 |
| _ROLL_ROT | 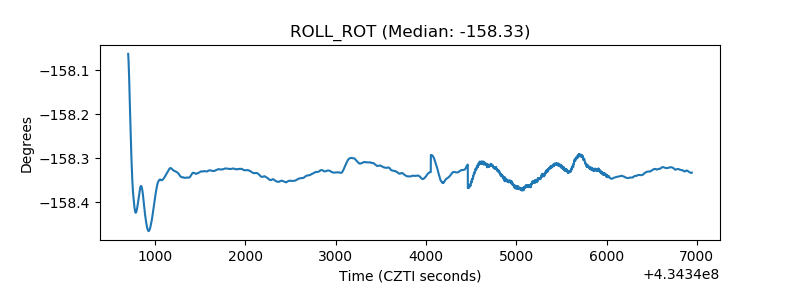 |
| _Roll_DEC | 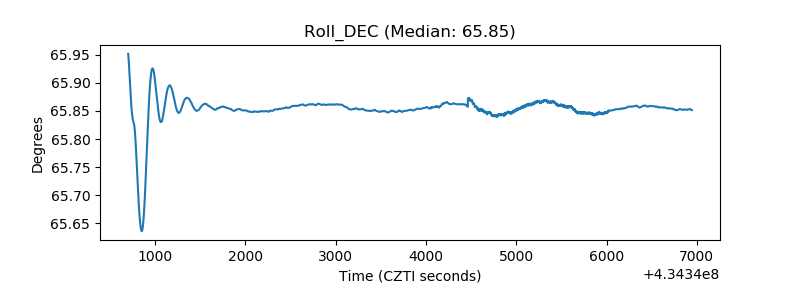 |
| _Roll_RA | 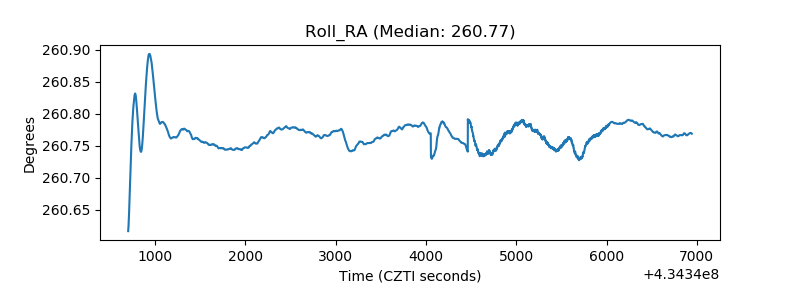 |
| Veto Counter | 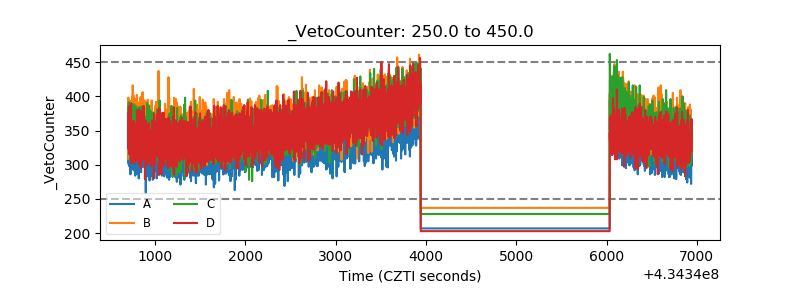 |