| Param | Original file | Final file |
|---|---|---|
| Filename | modeM0/AS1A12_018T01_9000005874_43391cztM0_level2.fits | modeM0/AS1A12_018T01_9000005874_43391cztM0_level2_quad_clean.evt |
| Size (bytes) | 316,376,640 | 88,534,080 |
| Size | 301.7 MB | 84.4 MB |
| Events in quadrant A | 3,215,464 | 588,794 |
| Events in quadrant B | 2,654,017 | 610,232 |
| Events in quadrant C | 2,565,484 | 573,239 |
| Events in quadrant D | 2,847,343 | 523,263 |
| Mode M0 | |||
|---|---|---|---|
| Quadrant | BADHDUFLAG | Total packets | Discarded packets |
| A | 0 | 12763 | 1 |
| B | 0 | 11797 | 1 |
| C | 0 | 11203 | 1 |
| D | 0 | 12650 | 1 |
| Mode M9 | |||
|---|---|---|---|
| Quadrant | BADHDUFLAG | Total packets | Discarded packets |
| A | 0 | 15 | 0 |
| B | 0 | 15 | 0 |
| C | 0 | 15 | 0 |
| D | 0 | 15 | 0 |
| Mode SS | |||
|---|---|---|---|
| Quadrant | BADHDUFLAG | Total packets | Discarded packets |
| A | 0 | 112 | 0 |
| B | 0 | 112 | 0 |
| C | 0 | 112 | 0 |
| D | 0 | 112 | 0 |
| Quadrant | Total seconds | Saturated seconds | Saturation percentage |
|---|---|---|---|
| A | 5503 | 81 | 1.471924% |
| B | 5504 | 12 | 0.218023% |
| C | 5504 | 4 | 0.072674% |
| D | 5504 | 71 | 1.289971% |
Noise dominated data is calculated using 1-second bins in cleaned event files. If a bin has >2000 counts, and if more than 50% of those come from <1% of pixels, then it is considered to be noise-dominated and hence unusable.
| Quadrant | # 1 sec bins | Bins with >0 counts | Bins with >2000 counts | High rate bins dominated by noise | Noise dominated (total time) | Noise dominated (detector-on time) | Marked lightcurve |
|---|---|---|---|---|---|---|---|
| A | 7056 | 5504 | 67 | 67 | 0.95% | 1.22% | 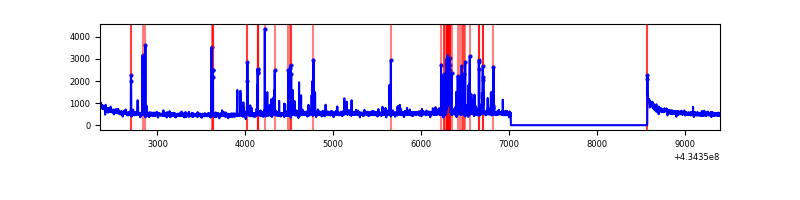 |
| B | 7057 | 5505 | 6 | 6 | 0.09% | 0.11% | 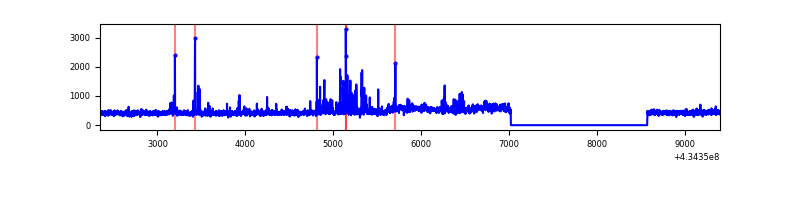 |
| C | 7057 | 5505 | 6 | 6 | 0.09% | 0.11% | 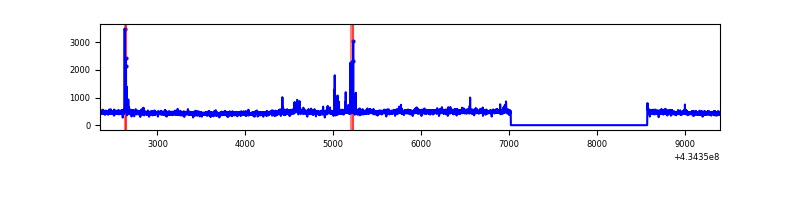 |
| D | 7057 | 5505 | 83 | 83 | 1.18% | 1.51% | 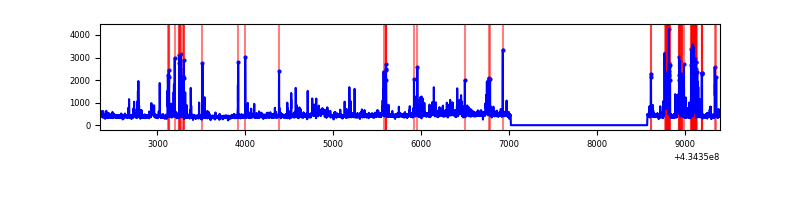 |
Top three noisy pixels from each quadrant. If the there are fewer than three noisy pixels in the level2.evt file, extra rows are filled as -1
| Pixel properties | Quadrant properties | ||||||
|---|---|---|---|---|---|---|---|
| Quadrant | DetID | PixID | Counts | Sigma | Mean | Median | Sigma |
| A | 10 | 83 | 603886 | 5043.61 | 581 | 568 | 119.6 |
| A | 15 | 237 | 263633 | 2199.17 | 581 | 568 | 119.6 |
| A | 7 | 3 | 73535 | 609.99 | 581 | 568 | 119.6 |
| B | 3 | 112 | 160068 | 1437.0 | 580 | 565 | 111.0 |
| B | 15 | 85 | 49293 | 439.0 | 580 | 565 | 111.0 |
| B | 0 | 189 | 48763 | 434.23 | 580 | 565 | 111.0 |
| C | 15 | 214 | 235162 | 1771.5 | 565 | 568 | 132.4 |
| C | 3 | 233 | 71734 | 537.4 | 565 | 568 | 132.4 |
| C | 15 | 159 | 49392 | 368.69 | 565 | 568 | 132.4 |
| D | 1 | 52 | 255428 | 1856.73 | 563 | 547 | 137.3 |
| D | 12 | 6 | 161368 | 1171.53 | 563 | 547 | 137.3 |
| D | 12 | 218 | 130198 | 944.47 | 563 | 547 | 137.3 |
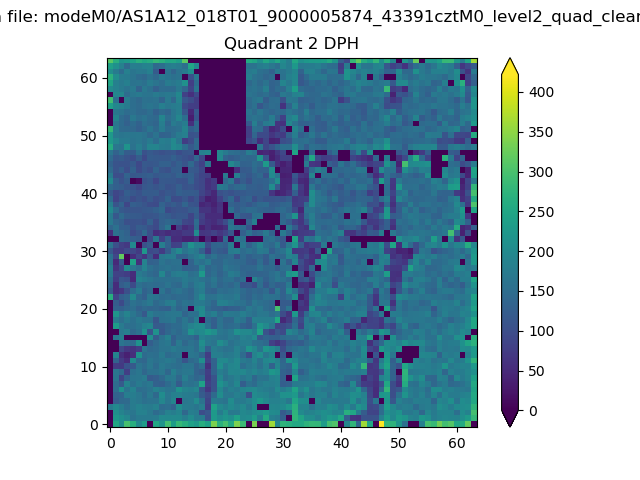
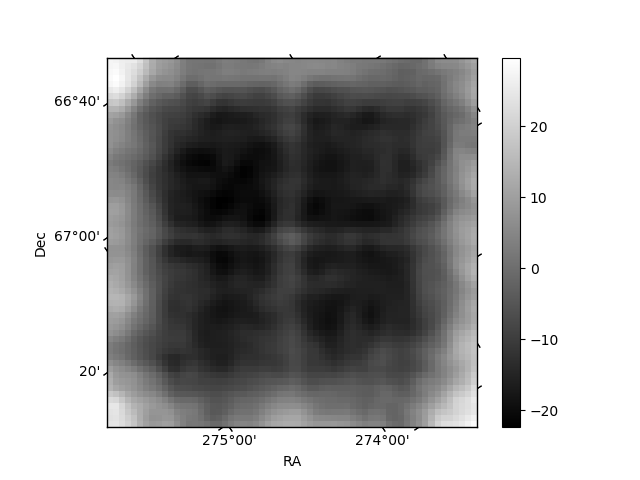
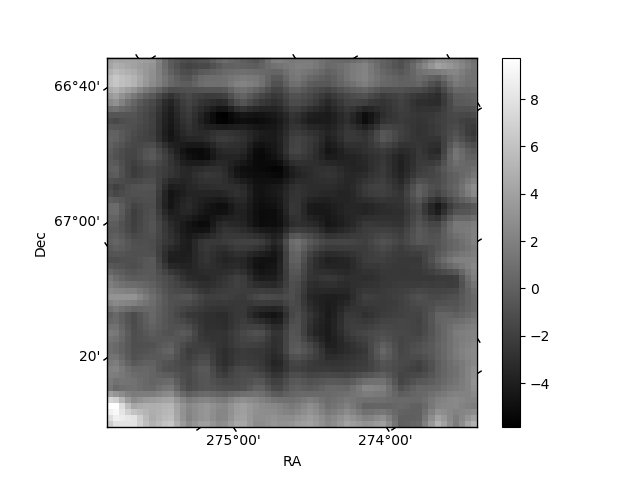
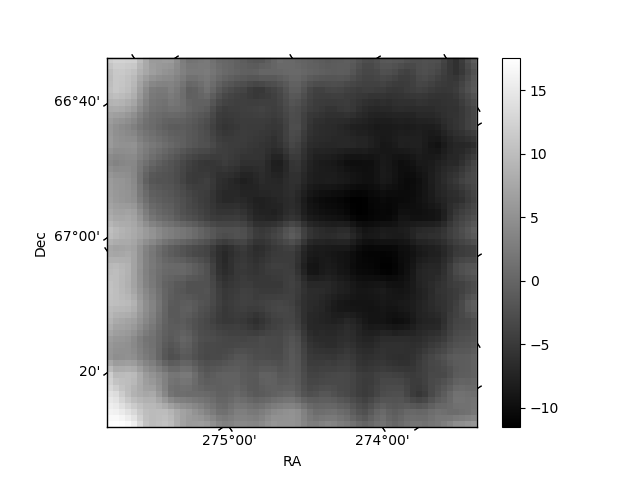
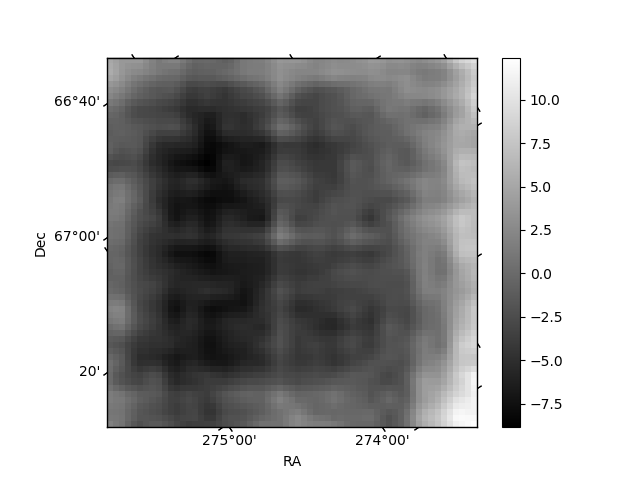
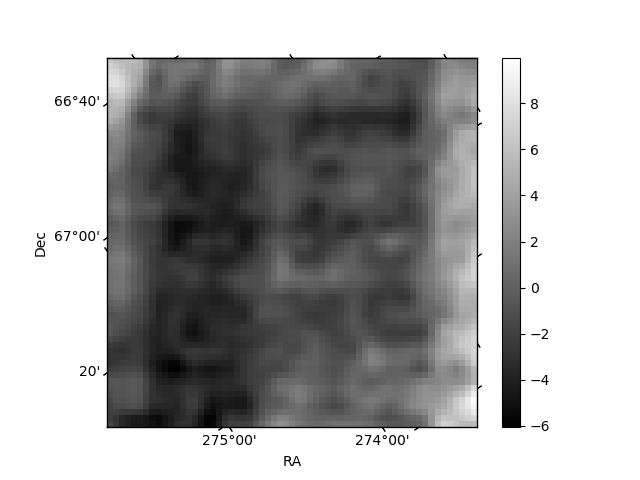
Histogram calculated using DETX and DETY for each event in the final _common_clean file
| Quadrant A | 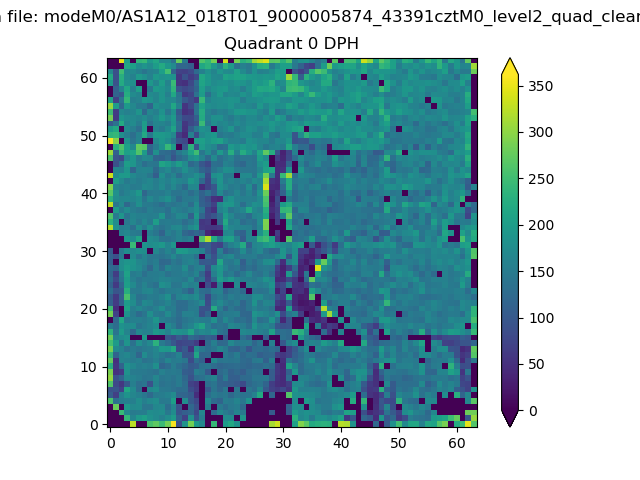 |
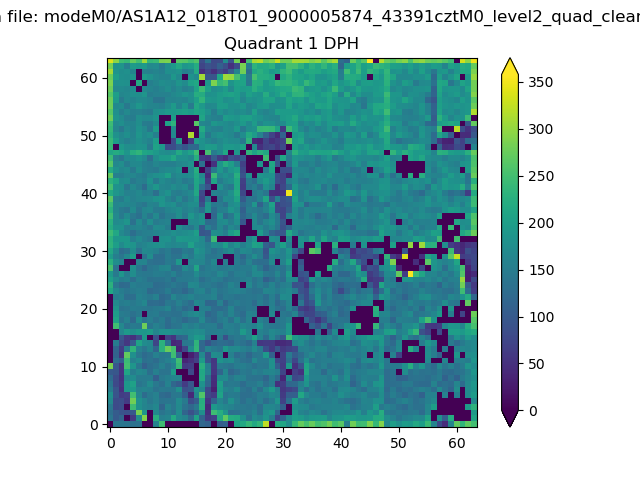 |
Quadrant B |
|---|---|---|---|
| Quadrant D | 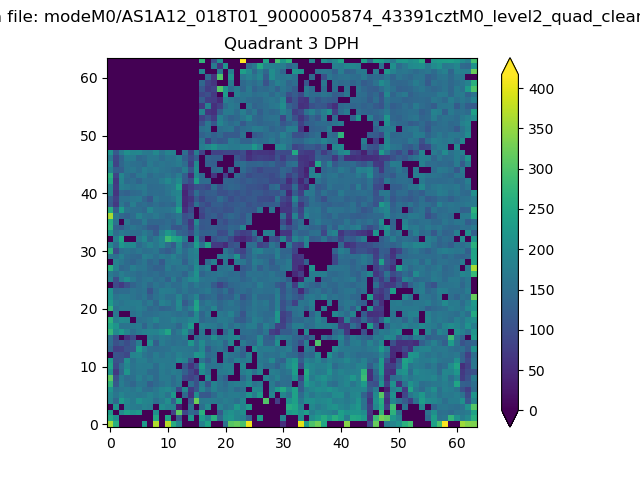 |
 |
Quadrant C |
| Plot type | Count rate plots | Images |
|---|---|---|
| Comparison with Poisson distribution Blue bars denote a histogram of data divided into 1 sec bins. Red curve is a Poisson curve with rate = median count rate of data. |
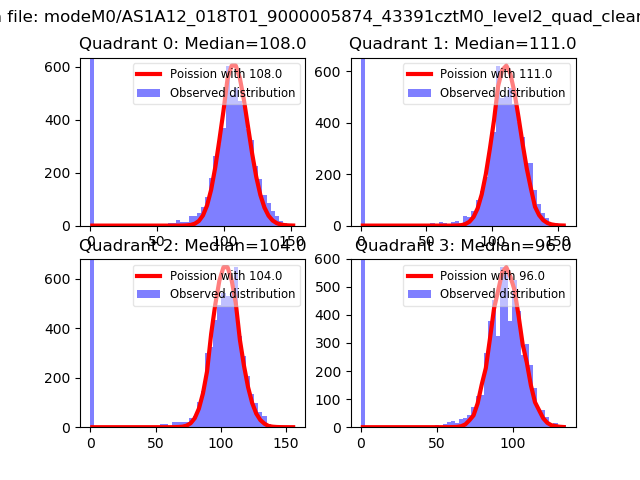 |
 |
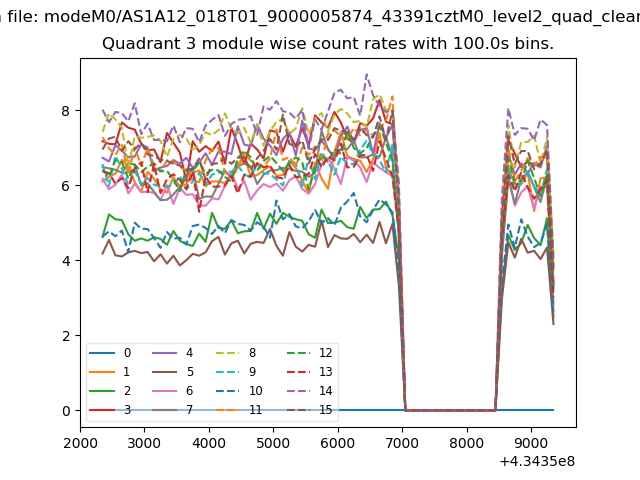
| Quadrant-wise count rates Data is divided into 100 sec bins |
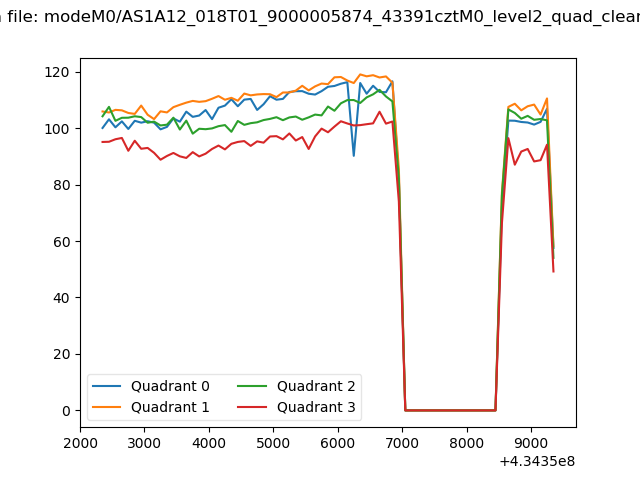 |
|
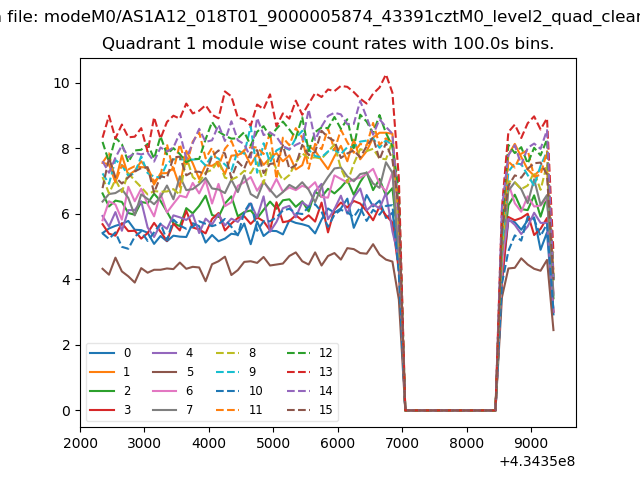
| Module-wise count rates for Quadrant A Data is divided into 100 sec bins |
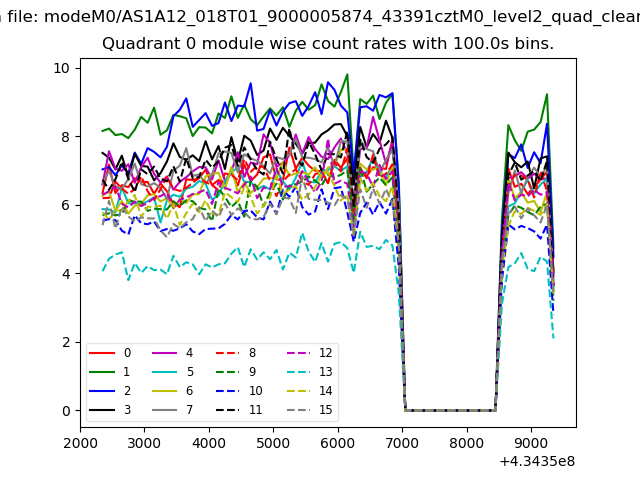 |
 |
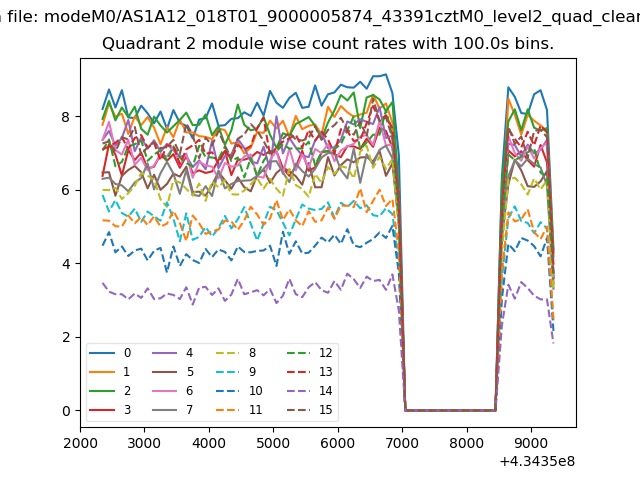
| Module-wise count rates for Quadrant B Data is divided into 100 sec bins |
 |
 |
| Module-wise count rates for Quadrant C Data is divided into 100 sec bins |
 |
 |
| Module-wise count rates for Quadrant D Data is divided into 100 sec bins |
 |
 |
| Parameter | Plot |
|---|---|
| CZT HV Monitor | 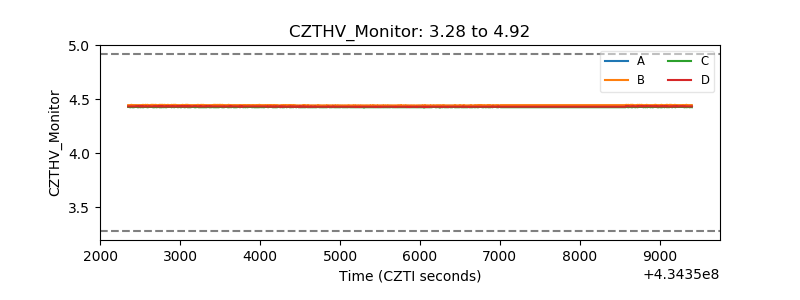 |
| D_VDD | 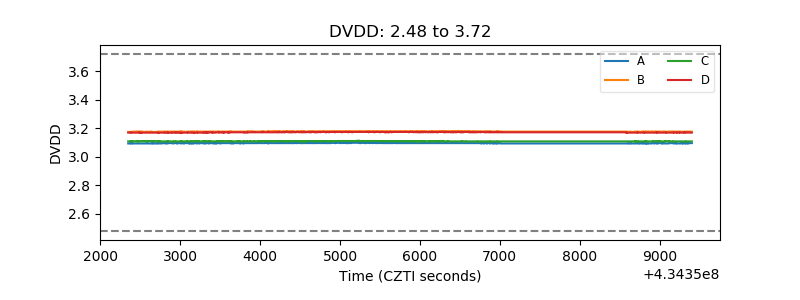 |
| Temperature 1 | 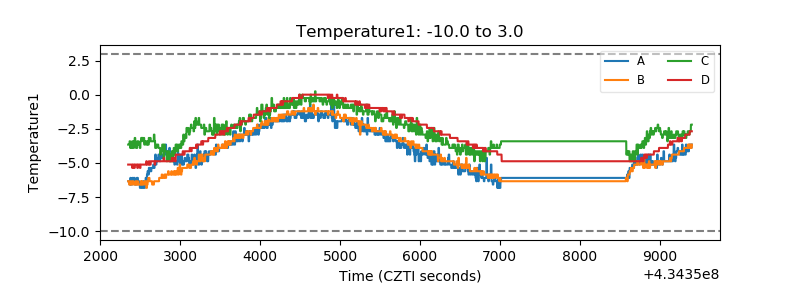 |
| Veto HV Monitor | 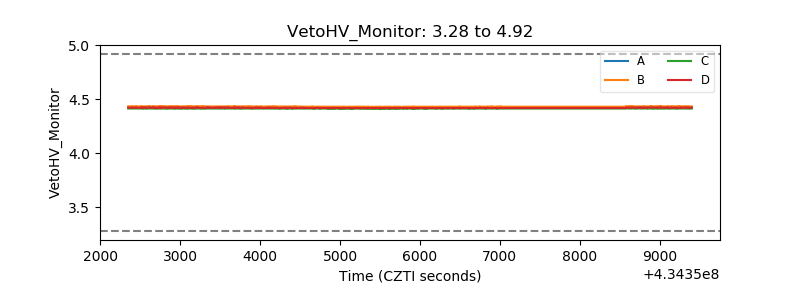 |
| Veto LLD | 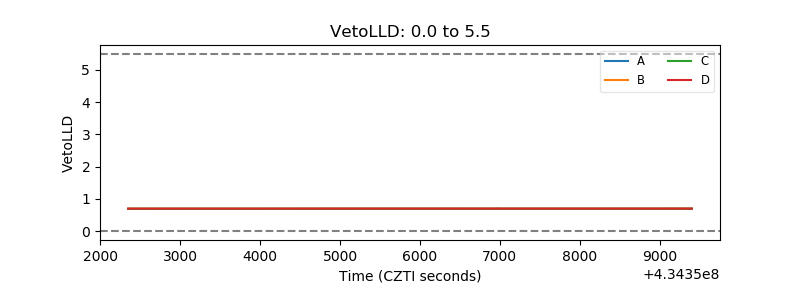 |
| Alpha Counter | 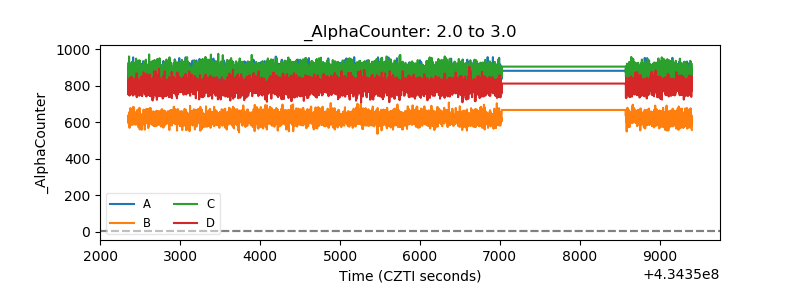 |
| _CPM_Rate | 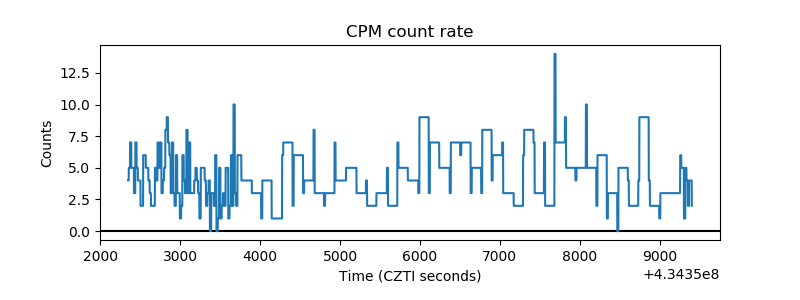 |
| CZT Counter |  |
| +2.5 Volts monitor | 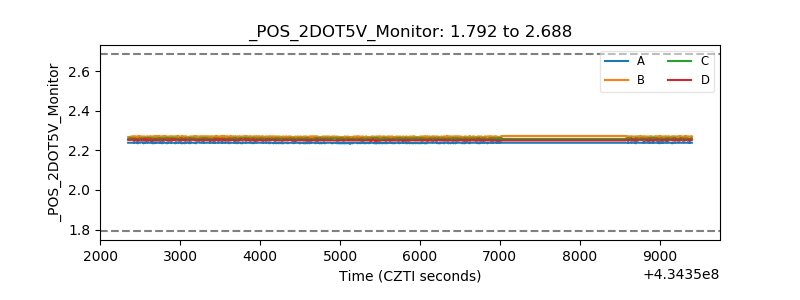 |
| +5 Volts monitor | 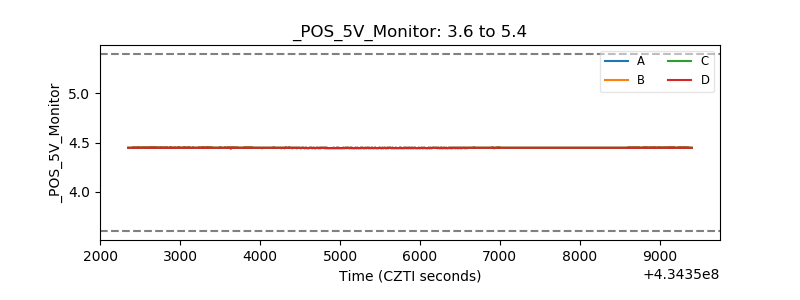 |
| _ROLL_ROT | 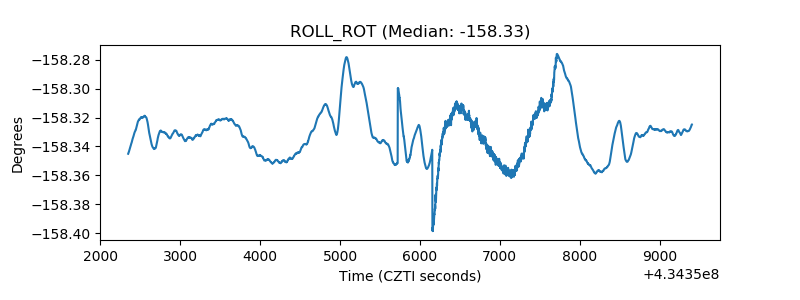 |
| _Roll_DEC | 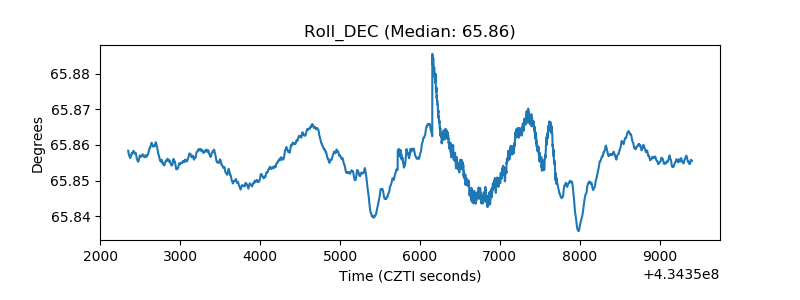 |
| _Roll_RA | 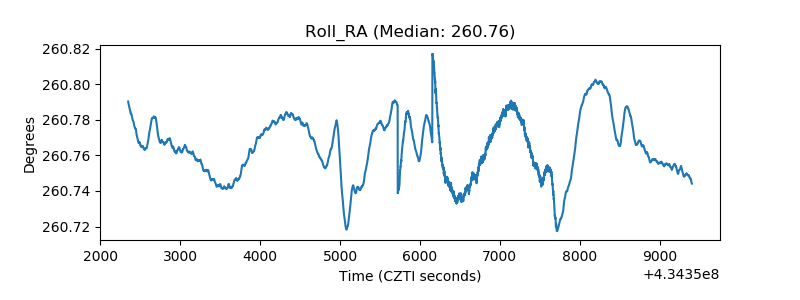 |
| Veto Counter | 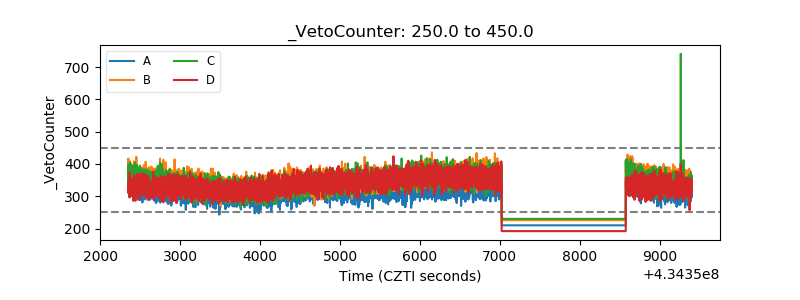 |