| Param | Original file | Final file |
|---|---|---|
| Filename | modeM0/AS1A12_018T01_9000005874_43392cztM0_level2.fits | modeM0/AS1A12_018T01_9000005874_43392cztM0_level2_quad_clean.evt |
| Size (bytes) | 340,387,200 | 93,729,600 |
| Size | 324.6 MB | 89.4 MB |
| Events in quadrant A | 3,534,889 | 627,323 |
| Events in quadrant B | 2,786,215 | 646,235 |
| Events in quadrant C | 2,782,726 | 604,658 |
| Events in quadrant D | 3,041,423 | 551,851 |
| Mode M0 | |||
|---|---|---|---|
| Quadrant | BADHDUFLAG | Total packets | Discarded packets |
| A | 0 | 13856 | 2 |
| B | 0 | 12217 | 2 |
| C | 0 | 12137 | 2 |
| D | 0 | 13444 | 2 |
| Mode M9 | |||
|---|---|---|---|
| Quadrant | BADHDUFLAG | Total packets | Discarded packets |
| A | 0 | 14 | 0 |
| B | 0 | 15 | 0 |
| C | 0 | 15 | 0 |
| D | 0 | 15 | 0 |
| Mode SS | |||
|---|---|---|---|
| Quadrant | BADHDUFLAG | Total packets | Discarded packets |
| A | 0 | 118 | 0 |
| B | 0 | 118 | 0 |
| C | 0 | 118 | 0 |
| D | 0 | 118 | 0 |
| Quadrant | Total seconds | Saturated seconds | Saturation percentage |
|---|---|---|---|
| A | 5839 | 118 | 2.020894% |
| B | 5839 | 17 | 0.291146% |
| C | 5839 | 12 | 0.205515% |
| D | 5838 | 115 | 1.969853% |
Noise dominated data is calculated using 1-second bins in cleaned event files. If a bin has >2000 counts, and if more than 50% of those come from <1% of pixels, then it is considered to be noise-dominated and hence unusable.
| Quadrant | # 1 sec bins | Bins with >0 counts | Bins with >2000 counts | High rate bins dominated by noise | Noise dominated (total time) | Noise dominated (detector-on time) | Marked lightcurve |
|---|---|---|---|---|---|---|---|
| A | 7152 | 5840 | 91 | 91 | 1.27% | 1.56% | 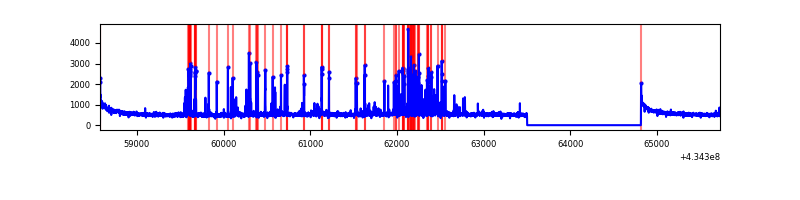 |
| B | 7152 | 5840 | 6 | 6 | 0.08% | 0.10% | 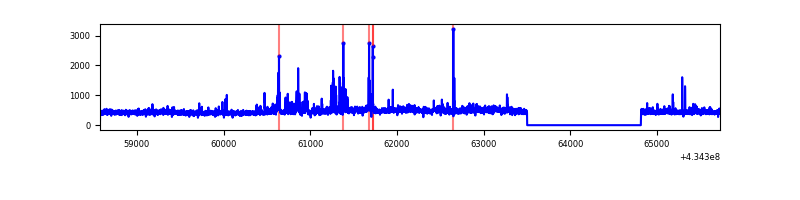 |
| C | 7152 | 5840 | 9 | 9 | 0.13% | 0.15% | 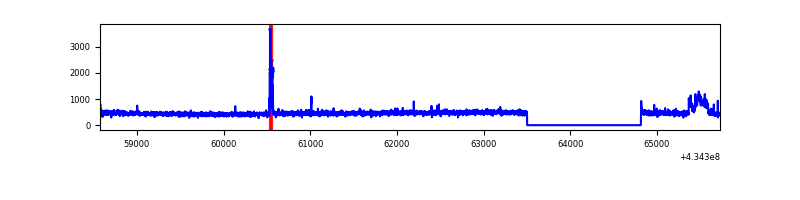 |
| D | 7151 | 5839 | 116 | 116 | 1.62% | 1.99% | 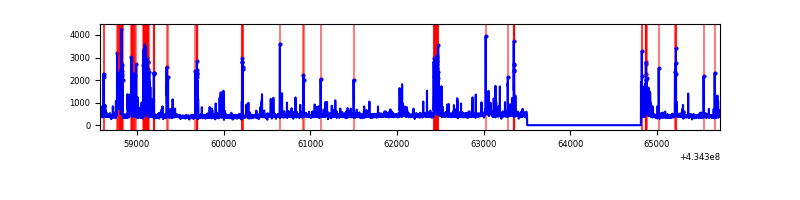 |
Top three noisy pixels from each quadrant. If the there are fewer than three noisy pixels in the level2.evt file, extra rows are filled as -1
| Pixel properties | Quadrant properties | ||||||
|---|---|---|---|---|---|---|---|
| Quadrant | DetID | PixID | Counts | Sigma | Mean | Median | Sigma |
| A | 10 | 83 | 651135 | 5125.13 | 620 | 607 | 126.9 |
| A | 15 | 237 | 432506 | 3402.68 | 620 | 607 | 126.9 |
| A | 13 | 6 | 29707 | 229.26 | 620 | 607 | 126.9 |
| B | 3 | 112 | 159861 | 1335.77 | 620 | 603 | 119.2 |
| B | 0 | 189 | 68861 | 572.51 | 620 | 603 | 119.2 |
| B | 0 | 245 | 46170 | 382.19 | 620 | 603 | 119.2 |
| C | 15 | 214 | 249037 | 1773.39 | 602 | 604 | 140.1 |
| C | 15 | 159 | 99766 | 707.85 | 602 | 604 | 140.1 |
| C | 4 | 0 | 44591 | 313.99 | 602 | 604 | 140.1 |
| D | 1 | 52 | 230041 | 1553.12 | 601 | 583 | 147.7 |
| D | 12 | 6 | 211878 | 1430.18 | 601 | 583 | 147.7 |
| D | 13 | 249 | 191607 | 1292.97 | 601 | 583 | 147.7 |
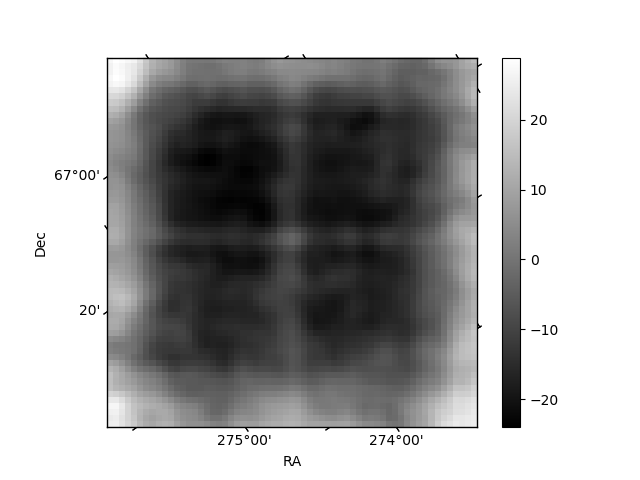
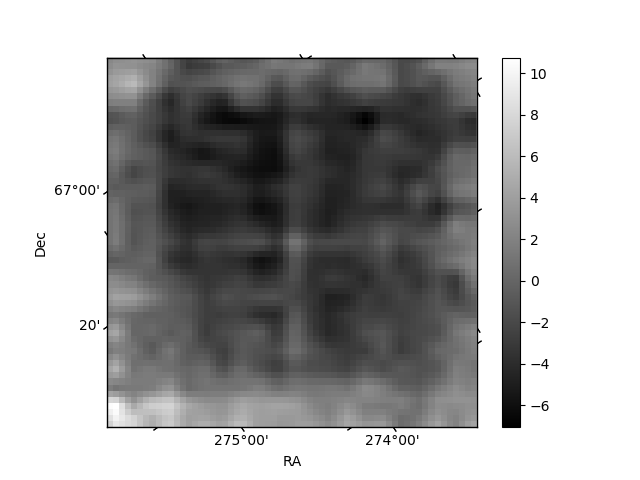
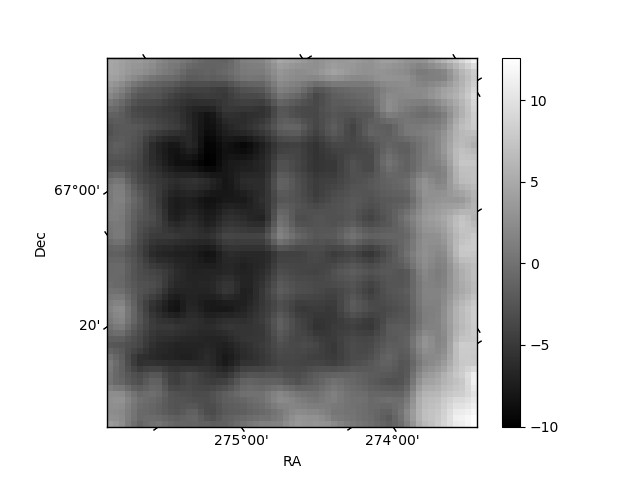
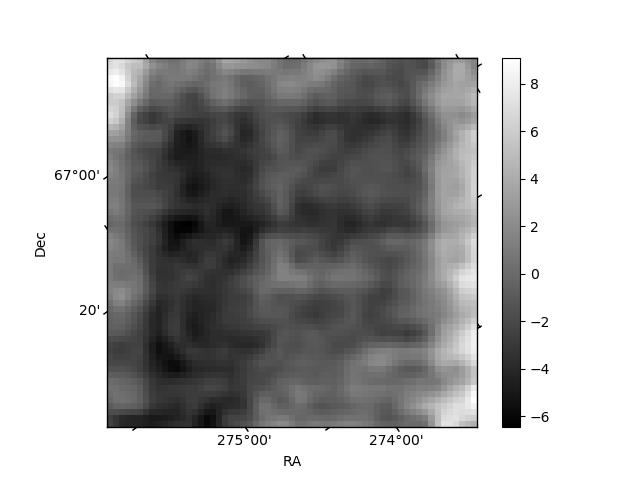
Histogram calculated using DETX and DETY for each event in the final _common_clean file
| Quadrant A | 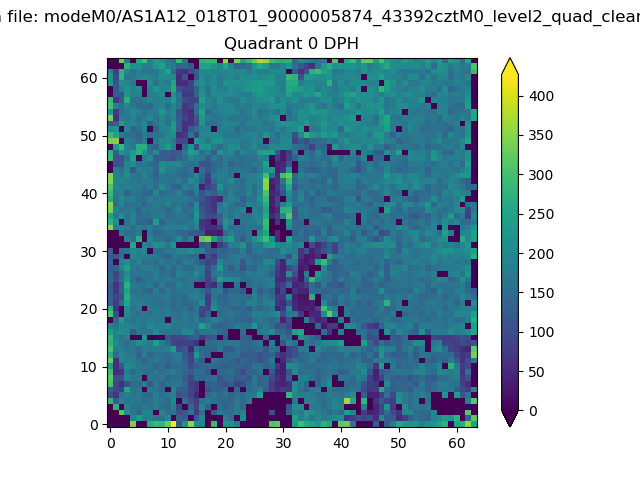 |
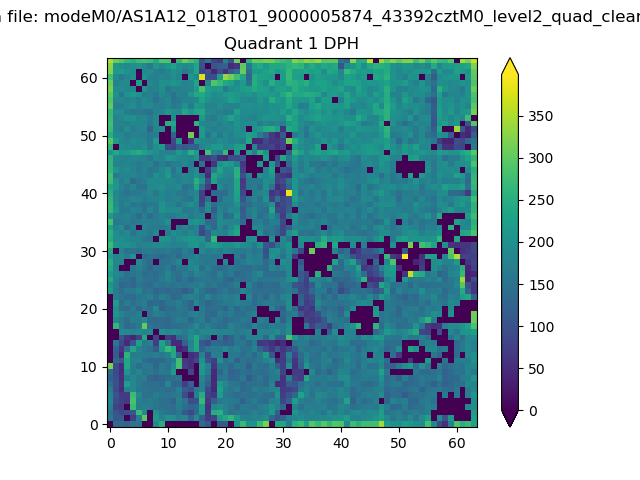 |
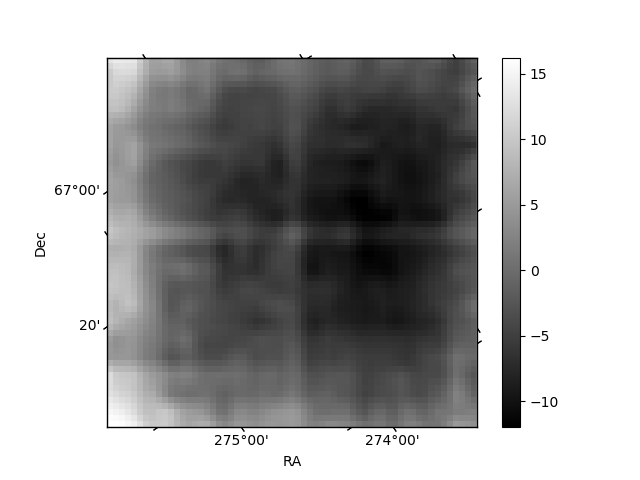
Quadrant B |
|---|---|---|---|
| Quadrant D | 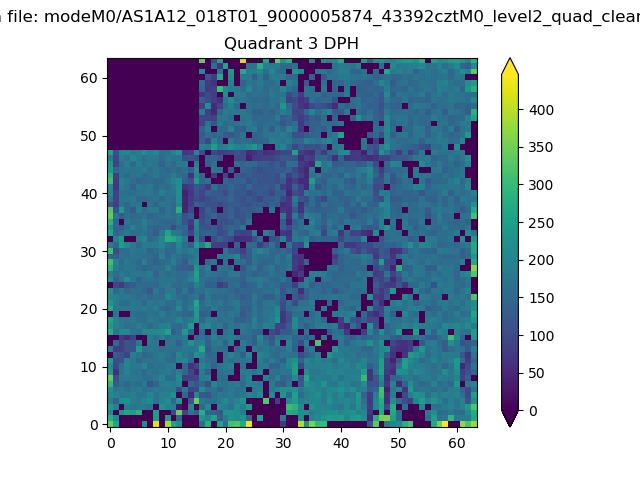 |
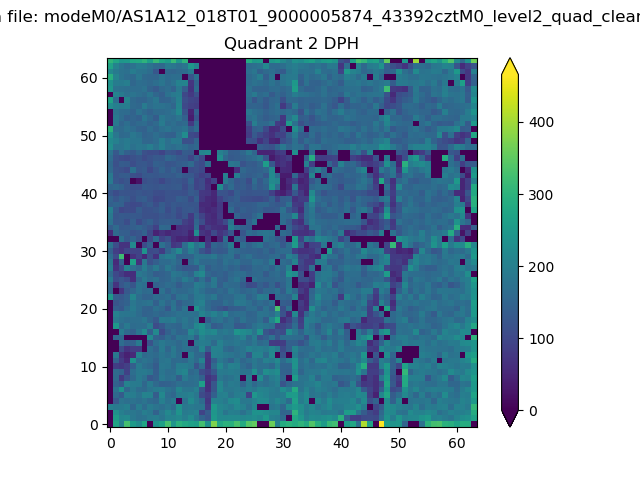 |
Quadrant C |
| Plot type | Count rate plots | Images |
|---|---|---|
| Comparison with Poisson distribution Blue bars denote a histogram of data divided into 1 sec bins. Red curve is a Poisson curve with rate = median count rate of data. |
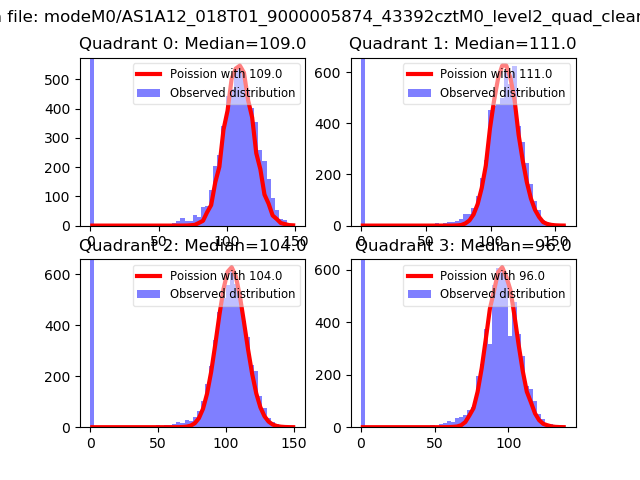 |
 |
| Quadrant-wise count rates Data is divided into 100 sec bins |
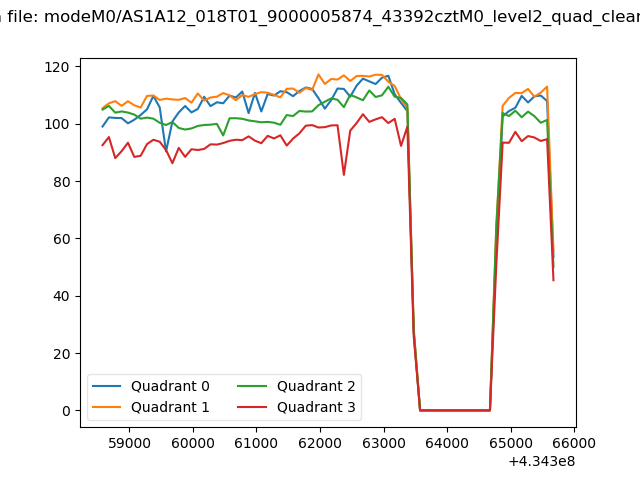 |
|
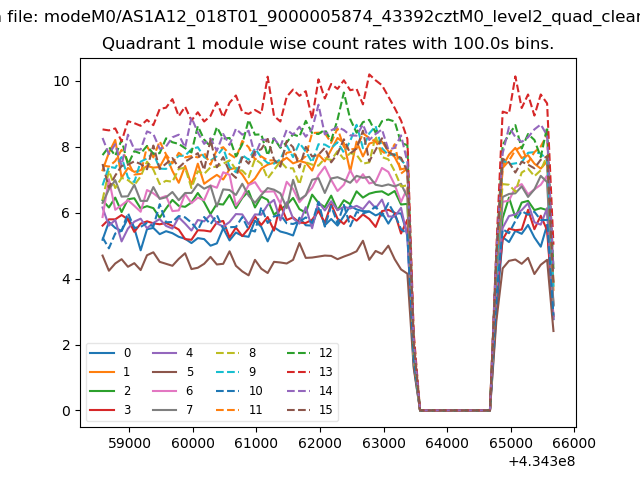
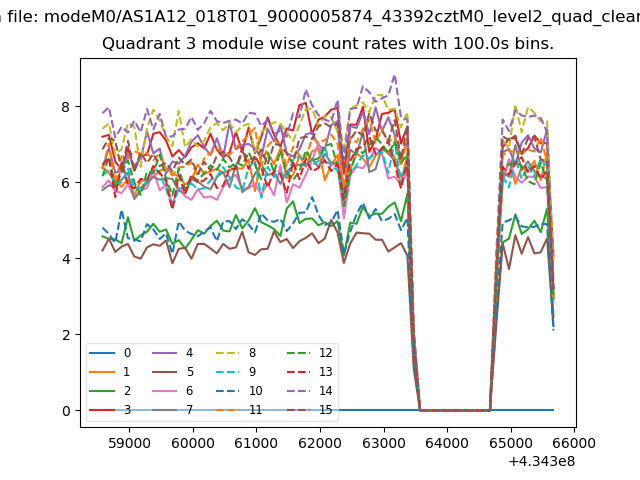
| Module-wise count rates for Quadrant A Data is divided into 100 sec bins |
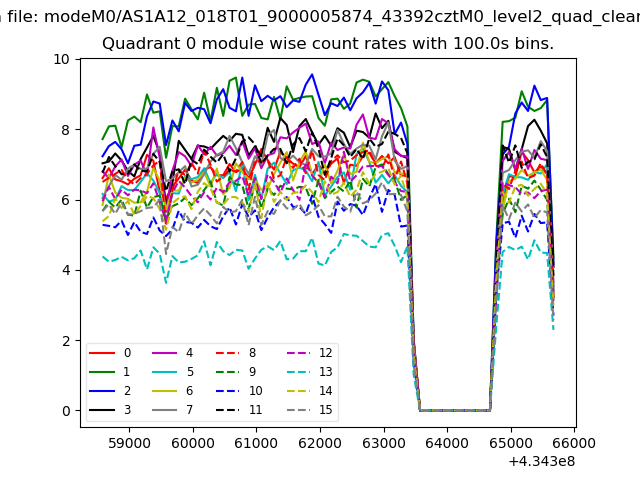 |
 |
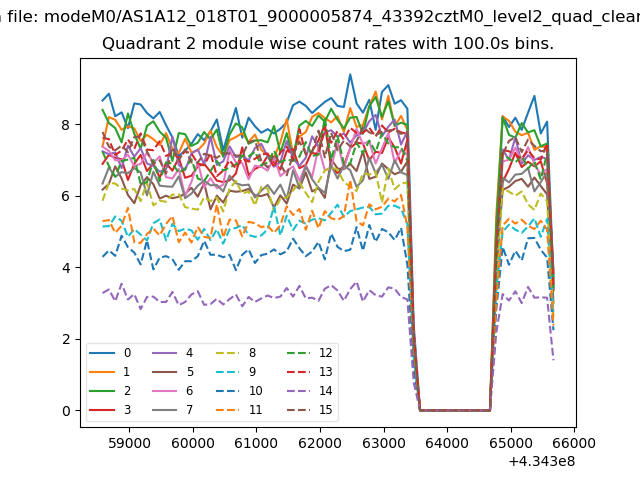
| Module-wise count rates for Quadrant B Data is divided into 100 sec bins |
 |
 |
| Module-wise count rates for Quadrant C Data is divided into 100 sec bins |
 |
 |
| Module-wise count rates for Quadrant D Data is divided into 100 sec bins |
 |
 |
| Parameter | Plot |
|---|---|
| CZT HV Monitor | 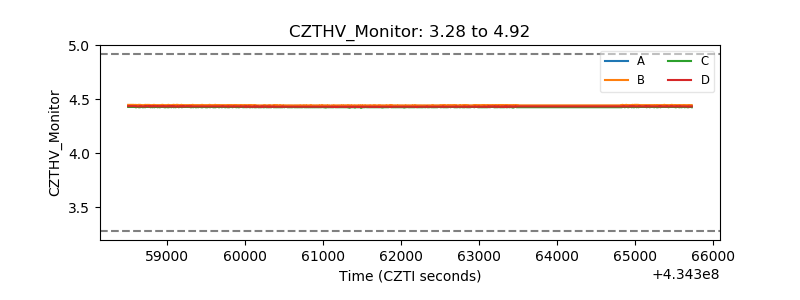 |
| D_VDD | 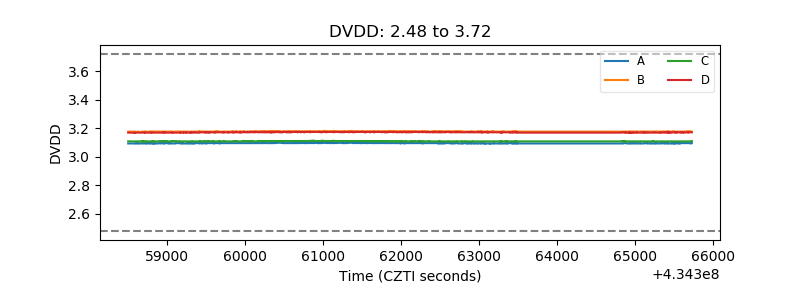 |
| Temperature 1 | 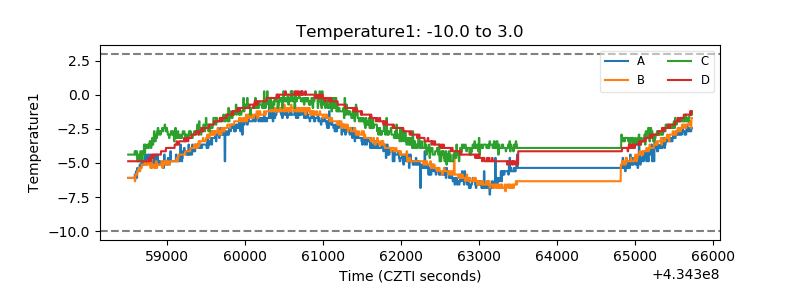 |
| Veto HV Monitor |  |
| Veto LLD |  |
| Alpha Counter | 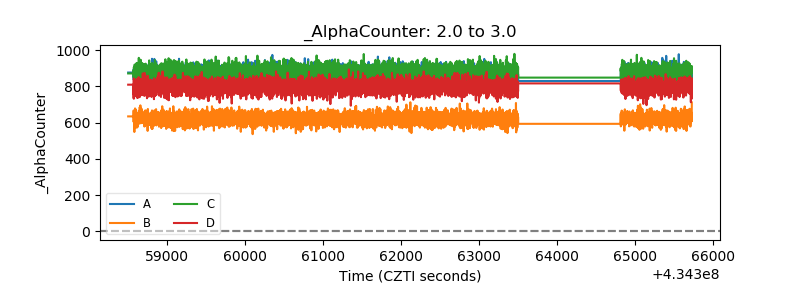 |
| _CPM_Rate | 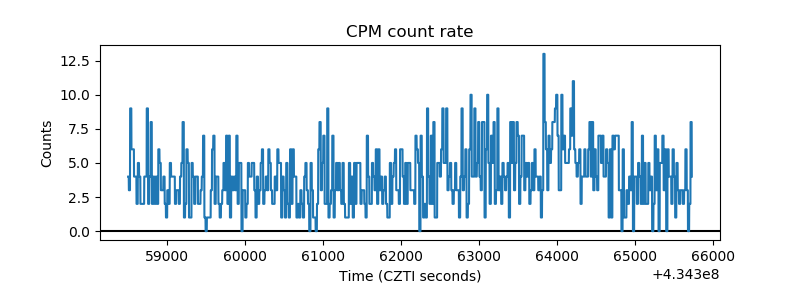 |
| CZT Counter | 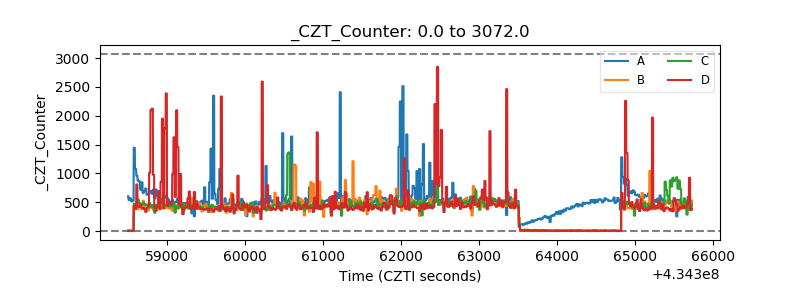 |
| +2.5 Volts monitor | 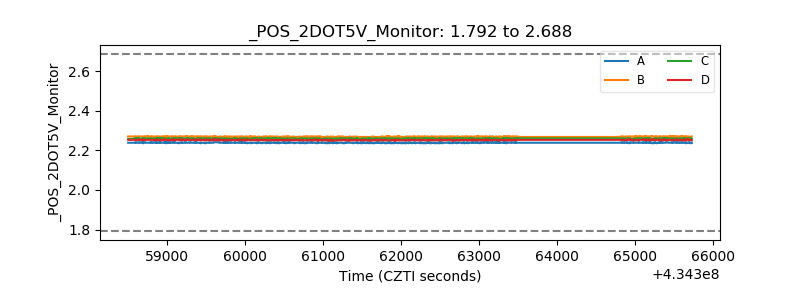 |
| +5 Volts monitor | 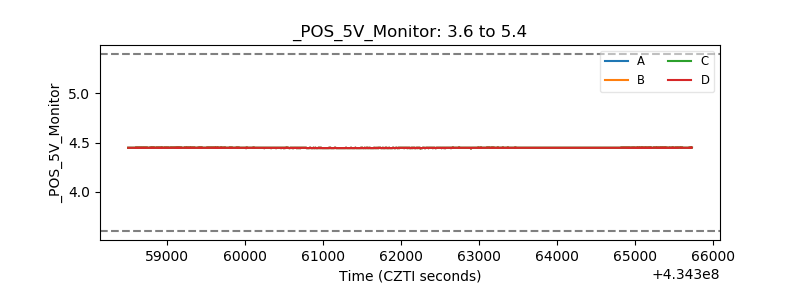 |
| _ROLL_ROT | 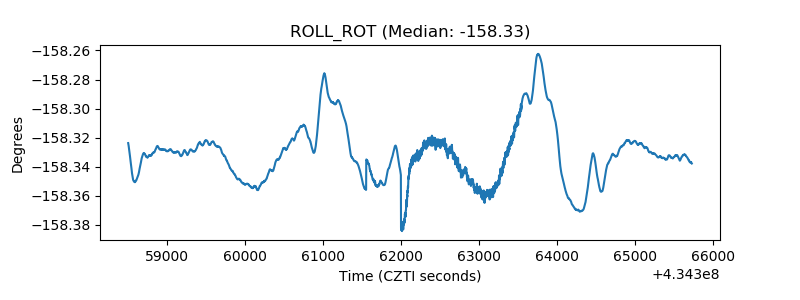 |
| _Roll_DEC | 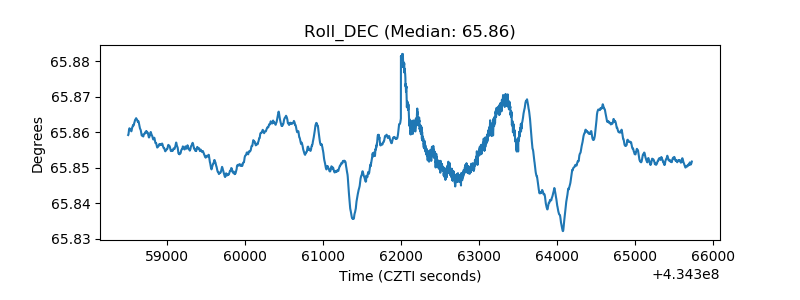 |
| _Roll_RA | 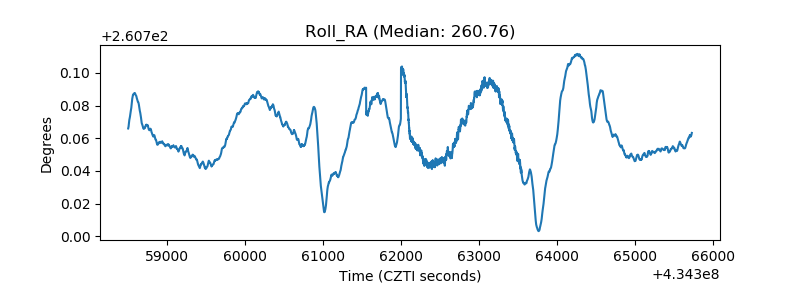 |
| Veto Counter | 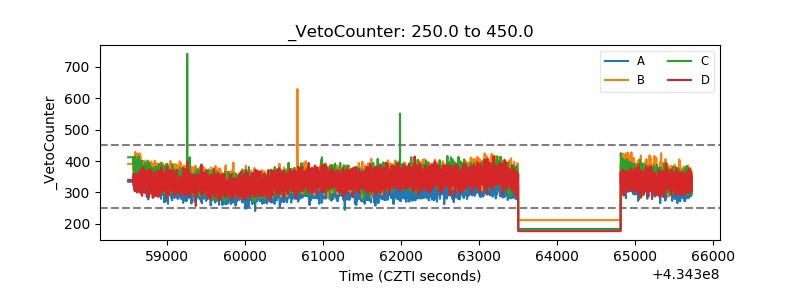 |