| Param | Original file | Final file |
|---|---|---|
| Filename | modeM0/AS1A12_018T01_9000005874_43393cztM0_level2.fits | modeM0/AS1A12_018T01_9000005874_43393cztM0_level2_quad_clean.evt |
| Size (bytes) | 353,949,120 | 96,508,800 |
| Size | 337.6 MB | 92.0 MB |
| Events in quadrant A | 3,655,063 | 648,364 |
| Events in quadrant B | 2,876,273 | 665,802 |
| Events in quadrant C | 2,957,468 | 619,602 |
| Events in quadrant D | 3,144,484 | 568,006 |
| Mode M0 | |||
|---|---|---|---|
| Quadrant | BADHDUFLAG | Total packets | Discarded packets |
| A | 0 | 14315 | 2 |
| B | 0 | 12708 | 2 |
| C | 0 | 12631 | 2 |
| D | 0 | 13856 | 2 |
| Mode M9 | |||
|---|---|---|---|
| Quadrant | BADHDUFLAG | Total packets | Discarded packets |
| A | 0 | 17 | 0 |
| B | 0 | 18 | 0 |
| C | 0 | 18 | 0 |
| D | 0 | 18 | 0 |
| Mode SS | |||
|---|---|---|---|
| Quadrant | BADHDUFLAG | Total packets | Discarded packets |
| A | 0 | 122 | 0 |
| B | 0 | 122 | 0 |
| C | 0 | 122 | 0 |
| D | 0 | 122 | 0 |
| Quadrant | Total seconds | Saturated seconds | Saturation percentage |
|---|---|---|---|
| A | 6018 | 123 | 2.043868% |
| B | 6018 | 38 | 0.631439% |
| C | 6018 | 11 | 0.182785% |
| D | 6018 | 103 | 1.711532% |
Noise dominated data is calculated using 1-second bins in cleaned event files. If a bin has >2000 counts, and if more than 50% of those come from <1% of pixels, then it is considered to be noise-dominated and hence unusable.
| Quadrant | # 1 sec bins | Bins with >0 counts | Bins with >2000 counts | High rate bins dominated by noise | Noise dominated (total time) | Noise dominated (detector-on time) | Marked lightcurve |
|---|---|---|---|---|---|---|---|
| A | 7301 | 6019 | 96 | 96 | 1.31% | 1.59% | 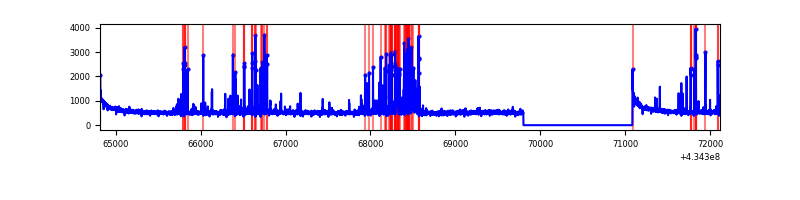 |
| B | 7301 | 6019 | 21 | 21 | 0.29% | 0.35% | 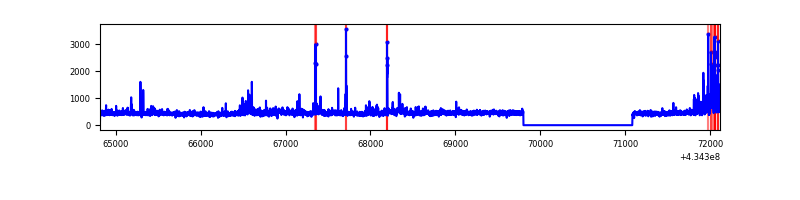 |
| C | 7301 | 6019 | 4 | 4 | 0.05% | 0.07% | 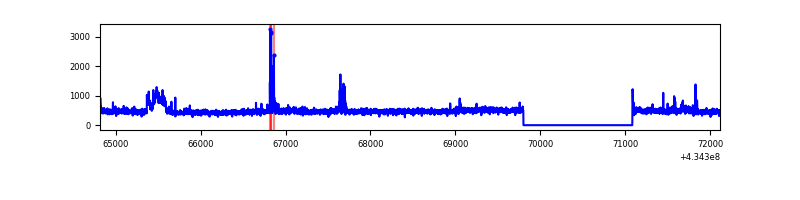 |
| D | 7301 | 6019 | 96 | 96 | 1.31% | 1.59% | 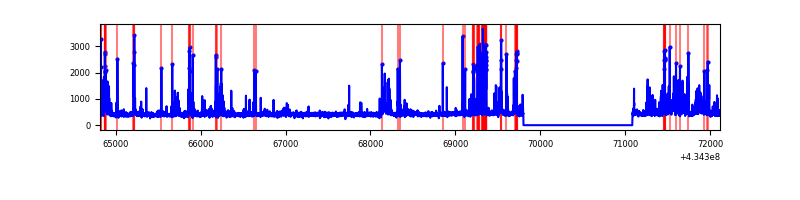 |
Top three noisy pixels from each quadrant. If the there are fewer than three noisy pixels in the level2.evt file, extra rows are filled as -1
| Pixel properties | Quadrant properties | ||||||
|---|---|---|---|---|---|---|---|
| Quadrant | DetID | PixID | Counts | Sigma | Mean | Median | Sigma |
| A | 10 | 83 | 671278 | 5024.5 | 643 | 627 | 133.5 |
| A | 15 | 237 | 338125 | 2528.53 | 643 | 627 | 133.5 |
| A | 13 | 248 | 109509 | 815.74 | 643 | 627 | 133.5 |
| B | 0 | 189 | 175701 | 1416.6 | 641 | 623 | 123.6 |
| B | 5 | 255 | 96542 | 776.11 | 641 | 623 | 123.6 |
| B | 0 | 245 | 32555 | 258.37 | 641 | 623 | 123.6 |
| C | 15 | 214 | 254290 | 1745.25 | 623 | 626 | 145.3 |
| C | 15 | 159 | 164955 | 1130.61 | 623 | 626 | 145.3 |
| C | 3 | 233 | 89863 | 613.97 | 623 | 626 | 145.3 |
| D | 13 | 249 | 225684 | 1487.97 | 622 | 602 | 151.3 |
| D | 12 | 218 | 210922 | 1390.38 | 622 | 602 | 151.3 |
| D | 12 | 6 | 177629 | 1170.29 | 622 | 602 | 151.3 |
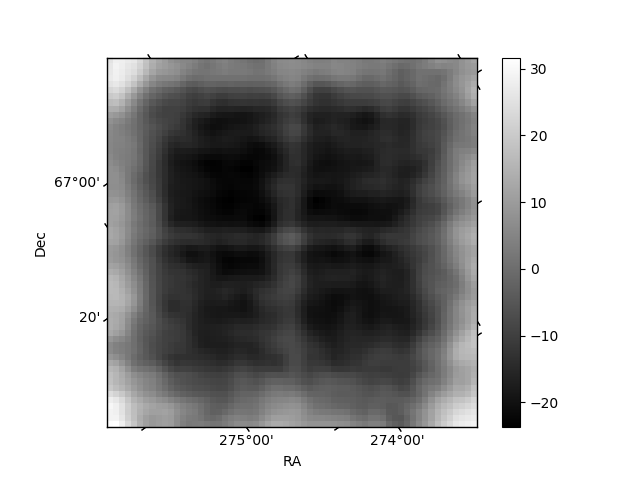
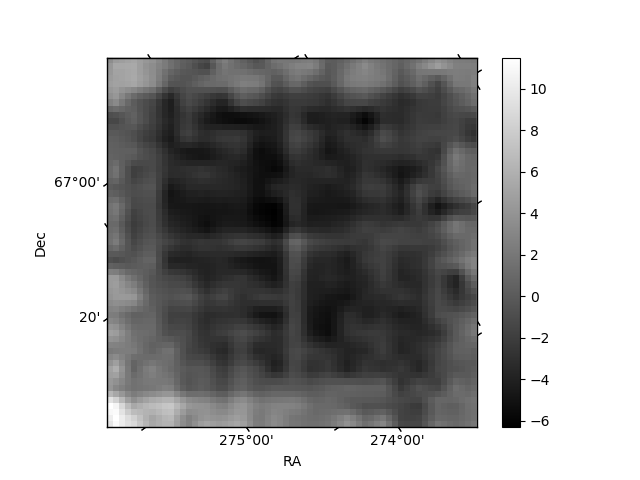
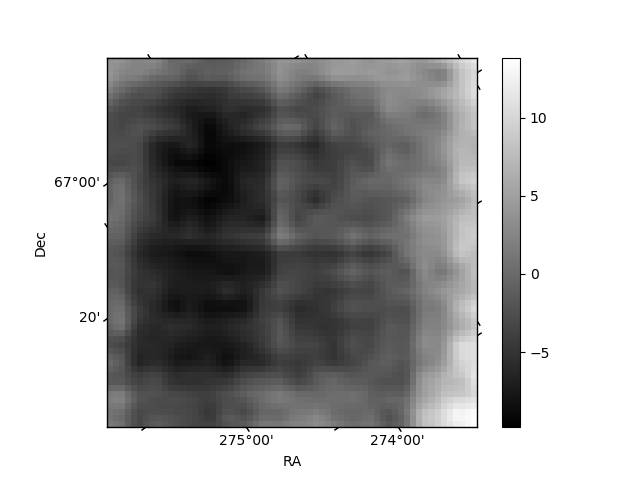
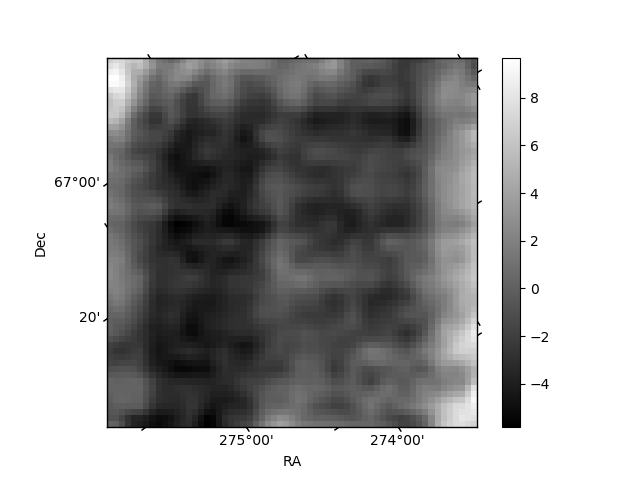
Histogram calculated using DETX and DETY for each event in the final _common_clean file
| Quadrant A | 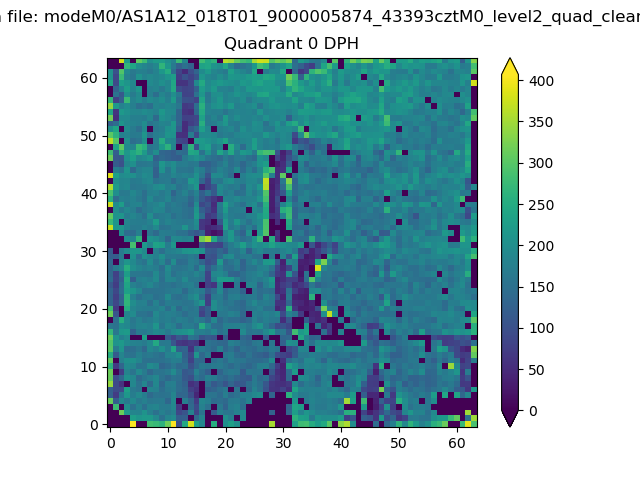 |
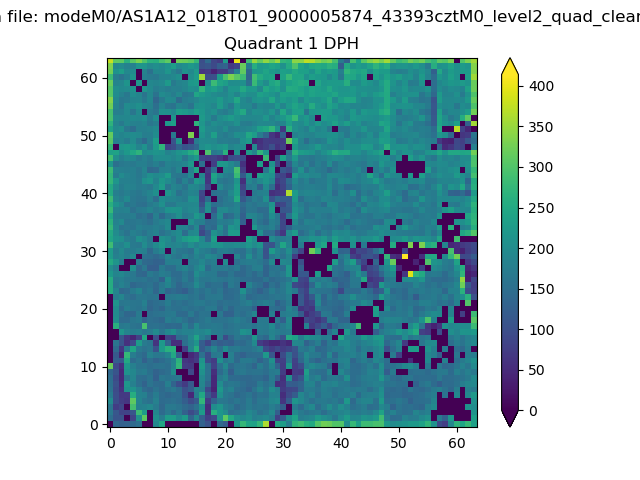 |
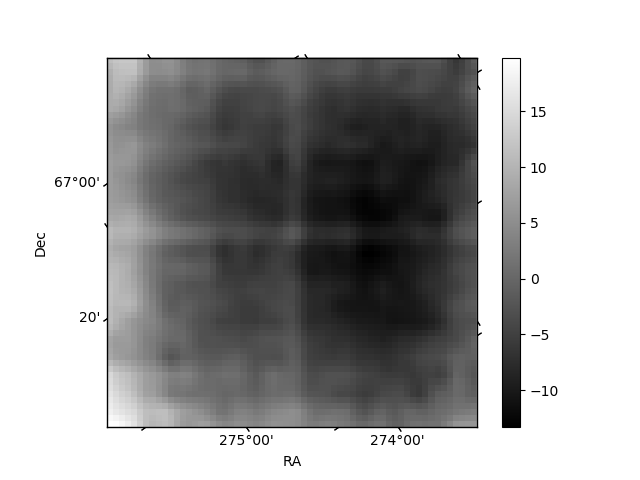
Quadrant B |
|---|---|---|---|
| Quadrant D | 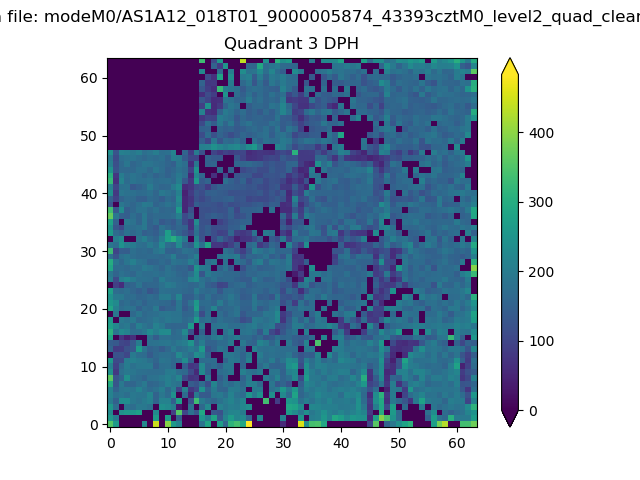 |
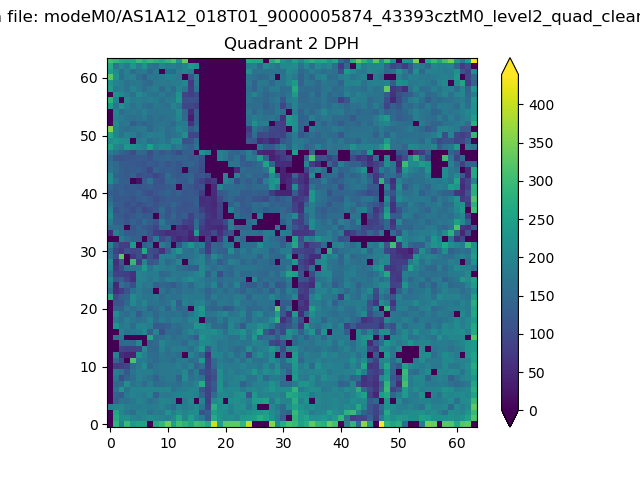 |
Quadrant C |
| Plot type | Count rate plots | Images |
|---|---|---|
| Comparison with Poisson distribution Blue bars denote a histogram of data divided into 1 sec bins. Red curve is a Poisson curve with rate = median count rate of data. |
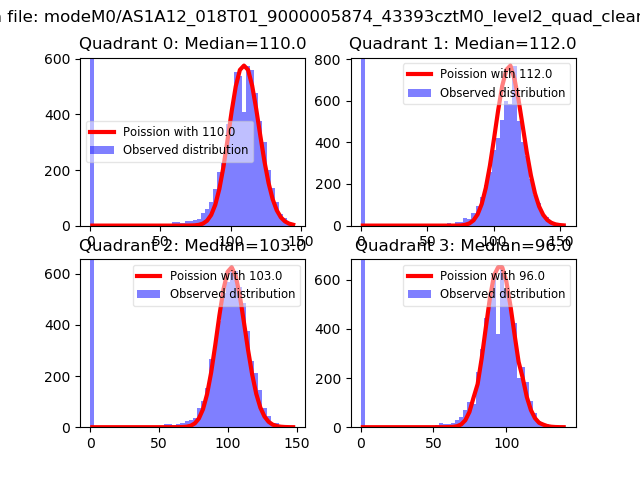 |
 |
| Quadrant-wise count rates Data is divided into 100 sec bins |
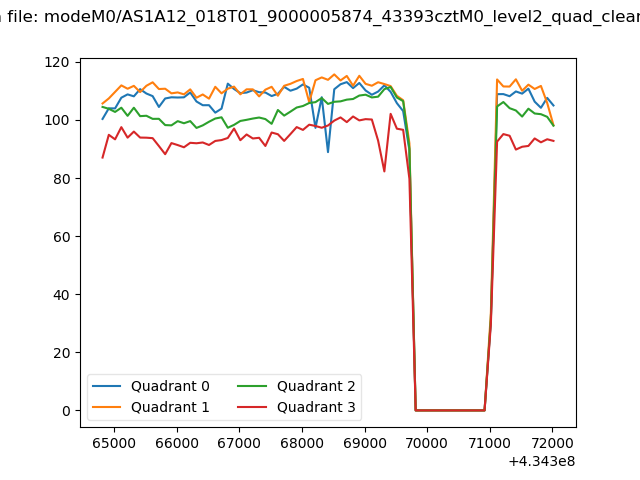 |
|
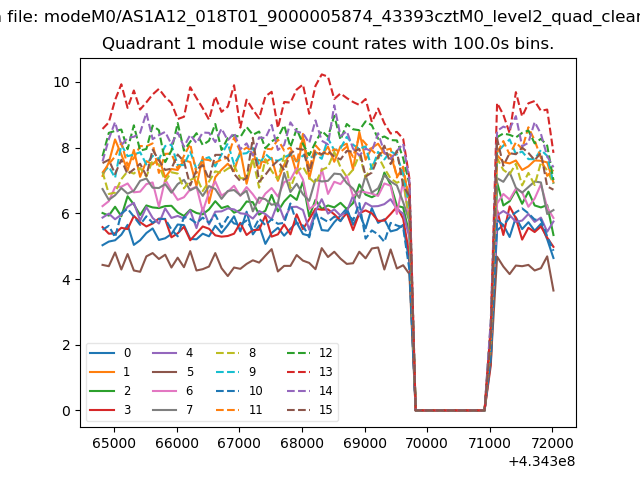
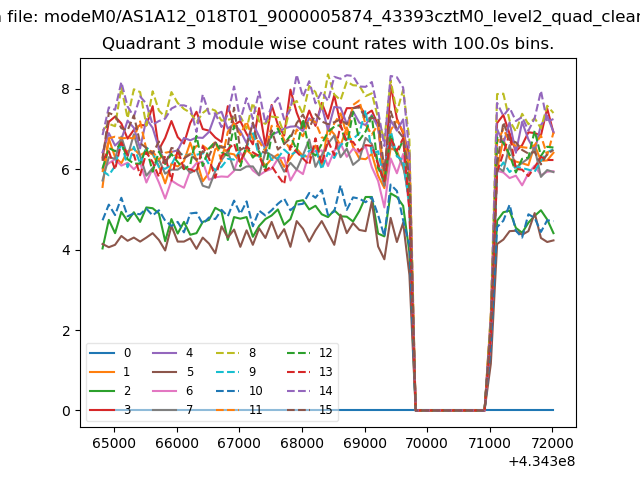
| Module-wise count rates for Quadrant A Data is divided into 100 sec bins |
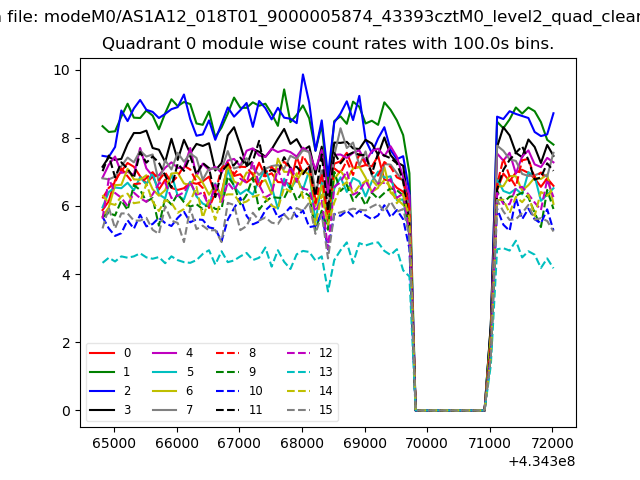 |
 |
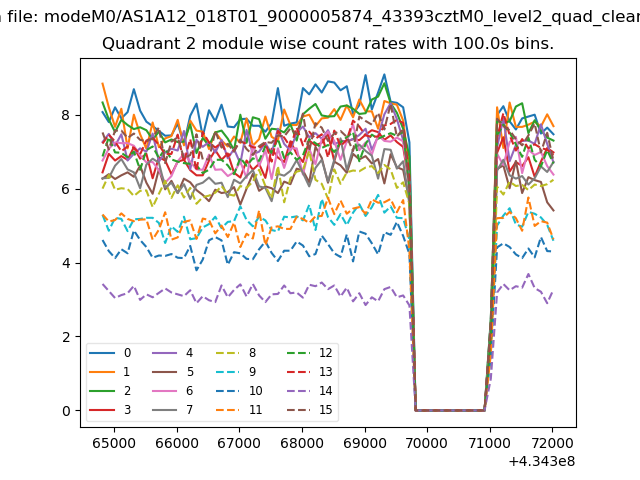
| Module-wise count rates for Quadrant B Data is divided into 100 sec bins |
 |
 |
| Module-wise count rates for Quadrant C Data is divided into 100 sec bins |
 |
 |
| Module-wise count rates for Quadrant D Data is divided into 100 sec bins |
 |
 |
| Parameter | Plot |
|---|---|
| CZT HV Monitor |  |
| D_VDD | 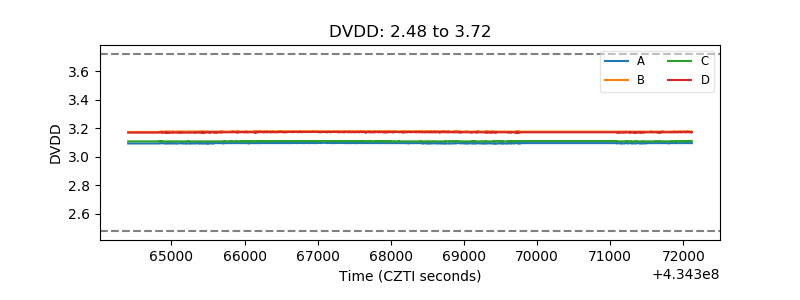 |
| Temperature 1 | 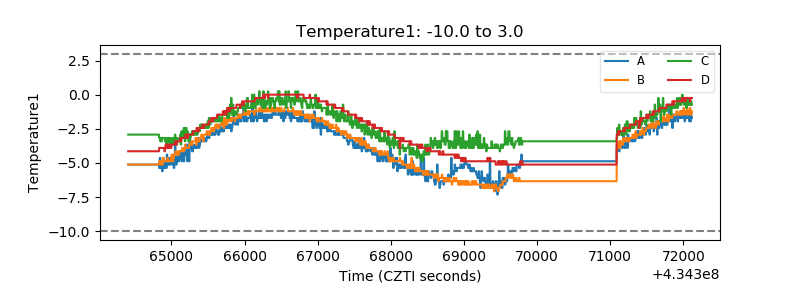 |
| Veto HV Monitor | 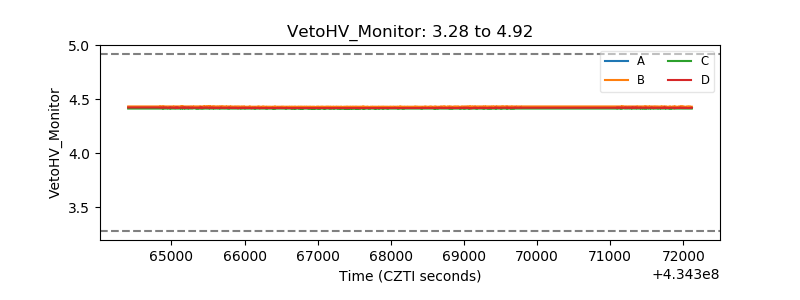 |
| Veto LLD | 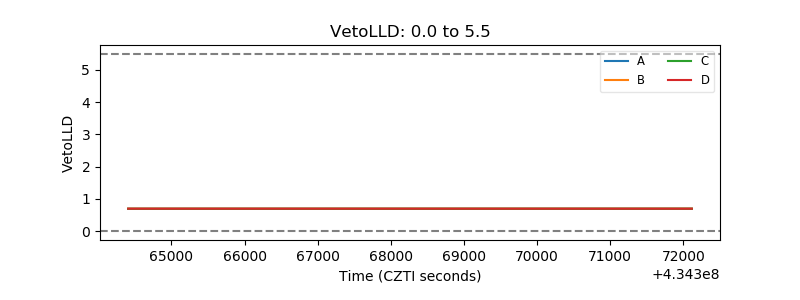 |
| Alpha Counter | 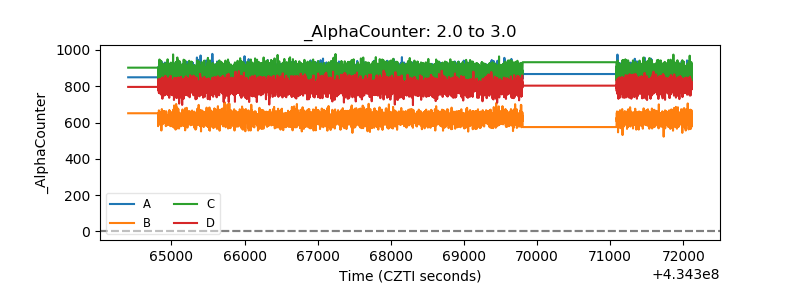 |
| _CPM_Rate | 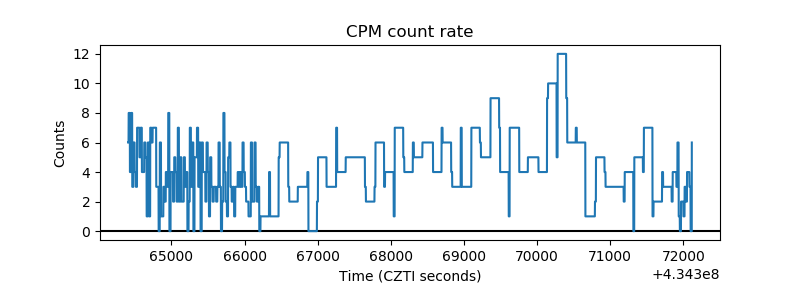 |
| CZT Counter | 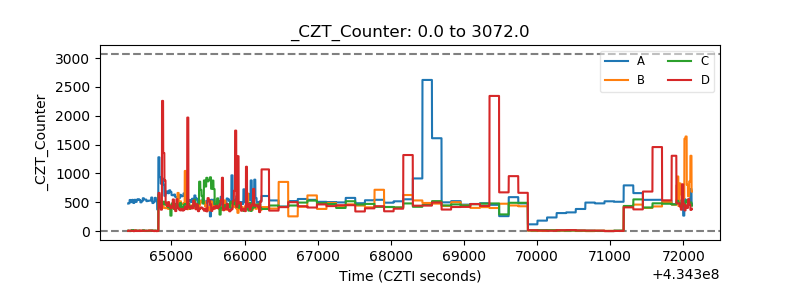 |
| +2.5 Volts monitor | 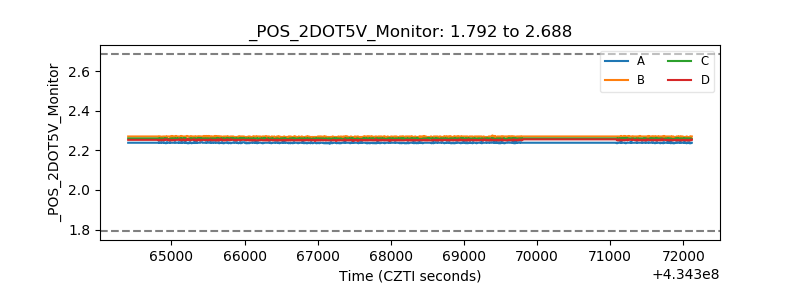 |
| +5 Volts monitor | 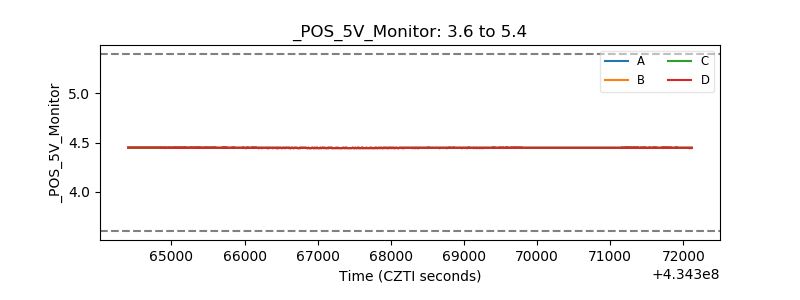 |
| _ROLL_ROT | 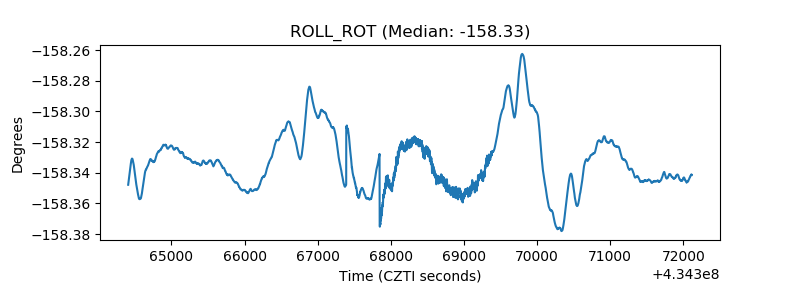 |
| _Roll_DEC | 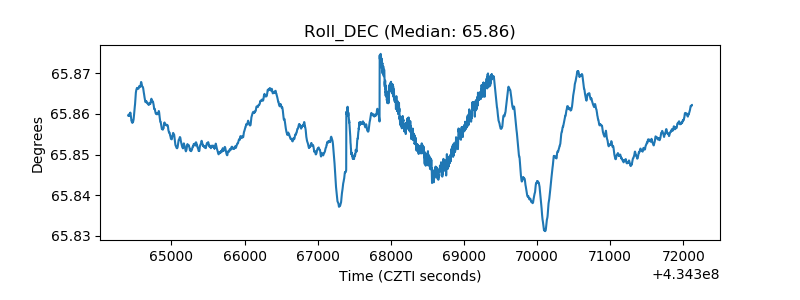 |
| _Roll_RA | 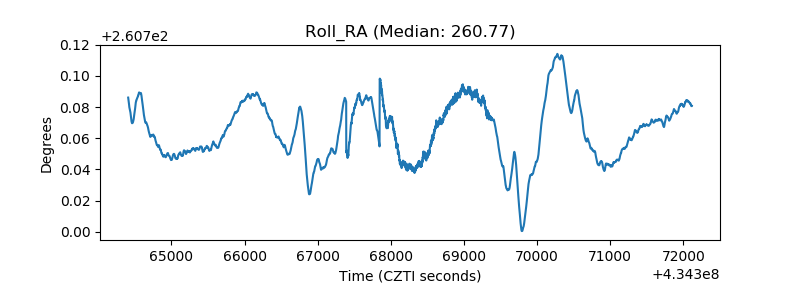 |
| Veto Counter | 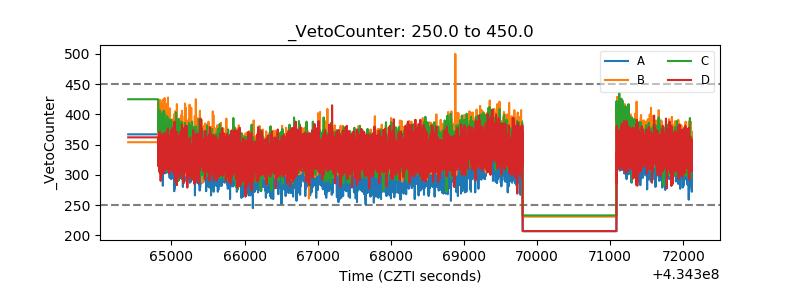 |