| Param | Original file | Final file |
|---|---|---|
| Filename | modeM0/AS1A12_018T01_9000005874_43395cztM0_level2.fits | modeM0/AS1A12_018T01_9000005874_43395cztM0_level2_quad_clean.evt |
| Size (bytes) | 507,381,120 | 141,399,360 |
| Size | 483.9 MB | 134.8 MB |
| Events in quadrant A | 5,039,534 | 946,803 |
| Events in quadrant B | 4,521,842 | 968,082 |
| Events in quadrant C | 4,309,431 | 910,149 |
| Events in quadrant D | 4,220,735 | 839,565 |
| Mode M0 | |||
|---|---|---|---|
| Quadrant | BADHDUFLAG | Total packets | Discarded packets |
| A | 0 | 20106 | 1 |
| B | 0 | 19729 | 1 |
| C | 0 | 18499 | 1 |
| D | 0 | 19319 | 1 |
| Mode M9 | |||
|---|---|---|---|
| Quadrant | BADHDUFLAG | Total packets | Discarded packets |
| A | 0 | 13 | 0 |
| B | 0 | 13 | 0 |
| C | 0 | 13 | 0 |
| D | 0 | 13 | 0 |
| Mode SS | |||
|---|---|---|---|
| Quadrant | BADHDUFLAG | Total packets | Discarded packets |
| A | 0 | 180 | 0 |
| B | 0 | 180 | 0 |
| C | 0 | 180 | 0 |
| D | 0 | 180 | 0 |
| Quadrant | Total seconds | Saturated seconds | Saturation percentage |
|---|---|---|---|
| A | 8879 | 153 | 1.723167% |
| B | 8880 | 97 | 1.092342% |
| C | 8880 | 14 | 0.157658% |
| D | 8880 | 71 | 0.799550% |
Noise dominated data is calculated using 1-second bins in cleaned event files. If a bin has >2000 counts, and if more than 50% of those come from <1% of pixels, then it is considered to be noise-dominated and hence unusable.
| Quadrant | # 1 sec bins | Bins with >0 counts | Bins with >2000 counts | High rate bins dominated by noise | Noise dominated (total time) | Noise dominated (detector-on time) | Marked lightcurve |
|---|---|---|---|---|---|---|---|
| A | 10222 | 8880 | 114 | 114 | 1.12% | 1.28% | 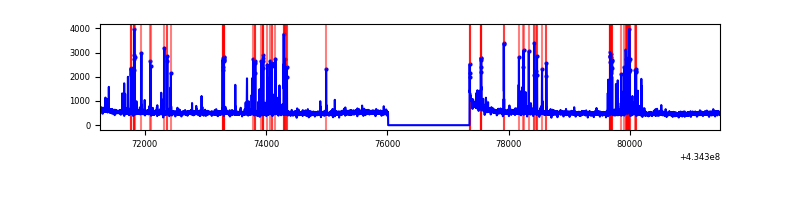 |
| B | 10223 | 8881 | 76 | 76 | 0.74% | 0.86% | 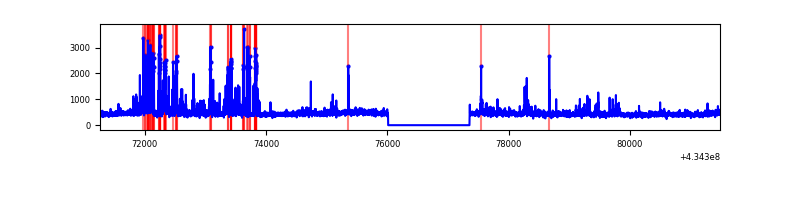 |
| C | 10223 | 8881 | 10 | 10 | 0.10% | 0.11% | 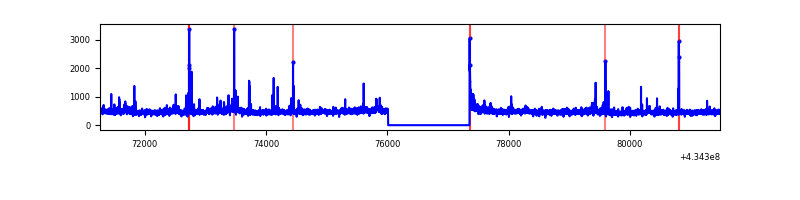 |
| D | 10223 | 8881 | 63 | 63 | 0.62% | 0.71% | 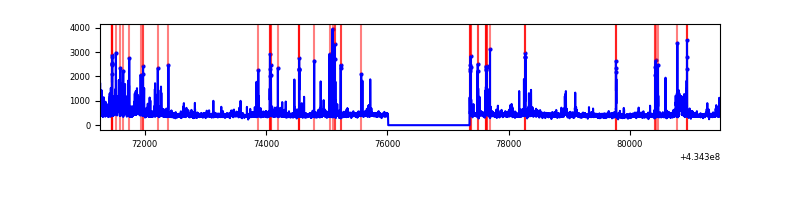 |
Top three noisy pixels from each quadrant. If the there are fewer than three noisy pixels in the level2.evt file, extra rows are filled as -1
| Pixel properties | Quadrant properties | ||||||
|---|---|---|---|---|---|---|---|
| Quadrant | DetID | PixID | Counts | Sigma | Mean | Median | Sigma |
| A | 10 | 83 | 855581 | 4454.76 | 932 | 913 | 191.9 |
| A | 15 | 237 | 489846 | 2548.45 | 932 | 913 | 191.9 |
| A | 13 | 6 | 35293 | 179.2 | 932 | 913 | 191.9 |
| B | 5 | 255 | 530596 | 2984.34 | 933 | 908 | 177.5 |
| B | 0 | 189 | 157922 | 884.64 | 933 | 908 | 177.5 |
| B | 0 | 186 | 90157 | 502.84 | 933 | 908 | 177.5 |
| C | 15 | 214 | 368485 | 1721.73 | 915 | 918 | 213.5 |
| C | 3 | 233 | 256904 | 1199.07 | 915 | 918 | 213.5 |
| C | 15 | 111 | 44572 | 204.48 | 915 | 918 | 213.5 |
| D | 12 | 218 | 240873 | 1092.63 | 913 | 887 | 219.6 |
| D | 13 | 249 | 204847 | 928.61 | 913 | 887 | 219.6 |
| D | 12 | 233 | 48533 | 216.93 | 913 | 887 | 219.6 |
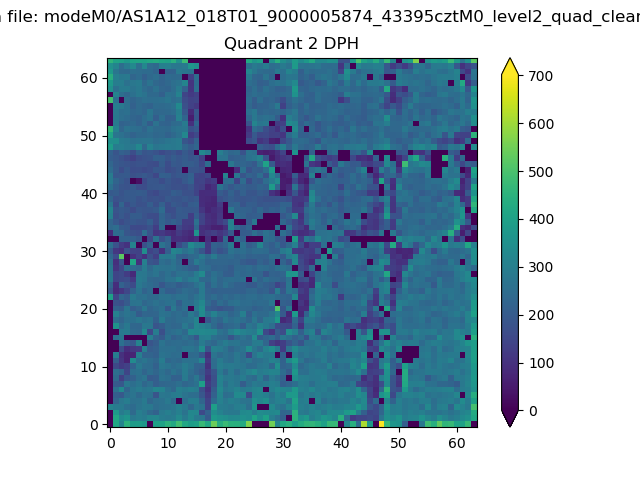
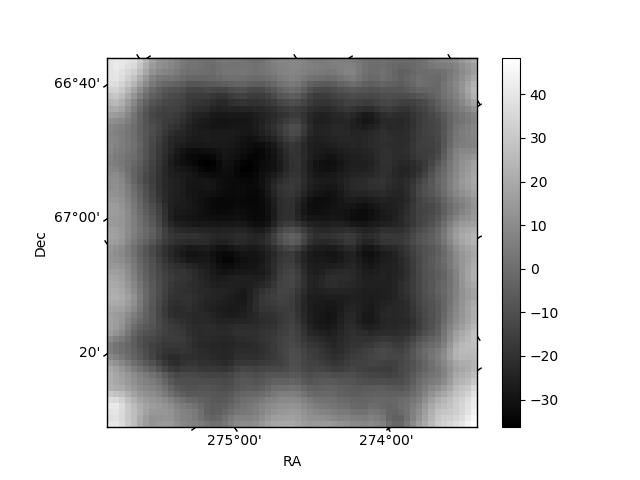
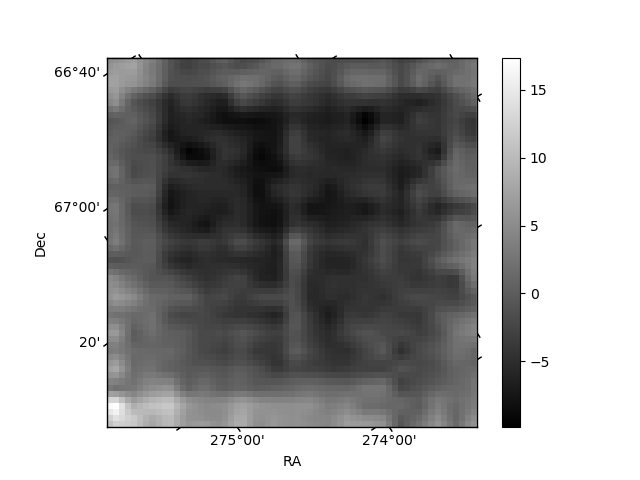
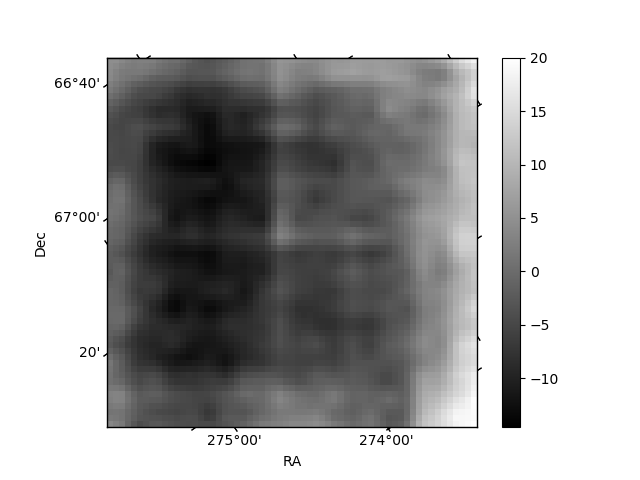
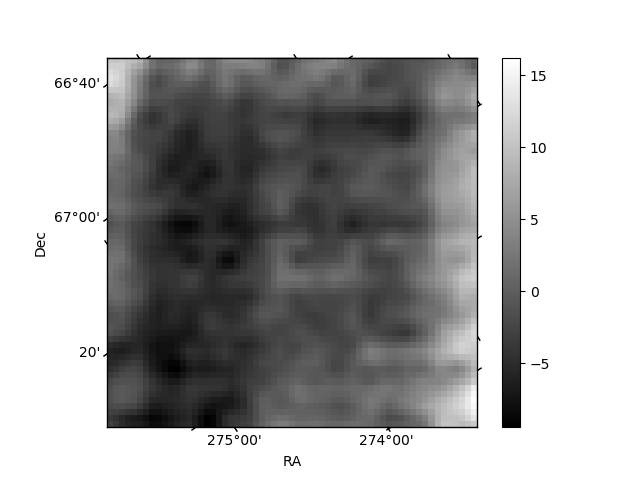
Histogram calculated using DETX and DETY for each event in the final _common_clean file
| Quadrant A | 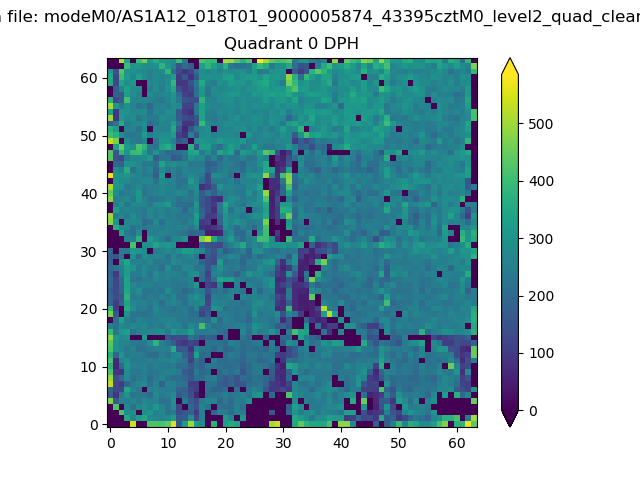 |
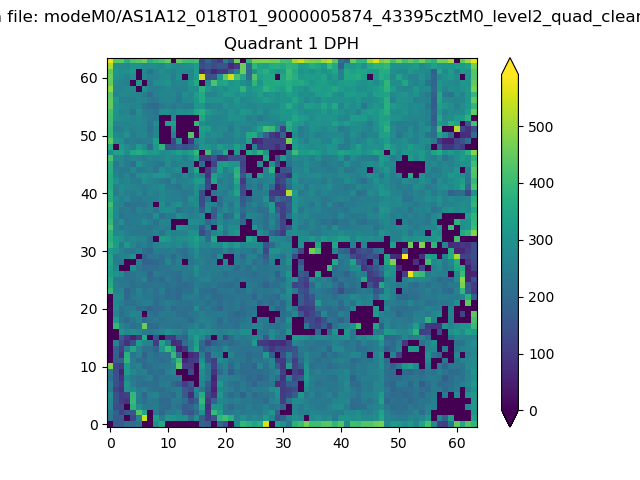 |
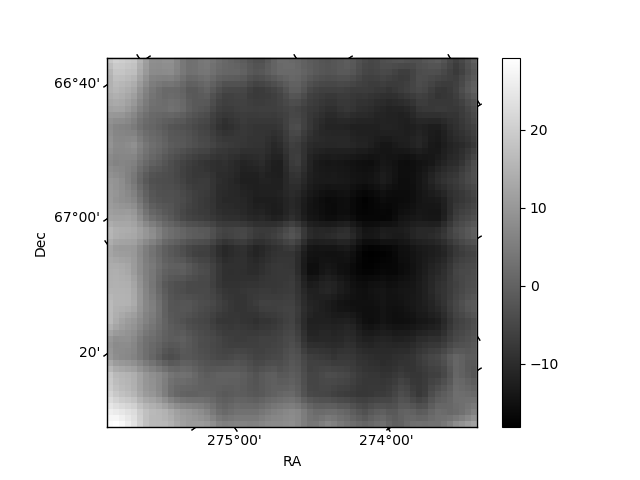
Quadrant B |
|---|---|---|---|
| Quadrant D | 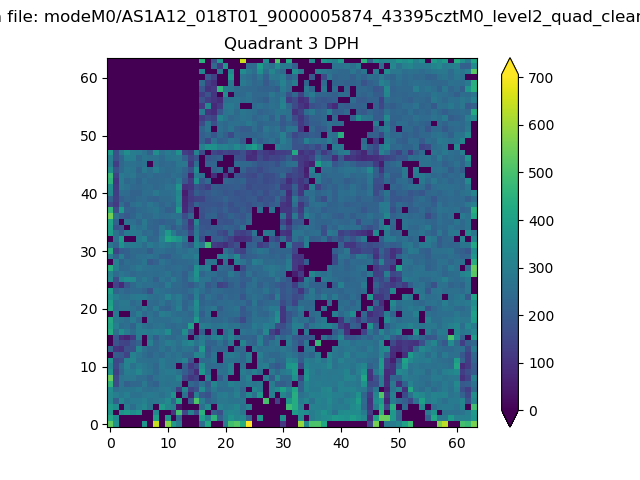 |
 |
Quadrant C |
| Plot type | Count rate plots | Images |
|---|---|---|
| Comparison with Poisson distribution Blue bars denote a histogram of data divided into 1 sec bins. Red curve is a Poisson curve with rate = median count rate of data. |
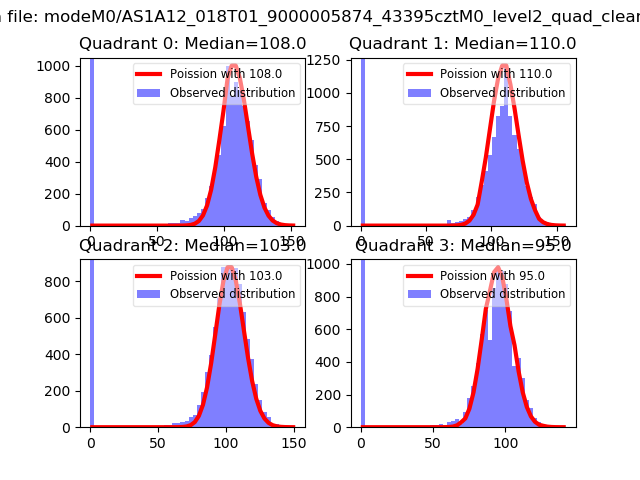 |
 |
| Quadrant-wise count rates Data is divided into 100 sec bins |
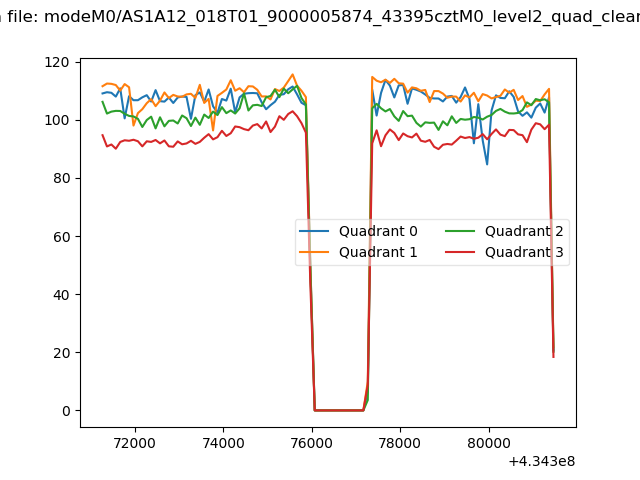 |
|
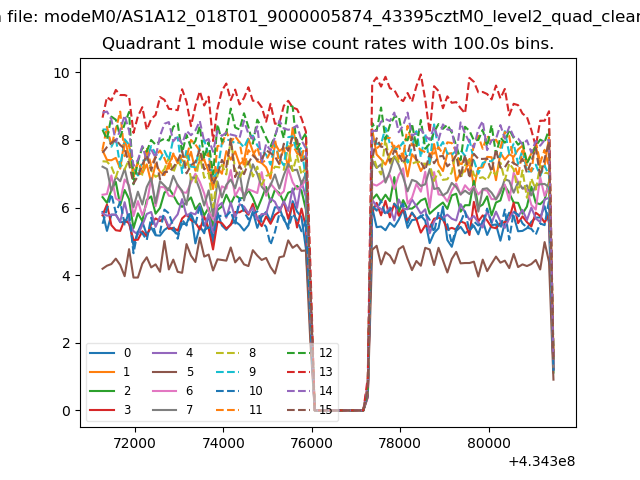
| Module-wise count rates for Quadrant A Data is divided into 100 sec bins |
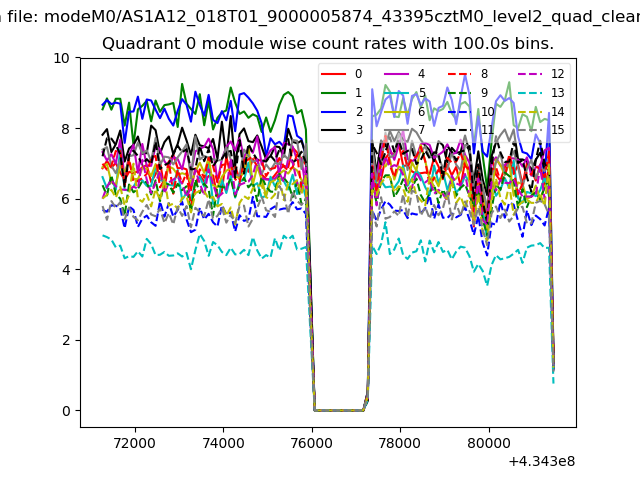 |
 |
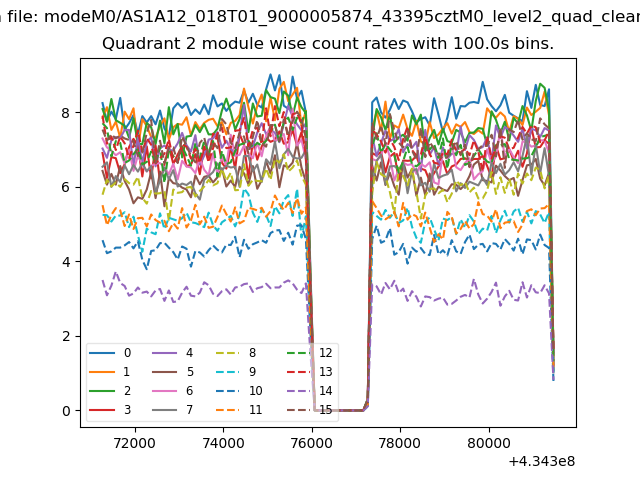
| Module-wise count rates for Quadrant B Data is divided into 100 sec bins |
 |
 |
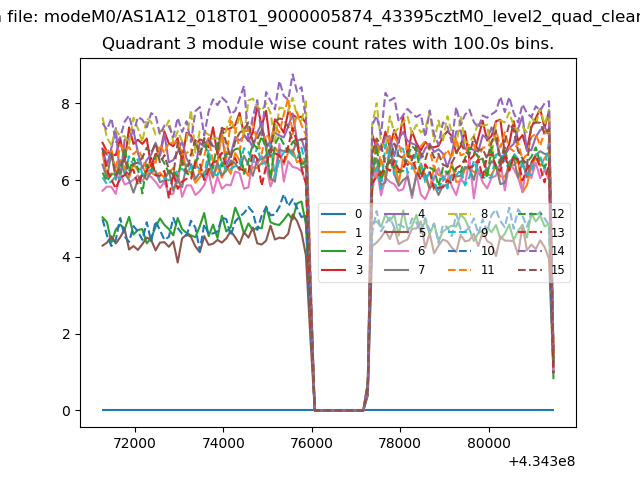
| Module-wise count rates for Quadrant C Data is divided into 100 sec bins |
 |
 |
| Module-wise count rates for Quadrant D Data is divided into 100 sec bins |
 |
 |
| Parameter | Plot |
|---|---|
| CZT HV Monitor | 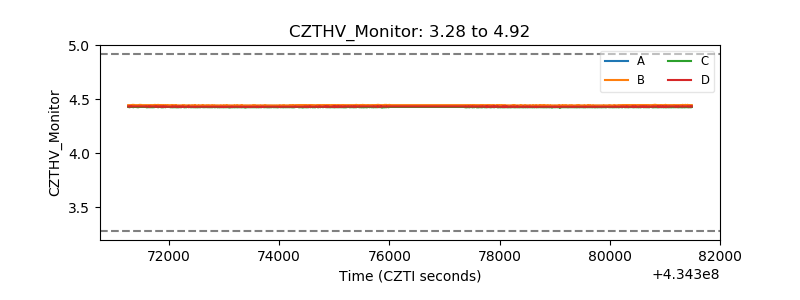 |
| D_VDD | 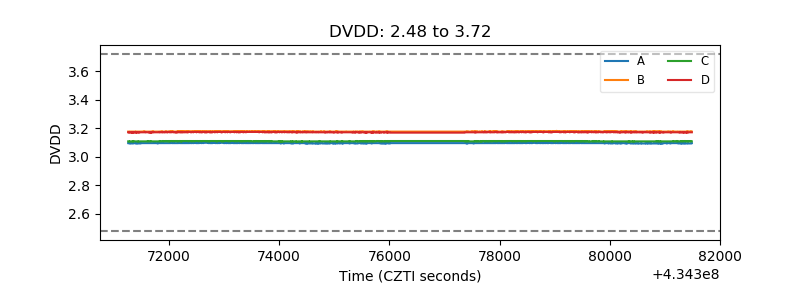 |
| Temperature 1 | 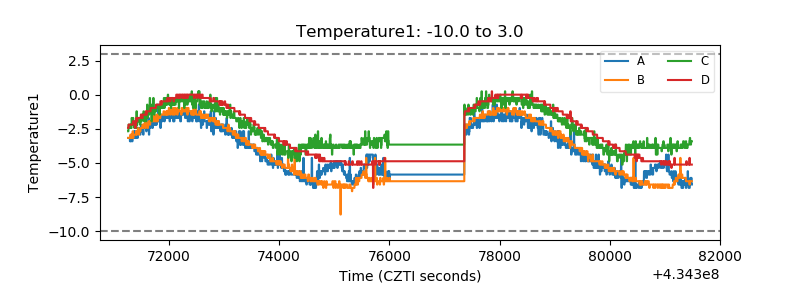 |
| Veto HV Monitor | 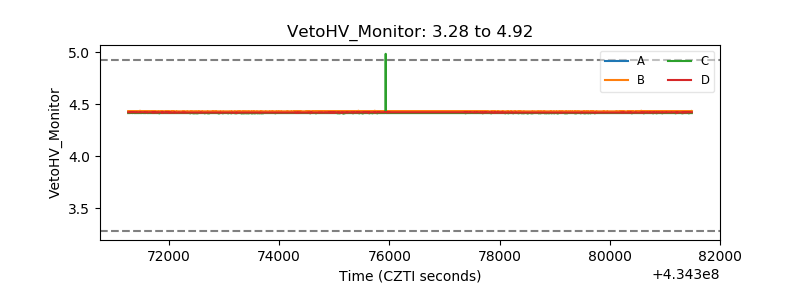 |
| Veto LLD | 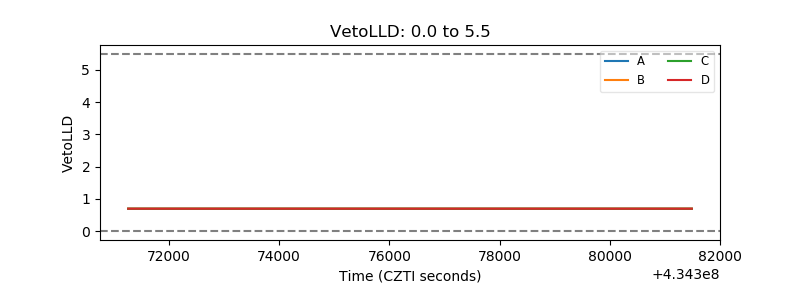 |
| Alpha Counter | 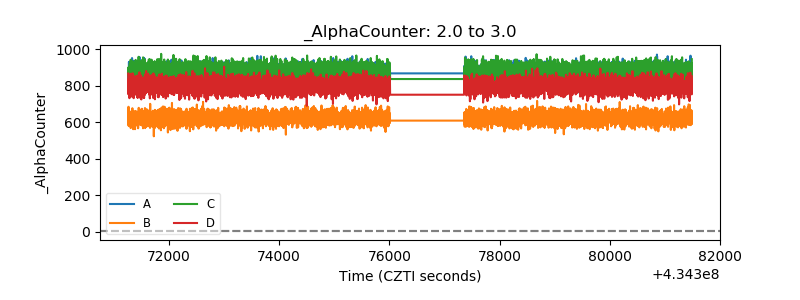 |
| _CPM_Rate | 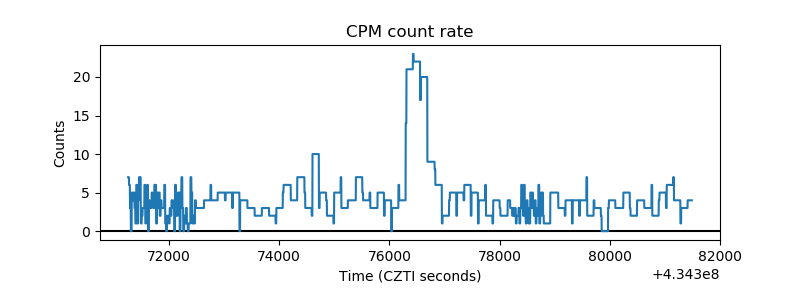 |
| CZT Counter | 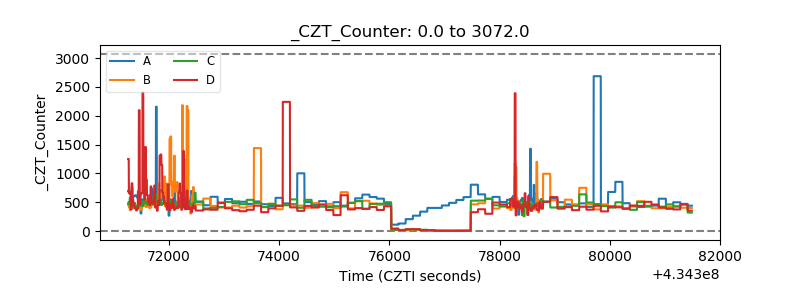 |
| +2.5 Volts monitor | 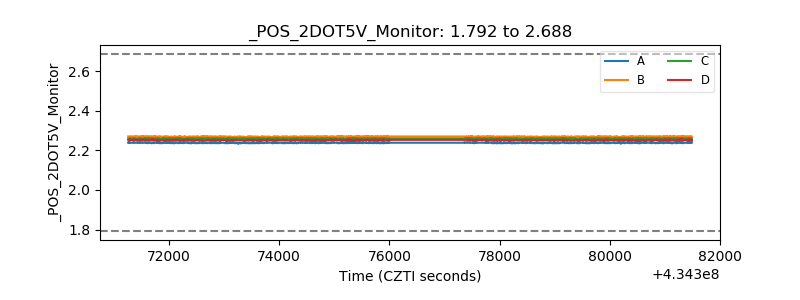 |
| +5 Volts monitor | 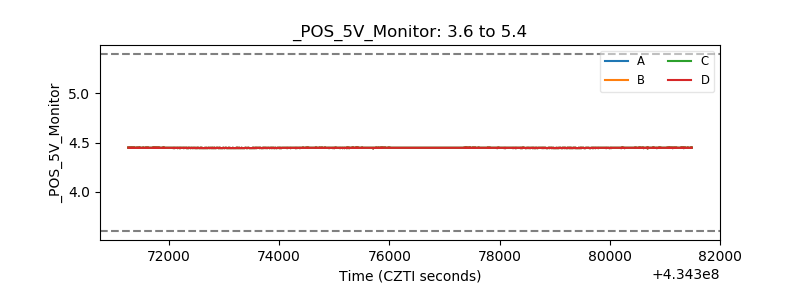 |
| _ROLL_ROT | 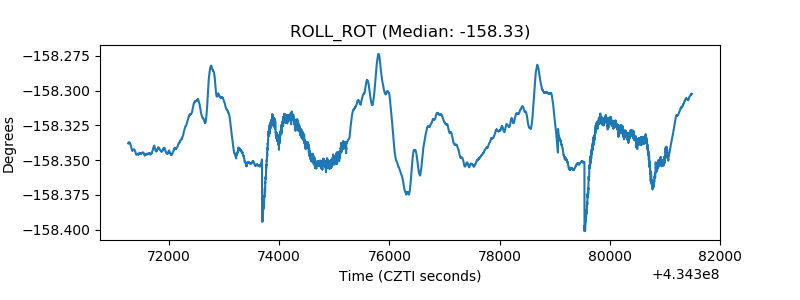 |
| _Roll_DEC | 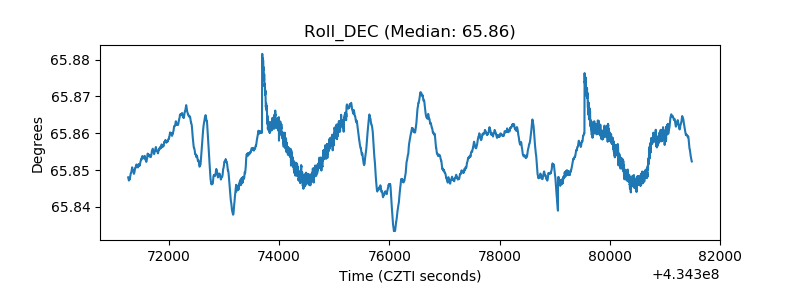 |
| _Roll_RA | 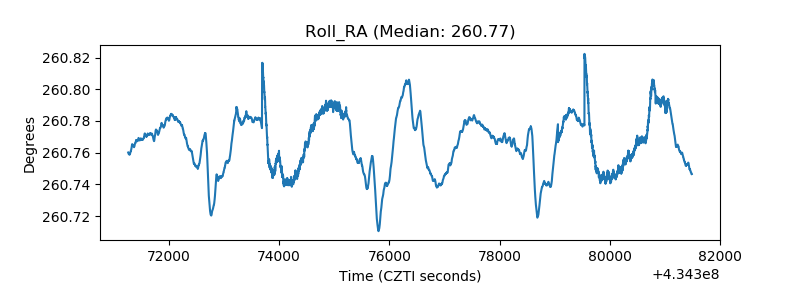 |
| Veto Counter | 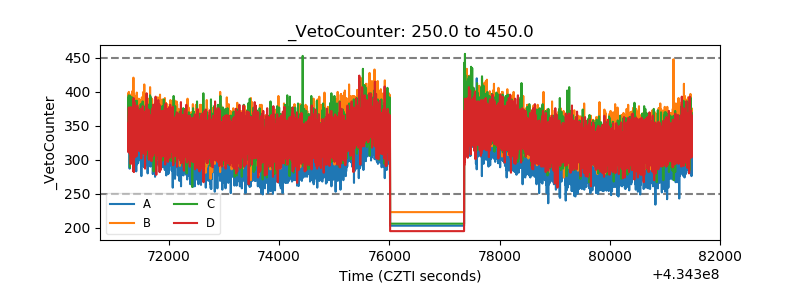 |