| Param | Original file | Final file |
|---|---|---|
| Filename | modeM0/AS1A12_018T01_9000005874_43397cztM0_level2.fits | modeM0/AS1A12_018T01_9000005874_43397cztM0_level2_quad_clean.evt |
| Size (bytes) | 321,071,040 | 89,740,800 |
| Size | 306.2 MB | 85.6 MB |
| Events in quadrant A | 3,397,451 | 594,907 |
| Events in quadrant B | 2,586,363 | 617,547 |
| Events in quadrant C | 2,765,130 | 582,188 |
| Events in quadrant D | 2,705,439 | 536,150 |
| Mode M0 | |||
|---|---|---|---|
| Quadrant | BADHDUFLAG | Total packets | Discarded packets |
| A | 0 | 13563 | 2 |
| B | 0 | 11577 | 2 |
| C | 0 | 11711 | 2 |
| D | 0 | 12130 | 2 |
| Mode M9 | |||
|---|---|---|---|
| Quadrant | BADHDUFLAG | Total packets | Discarded packets |
| A | 0 | 21 | 0 |
| B | 0 | 22 | 0 |
| C | 0 | 22 | 0 |
| D | 0 | 22 | 0 |
| Mode SS | |||
|---|---|---|---|
| Quadrant | BADHDUFLAG | Total packets | Discarded packets |
| A | 0 | 112 | 0 |
| B | 0 | 112 | 0 |
| C | 0 | 112 | 0 |
| D | 0 | 112 | 0 |
| Quadrant | Total seconds | Saturated seconds | Saturation percentage |
|---|---|---|---|
| A | 5522 | 132 | 2.390438% |
| B | 5522 | 20 | 0.362188% |
| C | 5522 | 20 | 0.362188% |
| D | 5522 | 71 | 1.285766% |
Noise dominated data is calculated using 1-second bins in cleaned event files. If a bin has >2000 counts, and if more than 50% of those come from <1% of pixels, then it is considered to be noise-dominated and hence unusable.
| Quadrant | # 1 sec bins | Bins with >0 counts | Bins with >2000 counts | High rate bins dominated by noise | Noise dominated (total time) | Noise dominated (detector-on time) | Marked lightcurve |
|---|---|---|---|---|---|---|---|
| A | 7196 | 5523 | 98 | 98 | 1.36% | 1.77% | 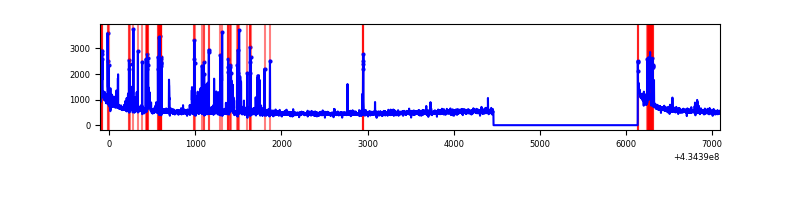 |
| B | 7196 | 5523 | 10 | 10 | 0.14% | 0.18% | 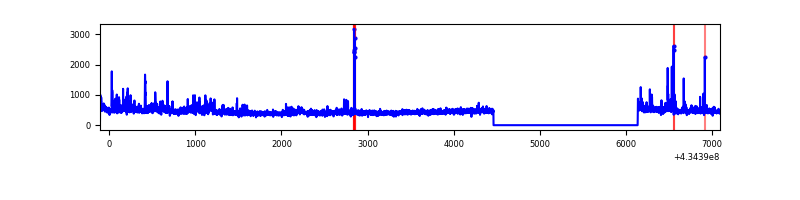 |
| C | 7196 | 5523 | 13 | 13 | 0.18% | 0.24% | 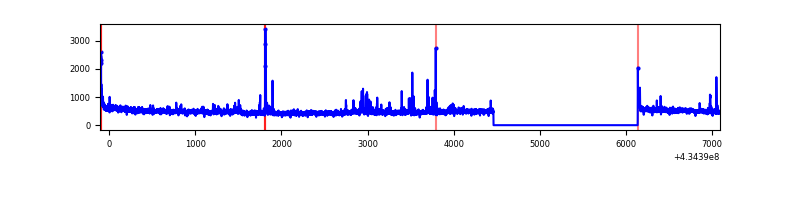 |
| D | 7196 | 5523 | 65 | 65 | 0.90% | 1.18% | 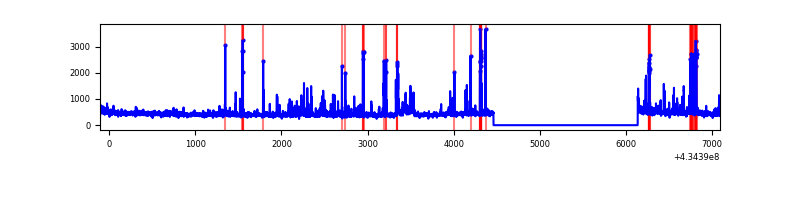 |
Top three noisy pixels from each quadrant. If the there are fewer than three noisy pixels in the level2.evt file, extra rows are filled as -1
| Pixel properties | Quadrant properties | ||||||
|---|---|---|---|---|---|---|---|
| Quadrant | DetID | PixID | Counts | Sigma | Mean | Median | Sigma |
| A | 10 | 83 | 639246 | 5302.23 | 583 | 570 | 120.5 |
| A | 15 | 237 | 424645 | 3520.63 | 583 | 570 | 120.5 |
| A | 13 | 248 | 43259 | 354.4 | 583 | 570 | 120.5 |
| B | 5 | 255 | 90192 | 788.38 | 590 | 572 | 113.7 |
| B | 0 | 189 | 55687 | 484.85 | 590 | 572 | 113.7 |
| B | 0 | 190 | 35512 | 307.37 | 590 | 572 | 113.7 |
| C | 15 | 214 | 230352 | 1690.9 | 579 | 581 | 135.9 |
| C | 3 | 233 | 168527 | 1235.92 | 579 | 581 | 135.9 |
| C | 15 | 111 | 63962 | 466.42 | 579 | 581 | 135.9 |
| D | 12 | 6 | 148192 | 1050.92 | 576 | 559 | 140.5 |
| D | 10 | 118 | 109748 | 777.26 | 576 | 559 | 140.5 |
| D | 1 | 47 | 88158 | 623.57 | 576 | 559 | 140.5 |
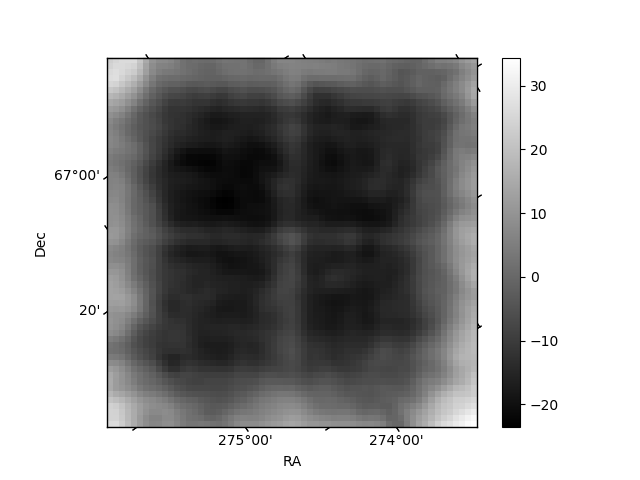
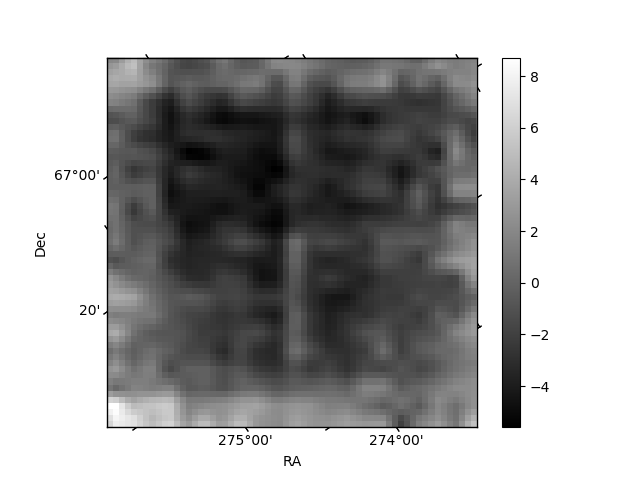
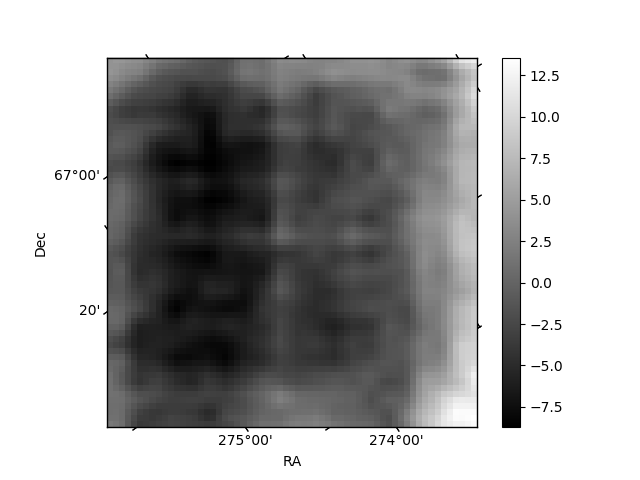
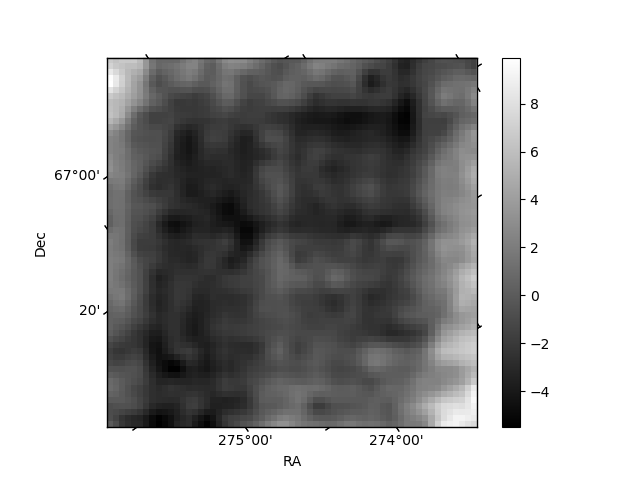
Histogram calculated using DETX and DETY for each event in the final _common_clean file
| Quadrant A | 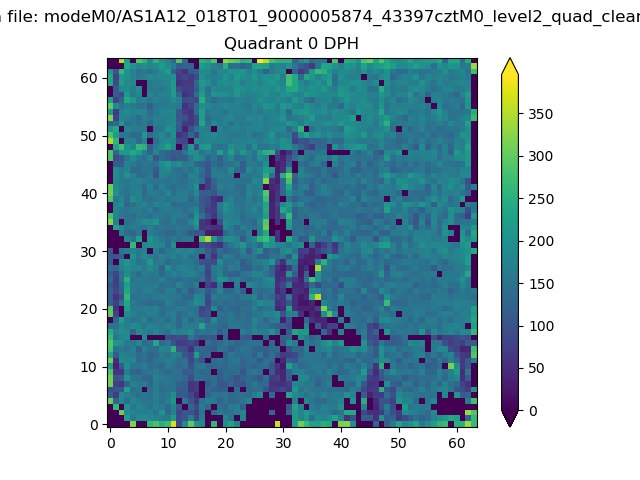 |
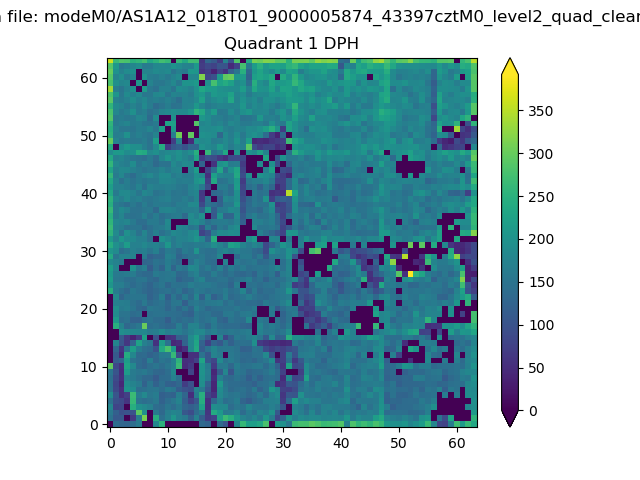 |
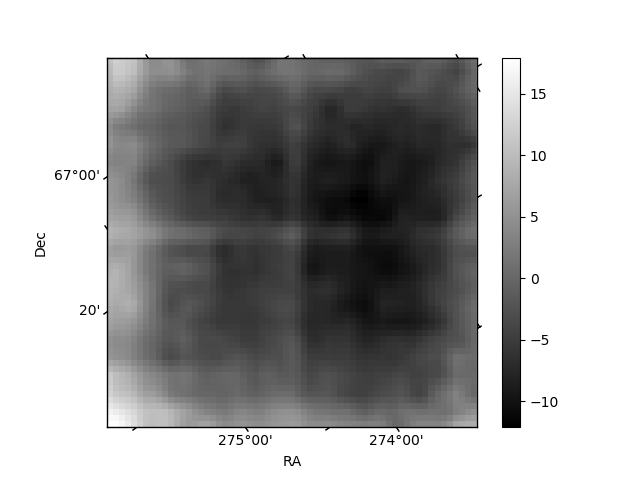
Quadrant B |
|---|---|---|---|
| Quadrant D | 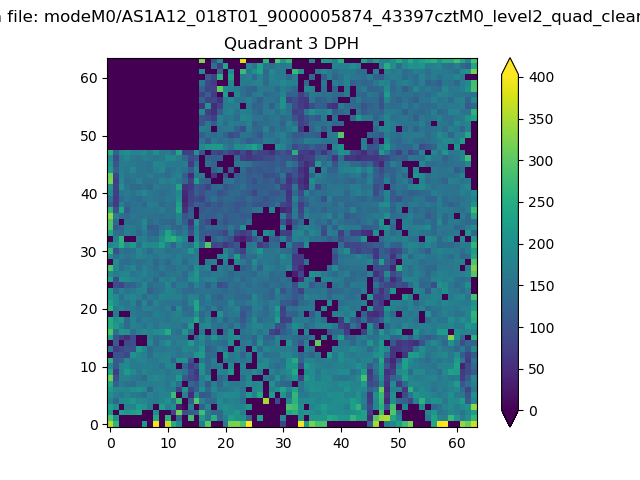 |
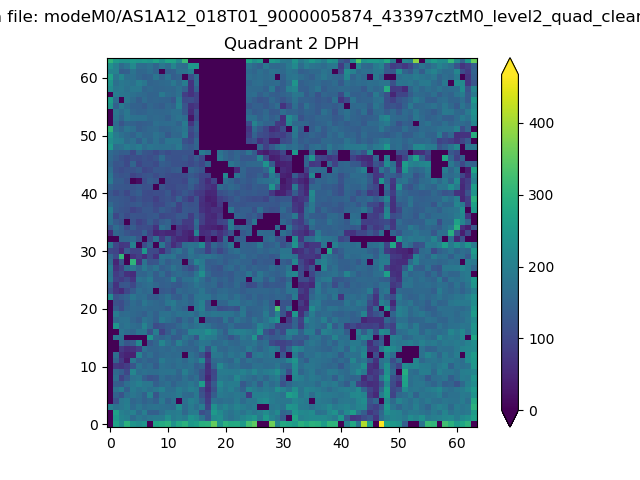 |
Quadrant C |
| Plot type | Count rate plots | Images |
|---|---|---|
| Comparison with Poisson distribution Blue bars denote a histogram of data divided into 1 sec bins. Red curve is a Poisson curve with rate = median count rate of data. |
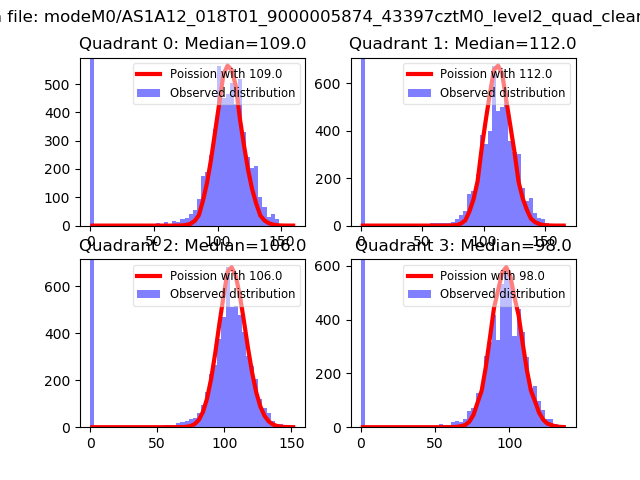 |
 |
| Quadrant-wise count rates Data is divided into 100 sec bins |
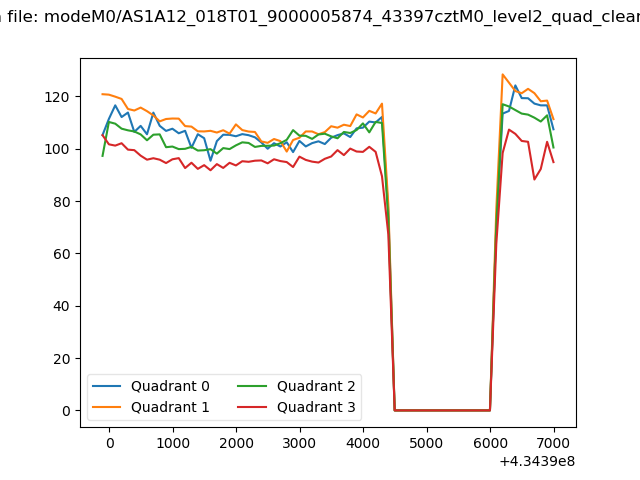 |
|
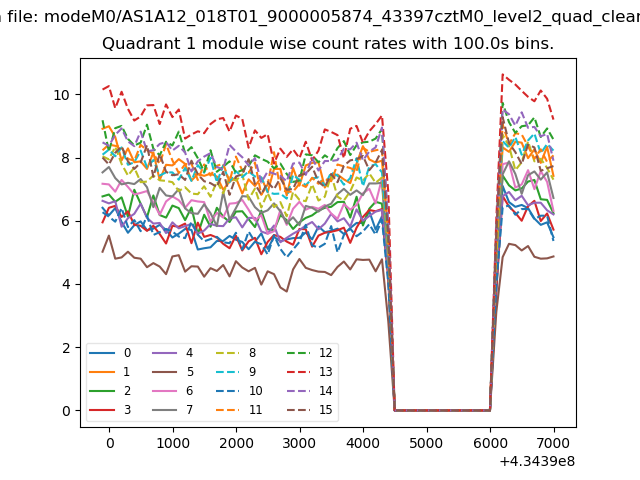
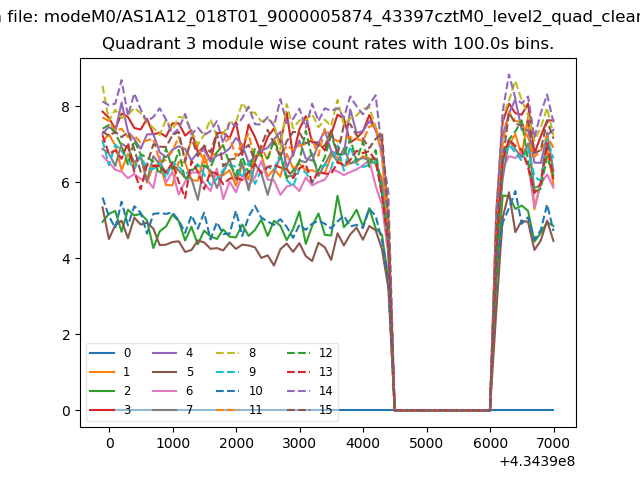
| Module-wise count rates for Quadrant A Data is divided into 100 sec bins |
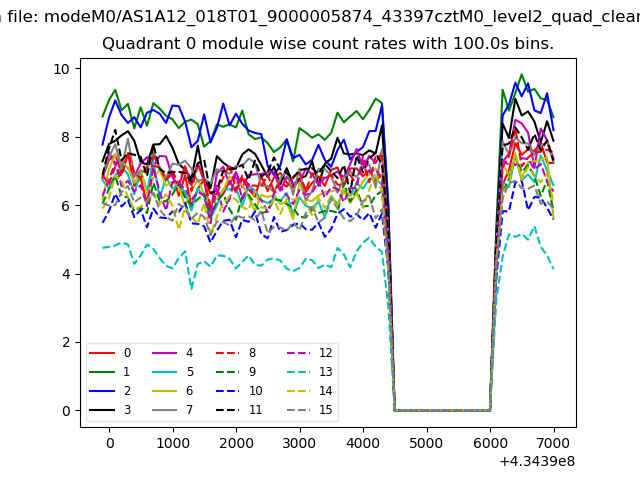 |
 |
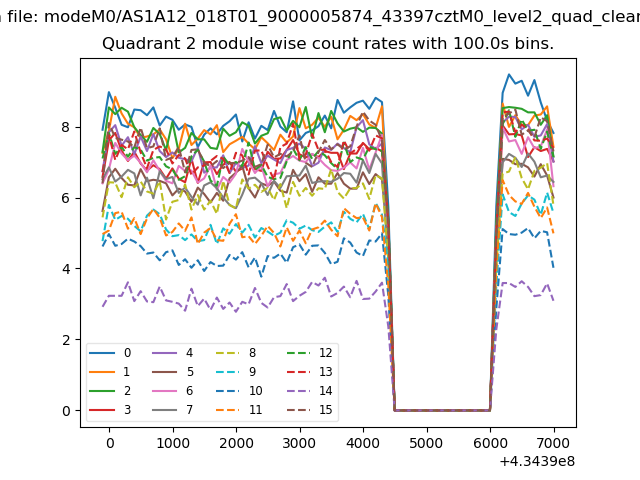
| Module-wise count rates for Quadrant B Data is divided into 100 sec bins |
 |
 |
| Module-wise count rates for Quadrant C Data is divided into 100 sec bins |
 |
 |
| Module-wise count rates for Quadrant D Data is divided into 100 sec bins |
 |
 |
| Parameter | Plot |
|---|---|
| CZT HV Monitor | 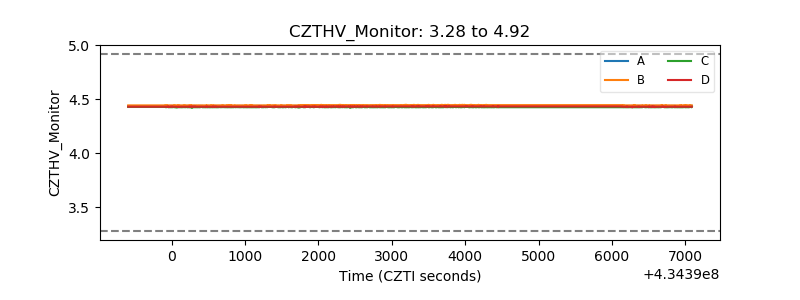 |
| D_VDD | 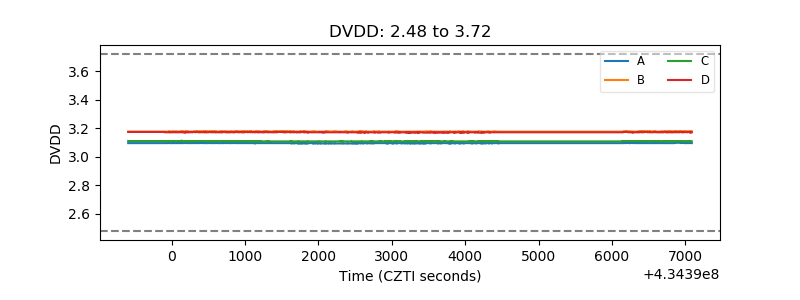 |
| Temperature 1 | 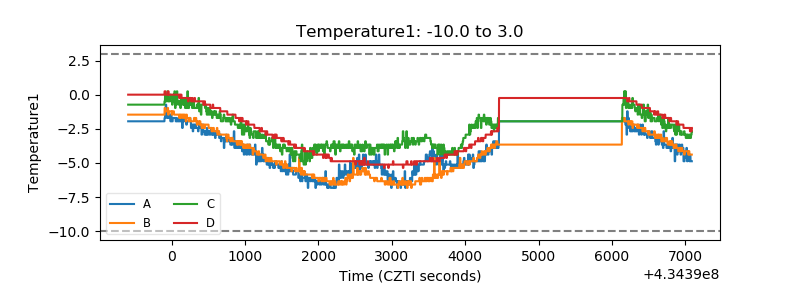 |
| Veto HV Monitor | 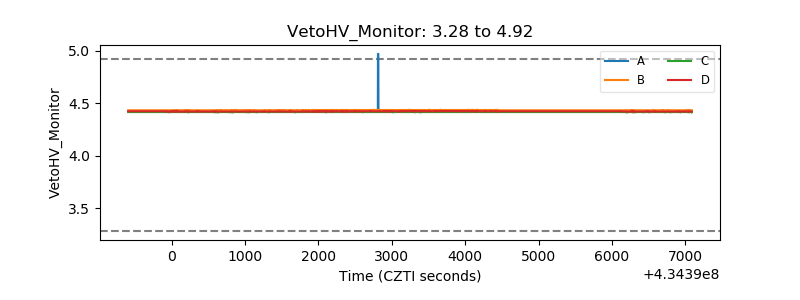 |
| Veto LLD | 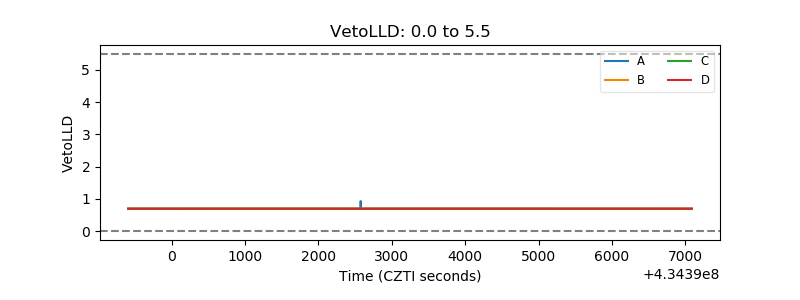 |
| Alpha Counter | 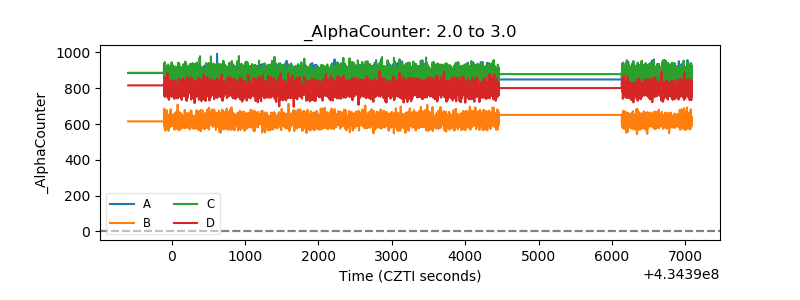 |
| _CPM_Rate | 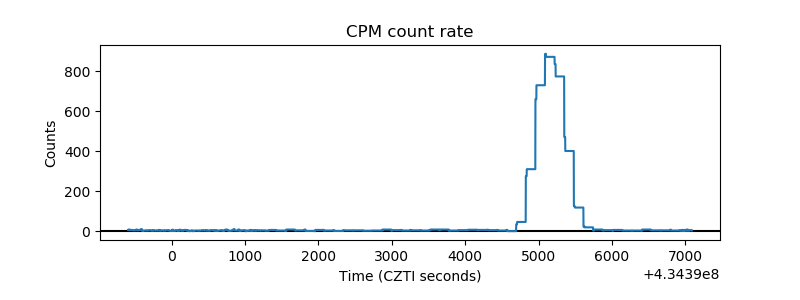 |
| CZT Counter | 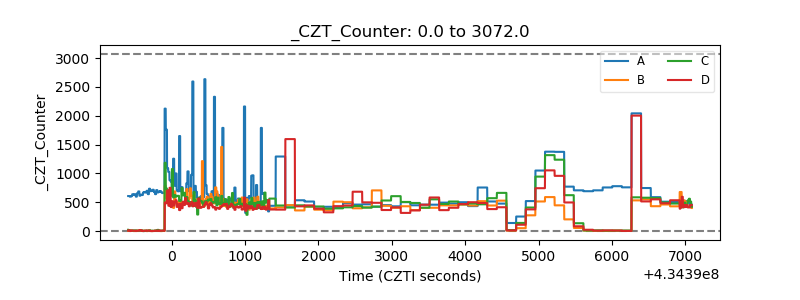 |
| +2.5 Volts monitor | 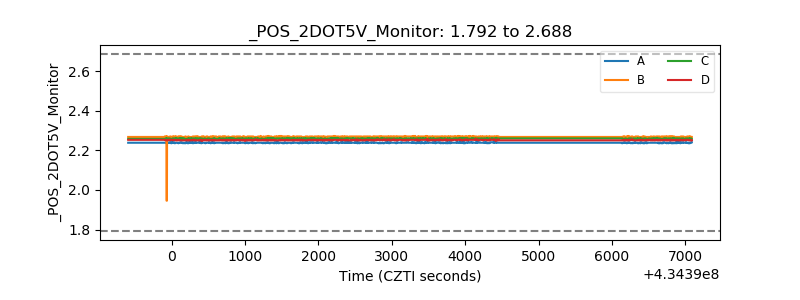 |
| +5 Volts monitor | 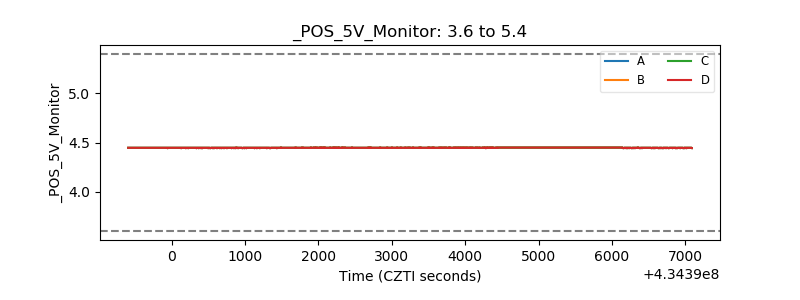 |
| _ROLL_ROT | 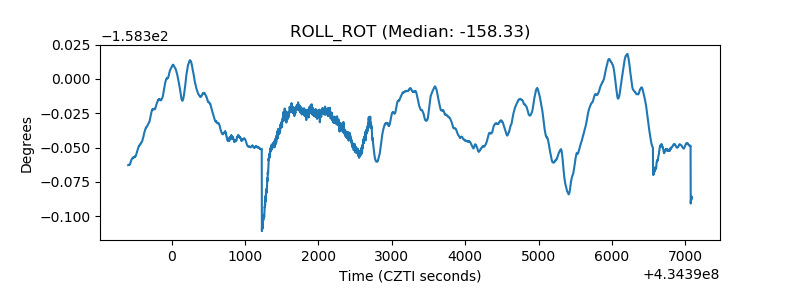 |
| _Roll_DEC | 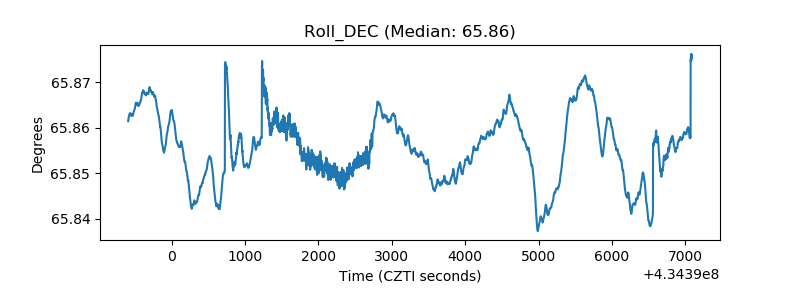 |
| _Roll_RA | 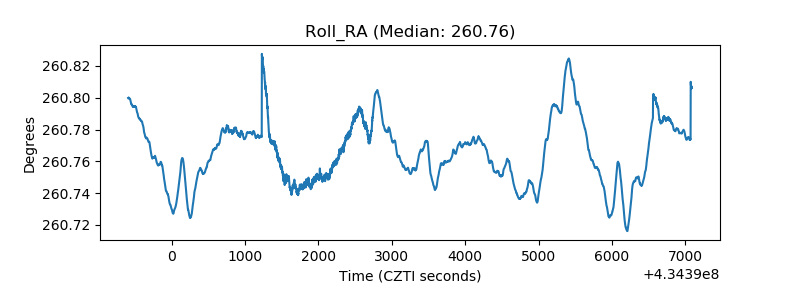 |
| Veto Counter | 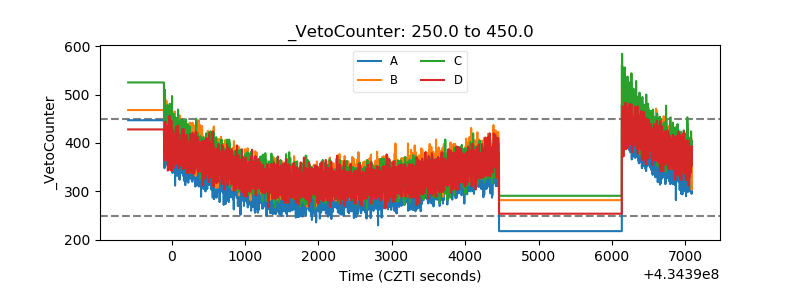 |