| Param | Original file | Final file |
|---|---|---|
| Filename | modeM0/AS1A12_018T01_9000005874_43399cztM0_level2.fits | modeM0/AS1A12_018T01_9000005874_43399cztM0_level2_quad_clean.evt |
| Size (bytes) | 325,149,120 | 88,657,920 |
| Size | 310.1 MB | 84.6 MB |
| Events in quadrant A | 3,392,825 | 583,249 |
| Events in quadrant B | 2,448,015 | 614,447 |
| Events in quadrant C | 2,717,034 | 584,140 |
| Events in quadrant D | 3,062,418 | 529,417 |
| Mode M0 | |||
|---|---|---|---|
| Quadrant | BADHDUFLAG | Total packets | Discarded packets |
| A | 0 | 13466 | 2 |
| B | 0 | 11055 | 3 |
| C | 0 | 11531 | 2 |
| D | 0 | 12936 | 2 |
| Mode M9 | |||
|---|---|---|---|
| Quadrant | BADHDUFLAG | Total packets | Discarded packets |
| A | 0 | 24 | 0 |
| B | 0 | 25 | 0 |
| C | 0 | 25 | 0 |
| D | 0 | 25 | 0 |
| Mode SS | |||
|---|---|---|---|
| Quadrant | BADHDUFLAG | Total packets | Discarded packets |
| A | 0 | 108 | 0 |
| B | 0 | 108 | 0 |
| C | 0 | 108 | 0 |
| D | 0 | 108 | 0 |
| Quadrant | Total seconds | Saturated seconds | Saturation percentage |
|---|---|---|---|
| A | 5332 | 189 | 3.544636% |
| B | 5331 | 24 | 0.450197% |
| C | 5331 | 26 | 0.487713% |
| D | 5331 | 130 | 2.438567% |
Noise dominated data is calculated using 1-second bins in cleaned event files. If a bin has >2000 counts, and if more than 50% of those come from <1% of pixels, then it is considered to be noise-dominated and hence unusable.
| Quadrant | # 1 sec bins | Bins with >0 counts | Bins with >2000 counts | High rate bins dominated by noise | Noise dominated (total time) | Noise dominated (detector-on time) | Marked lightcurve |
|---|---|---|---|---|---|---|---|
| A | 7155 | 5333 | 126 | 126 | 1.76% | 2.36% | 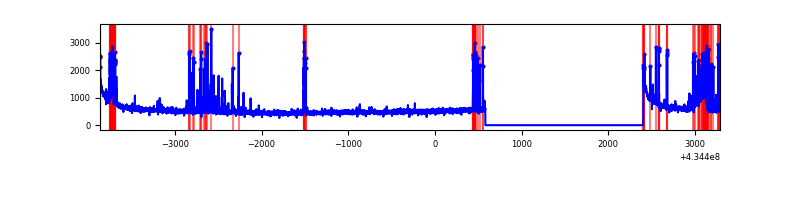 |
| B | 7154 | 5332 | 12 | 12 | 0.17% | 0.23% | 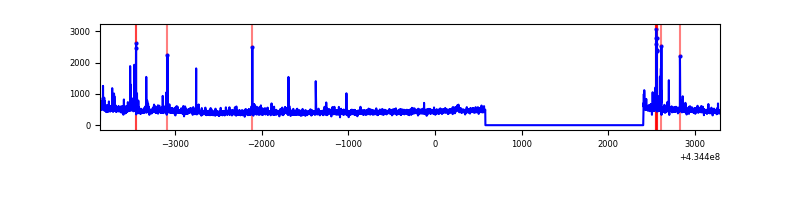 |
| C | 7154 | 5332 | 26 | 26 | 0.36% | 0.49% | 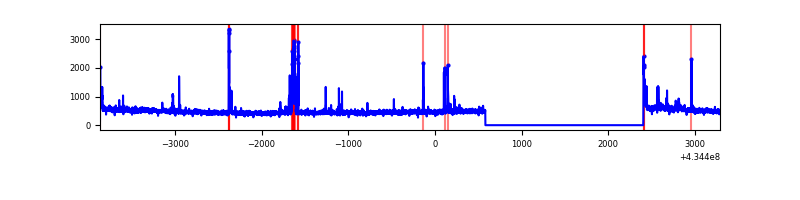 |
| D | 7154 | 5332 | 130 | 130 | 1.82% | 2.44% | 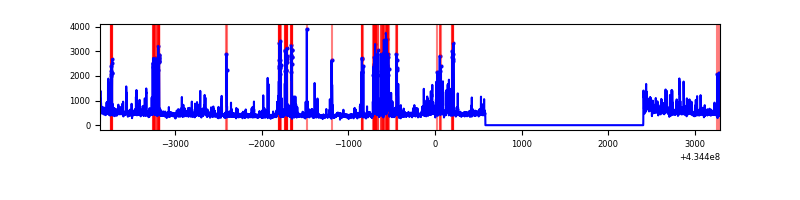 |
Top three noisy pixels from each quadrant. If the there are fewer than three noisy pixels in the level2.evt file, extra rows are filled as -1
| Pixel properties | Quadrant properties | ||||||
|---|---|---|---|---|---|---|---|
| Quadrant | DetID | PixID | Counts | Sigma | Mean | Median | Sigma |
| A | 10 | 83 | 614220 | 5282.11 | 564 | 553 | 116.2 |
| A | 15 | 237 | 414149 | 3560.01 | 564 | 553 | 116.2 |
| A | 13 | 248 | 162762 | 1396.21 | 564 | 553 | 116.2 |
| B | 0 | 190 | 58985 | 530.49 | 576 | 561 | 110.1 |
| B | 0 | 189 | 35798 | 319.95 | 576 | 561 | 110.1 |
| B | 5 | 255 | 27136 | 241.3 | 576 | 561 | 110.1 |
| C | 15 | 214 | 221455 | 1674.6 | 567 | 571 | 131.9 |
| C | 15 | 111 | 137015 | 1034.43 | 567 | 571 | 131.9 |
| C | 3 | 233 | 99778 | 752.12 | 567 | 571 | 131.9 |
| D | 1 | 52 | 254070 | 1853.48 | 558 | 539 | 136.8 |
| D | 12 | 6 | 238889 | 1742.5 | 558 | 539 | 136.8 |
| D | 12 | 16 | 112620 | 819.39 | 558 | 539 | 136.8 |
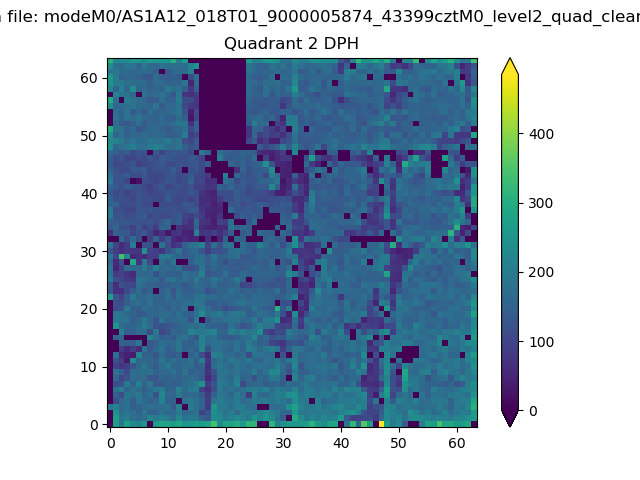
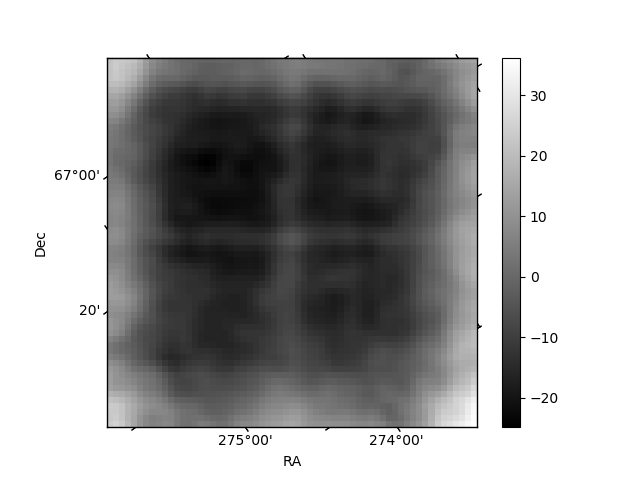
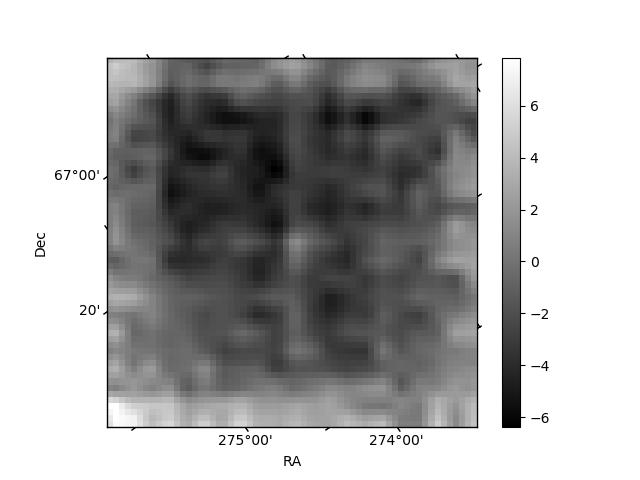
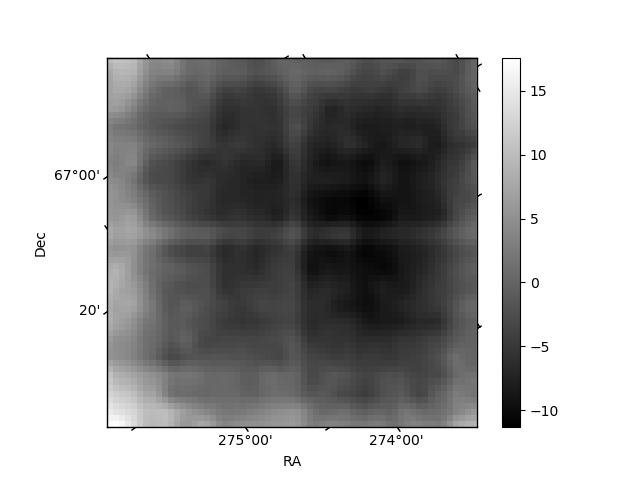
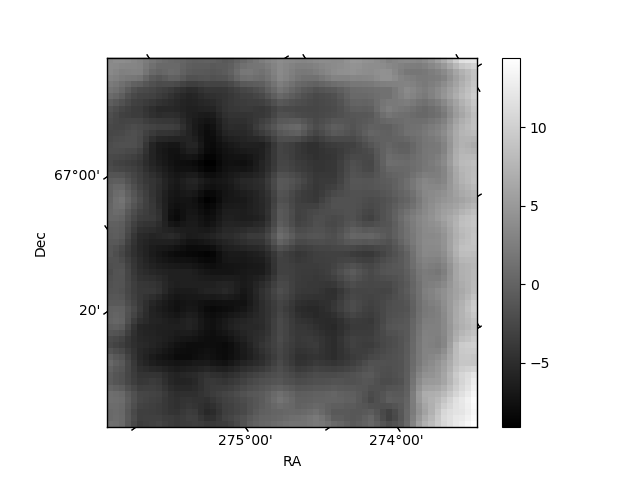
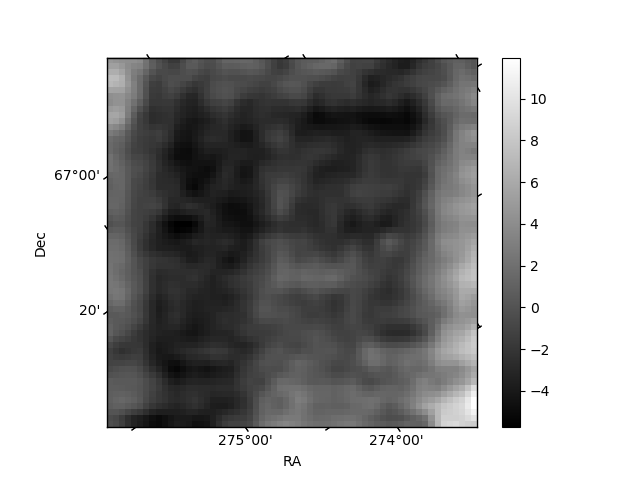
Histogram calculated using DETX and DETY for each event in the final _common_clean file
| Quadrant A | 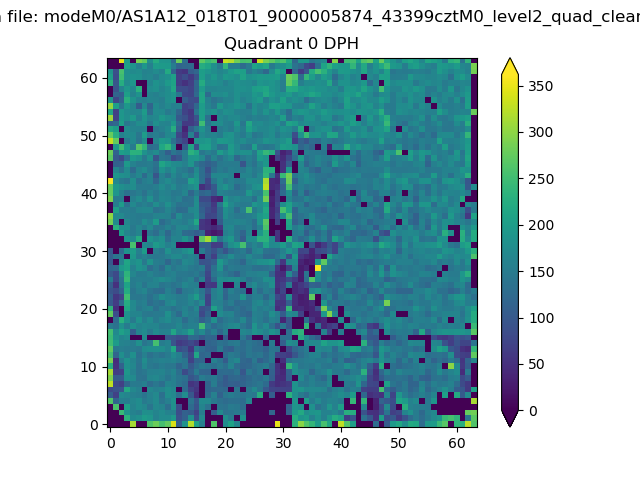 |
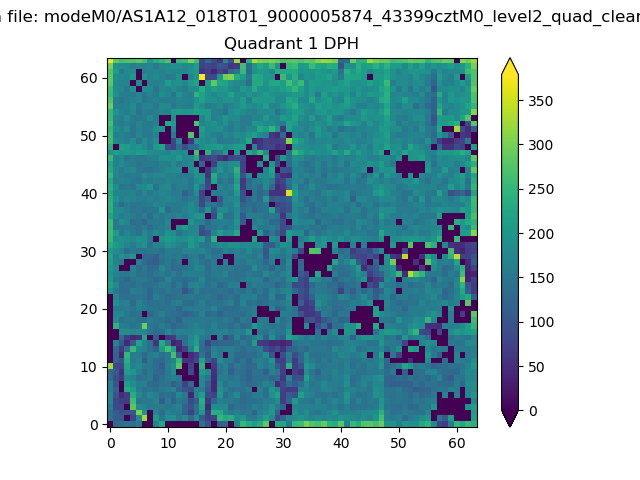 |
Quadrant B |
|---|---|---|---|
| Quadrant D | 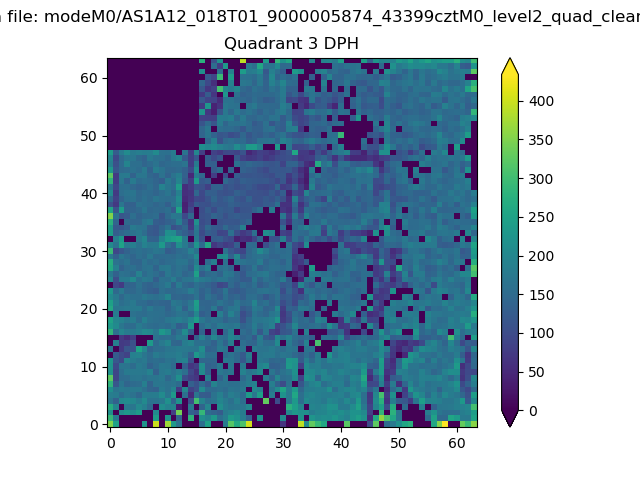 |
 |
Quadrant C |
| Plot type | Count rate plots | Images |
|---|---|---|
| Comparison with Poisson distribution Blue bars denote a histogram of data divided into 1 sec bins. Red curve is a Poisson curve with rate = median count rate of data. |
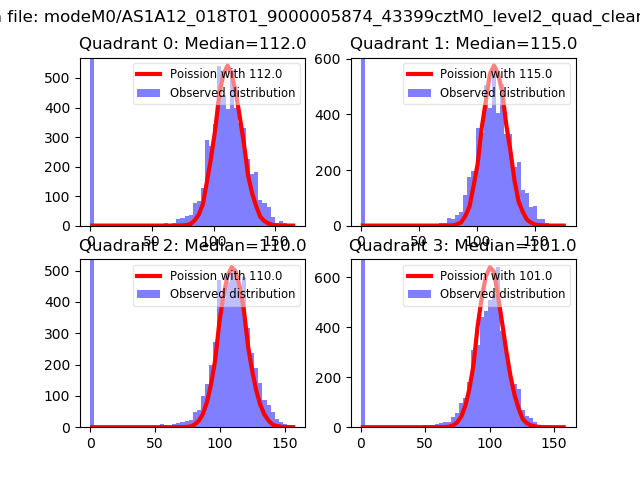 |
 |
| Quadrant-wise count rates Data is divided into 100 sec bins |
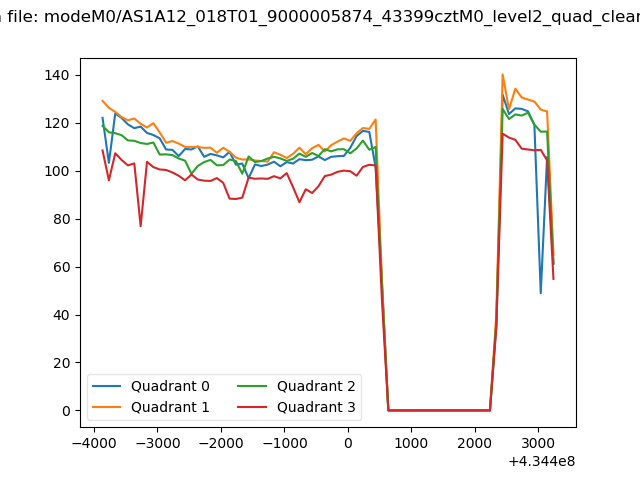 |
|
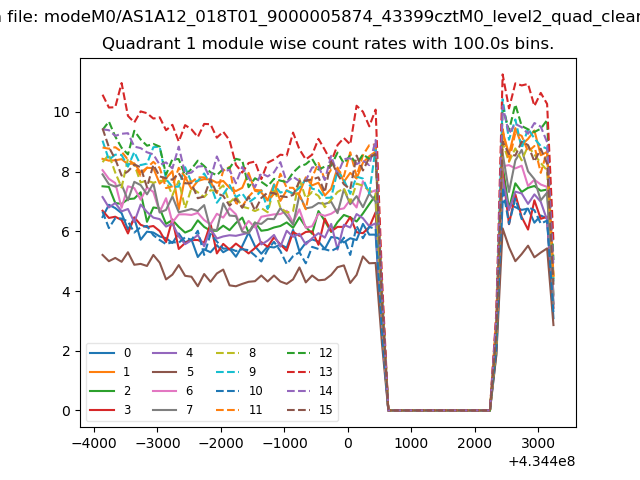
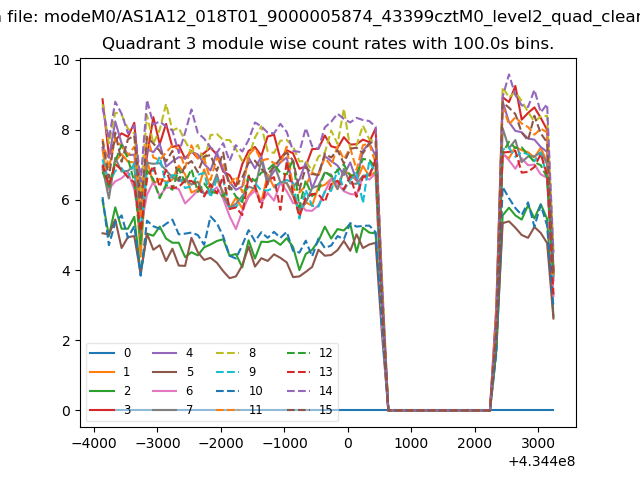
| Module-wise count rates for Quadrant A Data is divided into 100 sec bins |
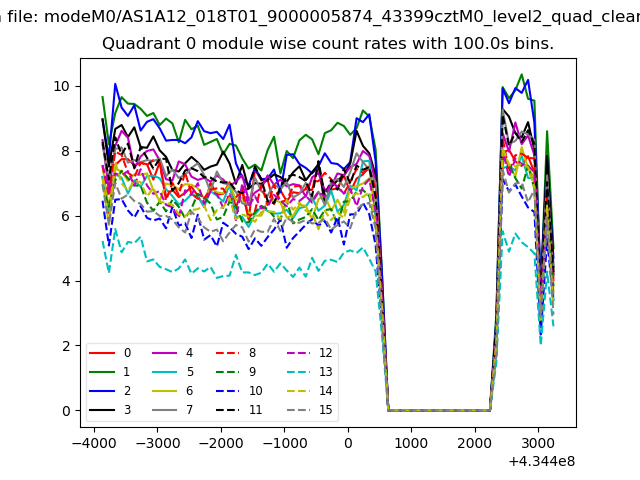 |
 |
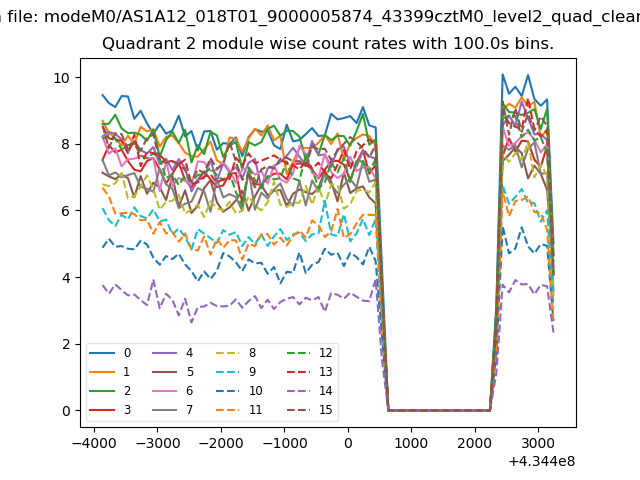
| Module-wise count rates for Quadrant B Data is divided into 100 sec bins |
 |
 |
| Module-wise count rates for Quadrant C Data is divided into 100 sec bins |
 |
 |
| Module-wise count rates for Quadrant D Data is divided into 100 sec bins |
 |
 |
| Parameter | Plot |
|---|---|
| CZT HV Monitor | 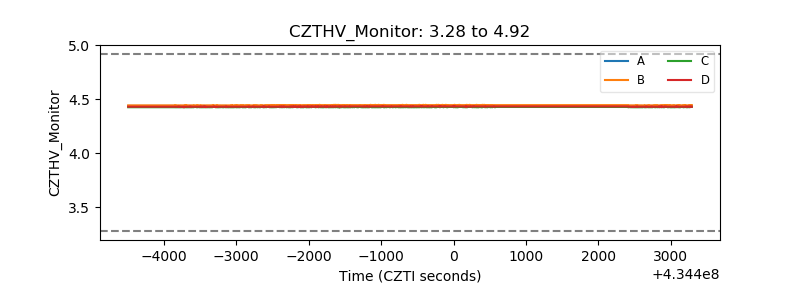 |
| D_VDD | 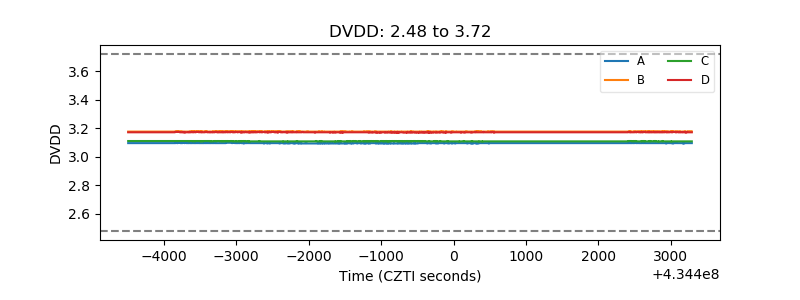 |
| Temperature 1 | 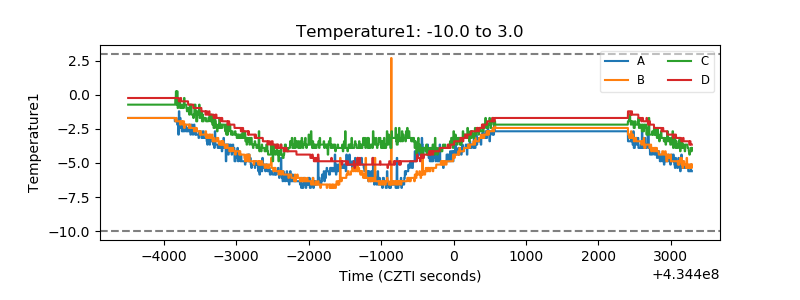 |
| Veto HV Monitor | 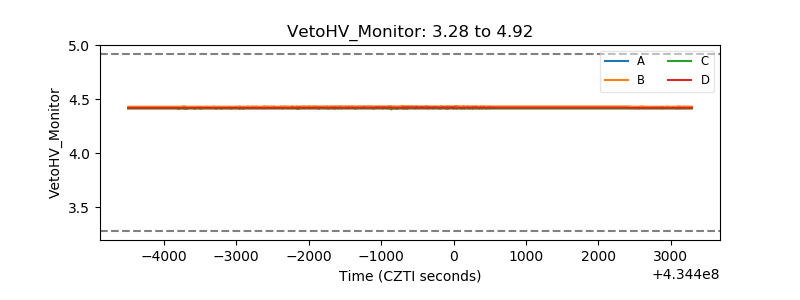 |
| Veto LLD | 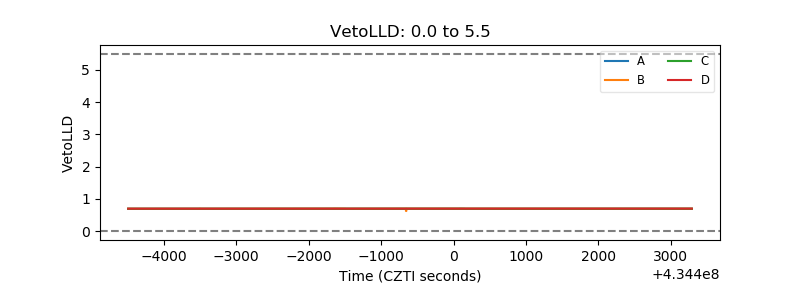 |
| Alpha Counter | 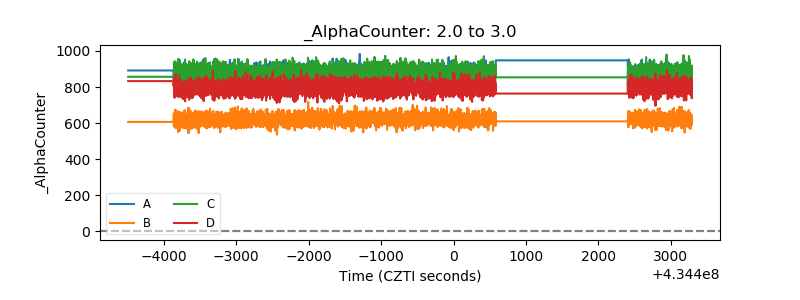 |
| _CPM_Rate | 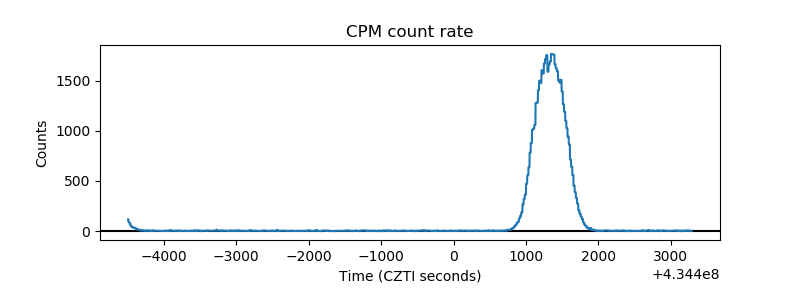 |
| CZT Counter | 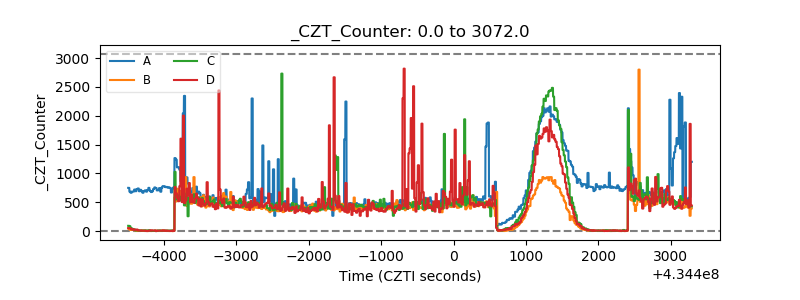 |
| +2.5 Volts monitor | 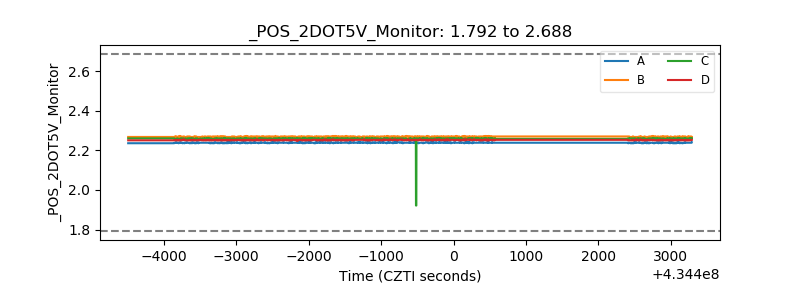 |
| +5 Volts monitor | 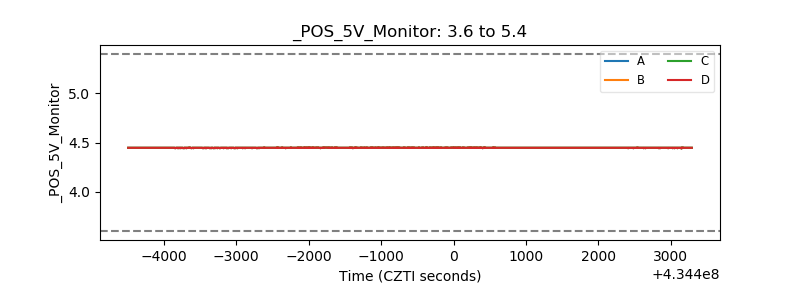 |
| _ROLL_ROT | 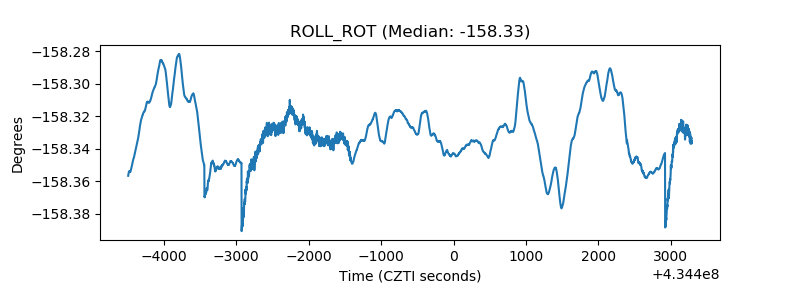 |
| _Roll_DEC | 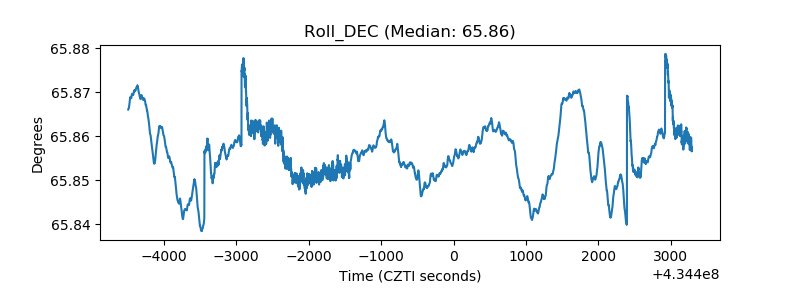 |
| _Roll_RA | 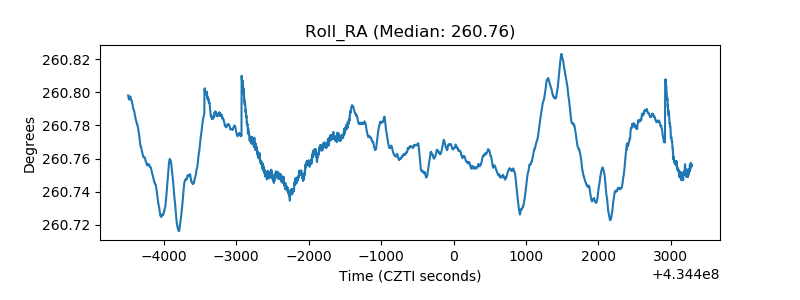 |
| Veto Counter | 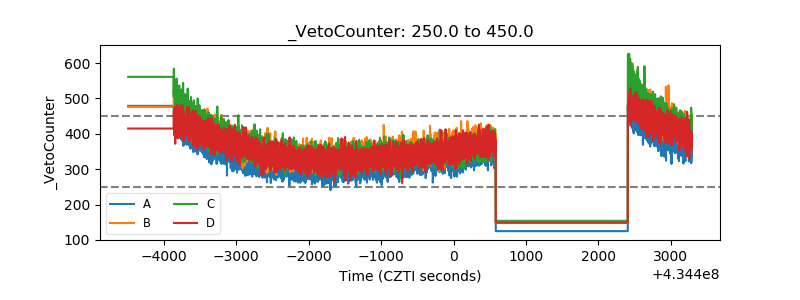 |