| Param | Original file | Final file |
|---|---|---|
| Filename | modeM0/AS1A12_018T01_9000005874_43400cztM0_level2.fits | modeM0/AS1A12_018T01_9000005874_43400cztM0_level2_quad_clean.evt |
| Size (bytes) | 300,703,680 | 87,693,120 |
| Size | 286.8 MB | 83.6 MB |
| Events in quadrant A | 3,334,098 | 568,231 |
| Events in quadrant B | 2,326,696 | 611,175 |
| Events in quadrant C | 2,576,304 | 584,463 |
| Events in quadrant D | 2,495,684 | 533,204 |
| Mode M0 | |||
|---|---|---|---|
| Quadrant | BADHDUFLAG | Total packets | Discarded packets |
| A | 0 | 13170 | 2 |
| B | 0 | 10454 | 2 |
| C | 0 | 10850 | 2 |
| D | 0 | 11141 | 2 |
| Mode M9 | |||
|---|---|---|---|
| Quadrant | BADHDUFLAG | Total packets | Discarded packets |
| A | 0 | 26 | 0 |
| B | 0 | 27 | 0 |
| C | 0 | 27 | 0 |
| D | 0 | 27 | 0 |
| Mode SS | |||
|---|---|---|---|
| Quadrant | BADHDUFLAG | Total packets | Discarded packets |
| A | 0 | 106 | 0 |
| B | 0 | 106 | 0 |
| C | 0 | 106 | 0 |
| D | 0 | 106 | 0 |
| Quadrant | Total seconds | Saturated seconds | Saturation percentage |
|---|---|---|---|
| A | 5106 | 221 | 4.328241% |
| B | 5106 | 16 | 0.313357% |
| C | 5105 | 7 | 0.137120% |
| D | 5105 | 30 | 0.587659% |
Noise dominated data is calculated using 1-second bins in cleaned event files. If a bin has >2000 counts, and if more than 50% of those come from <1% of pixels, then it is considered to be noise-dominated and hence unusable.
| Quadrant | # 1 sec bins | Bins with >0 counts | Bins with >2000 counts | High rate bins dominated by noise | Noise dominated (total time) | Noise dominated (detector-on time) | Marked lightcurve |
|---|---|---|---|---|---|---|---|
| A | 7049 | 5107 | 145 | 145 | 2.06% | 2.84% | 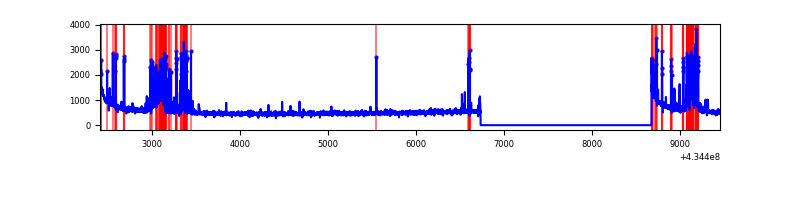 |
| B | 7049 | 5107 | 9 | 9 | 0.13% | 0.18% | 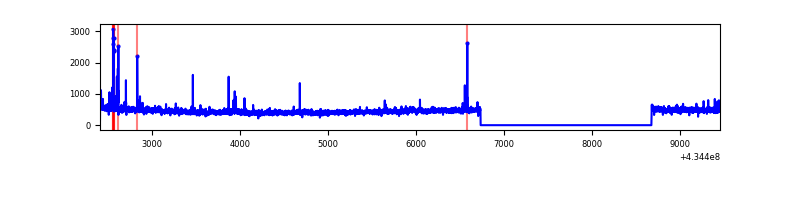 |
| C | 7048 | 5106 | 5 | 5 | 0.07% | 0.10% | 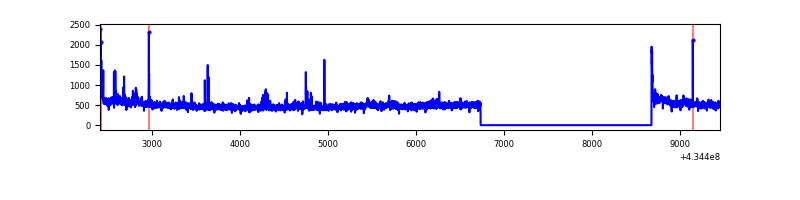 |
| D | 7048 | 5106 | 24 | 24 | 0.34% | 0.47% | 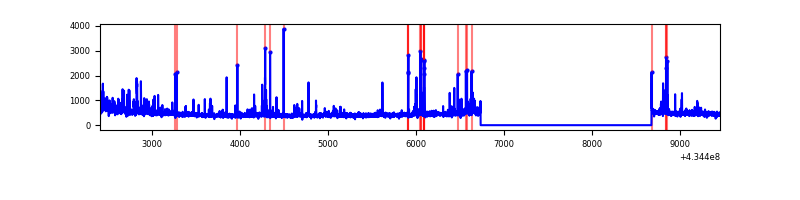 |
Top three noisy pixels from each quadrant. If the there are fewer than three noisy pixels in the level2.evt file, extra rows are filled as -1
| Pixel properties | Quadrant properties | ||||||
|---|---|---|---|---|---|---|---|
| Quadrant | DetID | PixID | Counts | Sigma | Mean | Median | Sigma |
| A | 10 | 83 | 563796 | 5043.41 | 545 | 535 | 111.7 |
| A | 15 | 237 | 400358 | 3580.0 | 545 | 535 | 111.7 |
| A | 13 | 248 | 244626 | 2185.58 | 545 | 535 | 111.7 |
| B | 0 | 189 | 40058 | 368.99 | 560 | 545 | 107.1 |
| B | 0 | 190 | 23836 | 217.5 | 560 | 545 | 107.1 |
| B | 15 | 85 | 21515 | 195.82 | 560 | 545 | 107.1 |
| C | 15 | 214 | 212821 | 1651.29 | 553 | 558 | 128.5 |
| C | 3 | 233 | 152320 | 1180.63 | 553 | 558 | 128.5 |
| C | 15 | 111 | 31571 | 241.26 | 553 | 558 | 128.5 |
| D | 1 | 52 | 212628 | 1611.81 | 545 | 531 | 131.6 |
| D | 12 | 6 | 57951 | 436.36 | 545 | 531 | 131.6 |
| D | 13 | 249 | 47223 | 354.83 | 545 | 531 | 131.6 |
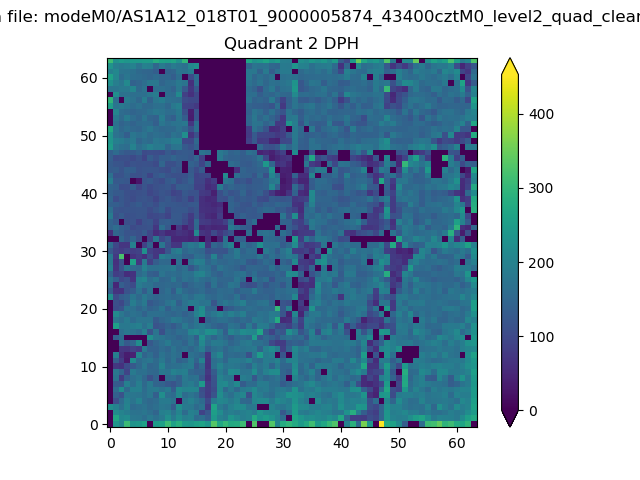
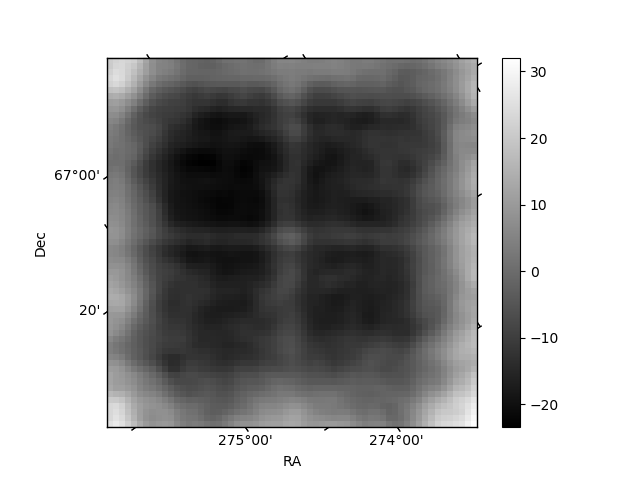
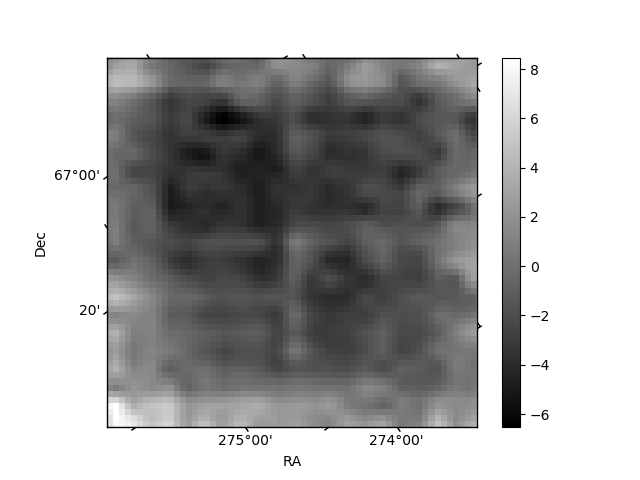
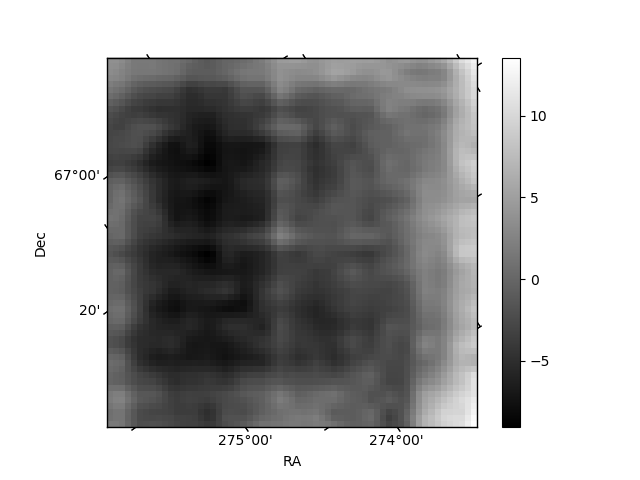
Histogram calculated using DETX and DETY for each event in the final _common_clean file
| Quadrant A | 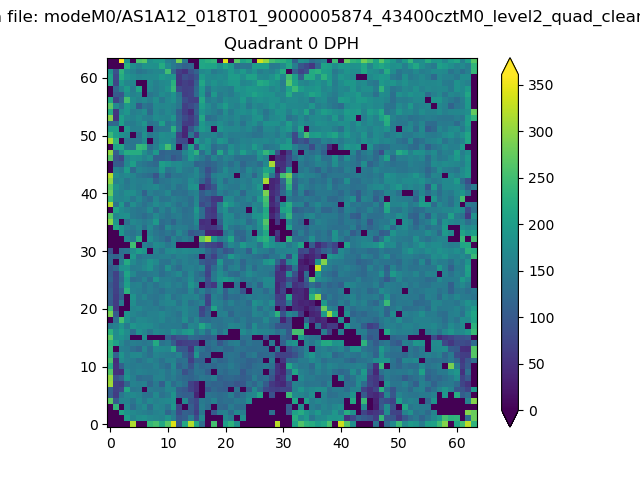 |
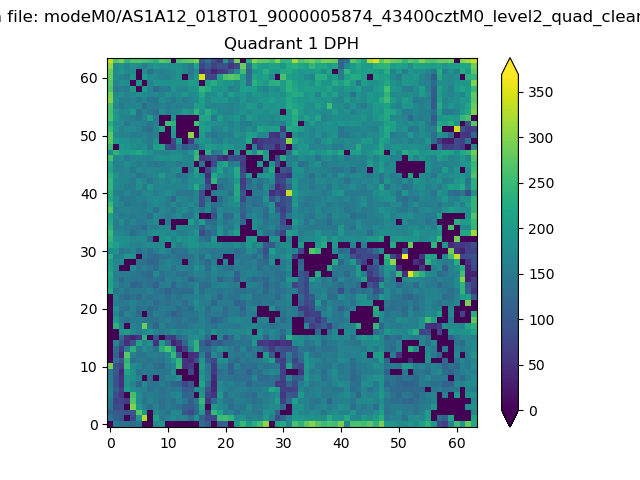 |
Quadrant B |
|---|---|---|---|
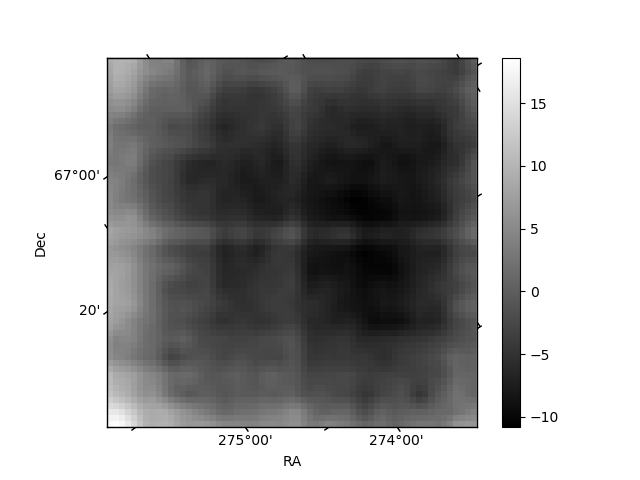
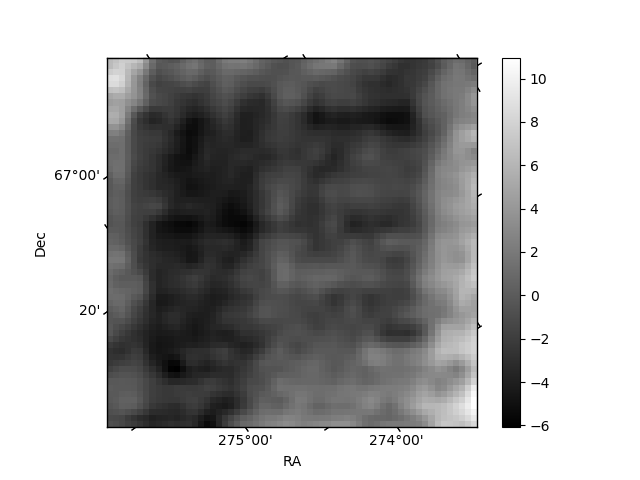
| Quadrant D | 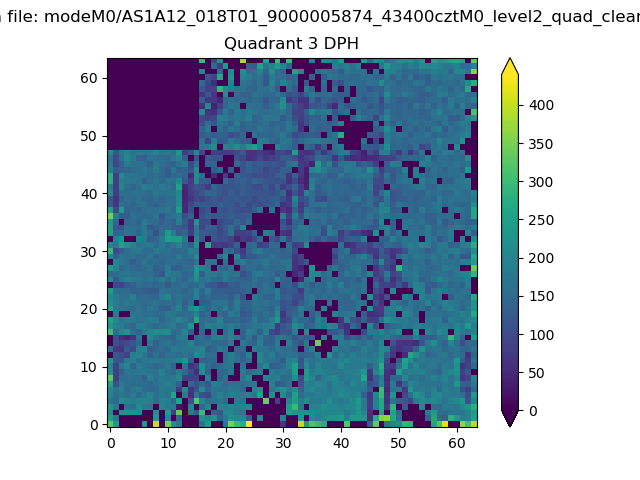 |
 |
Quadrant C |
| Plot type | Count rate plots | Images |
|---|---|---|
| Comparison with Poisson distribution Blue bars denote a histogram of data divided into 1 sec bins. Red curve is a Poisson curve with rate = median count rate of data. |
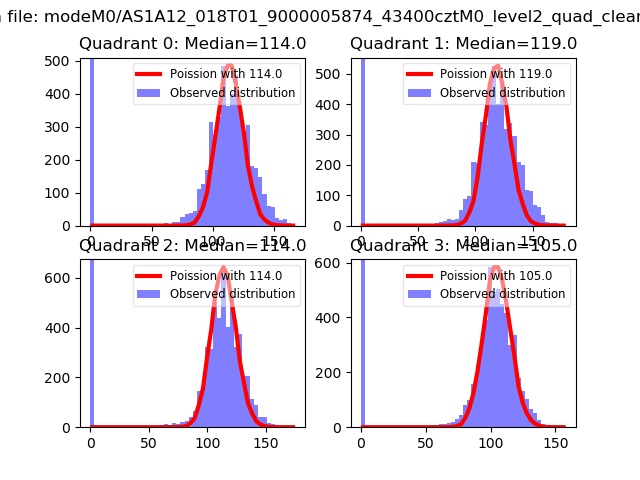 |
 |
| Quadrant-wise count rates Data is divided into 100 sec bins |
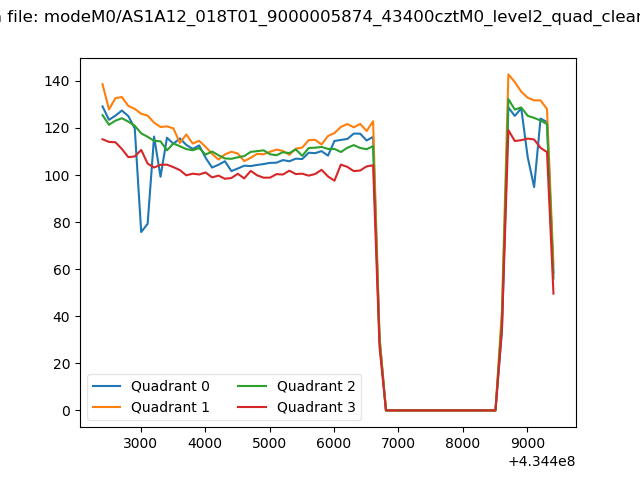 |
|
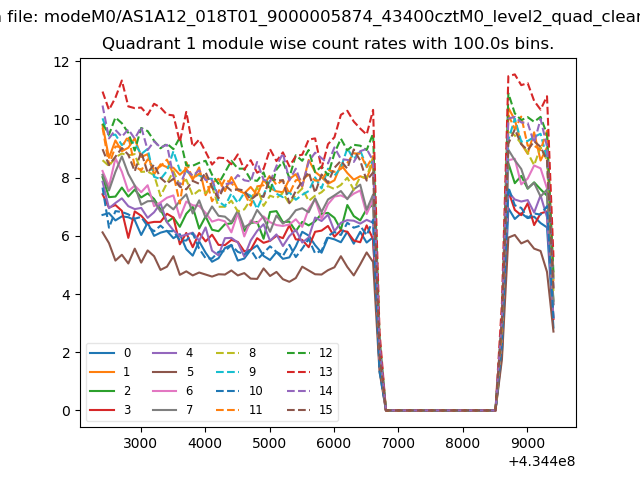
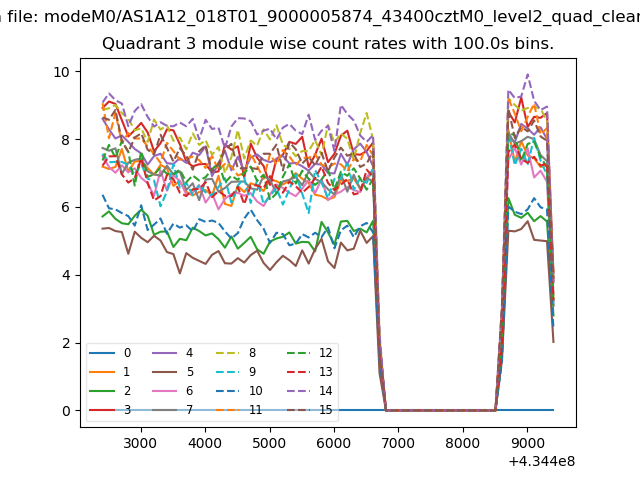
| Module-wise count rates for Quadrant A Data is divided into 100 sec bins |
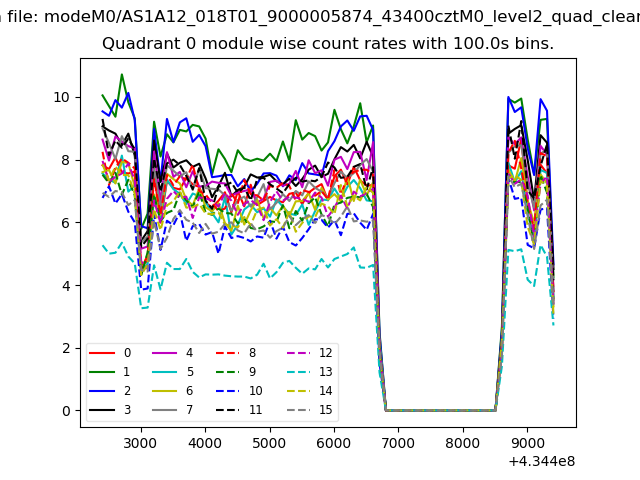 |
 |
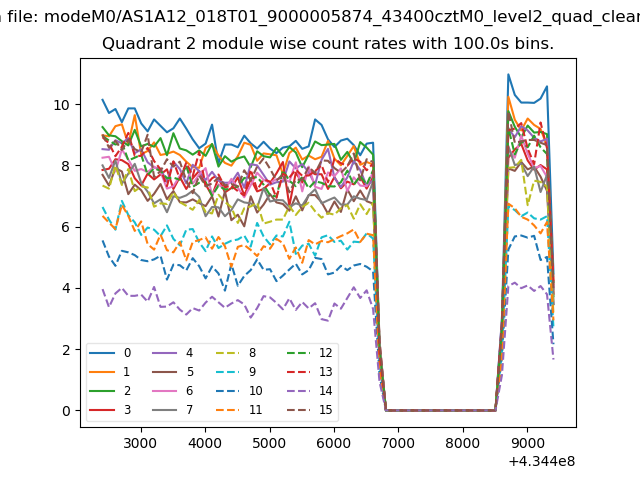
| Module-wise count rates for Quadrant B Data is divided into 100 sec bins |
 |
 |
| Module-wise count rates for Quadrant C Data is divided into 100 sec bins |
 |
 |
| Module-wise count rates for Quadrant D Data is divided into 100 sec bins |
 |
 |
| Parameter | Plot |
|---|---|
| CZT HV Monitor | 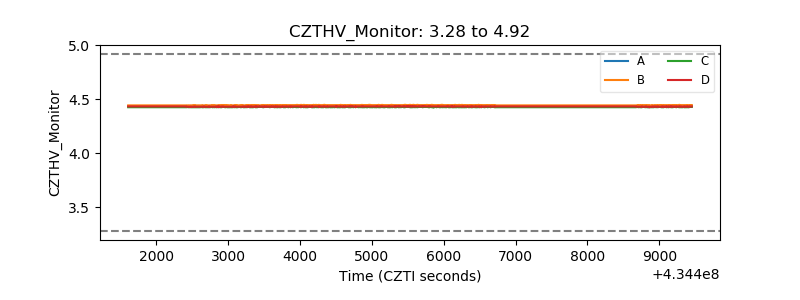 |
| D_VDD | 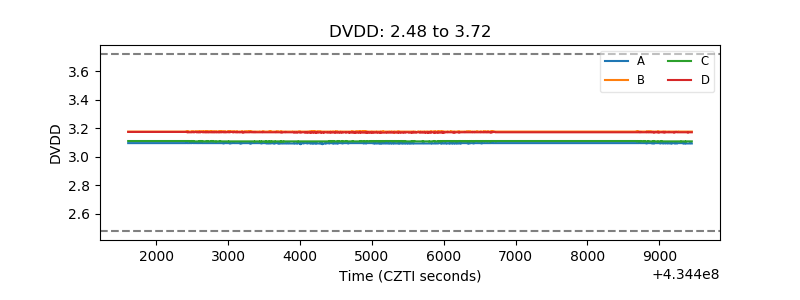 |
| Temperature 1 | 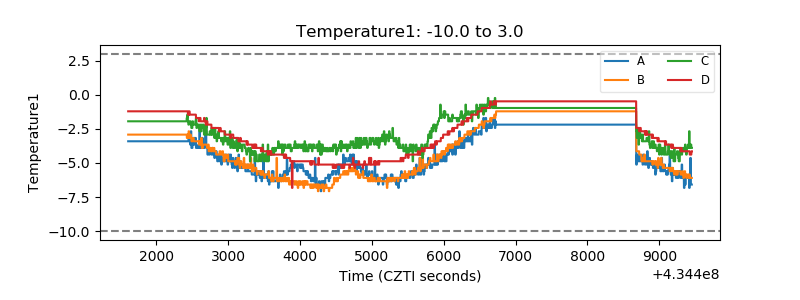 |
| Veto HV Monitor |  |
| Veto LLD | 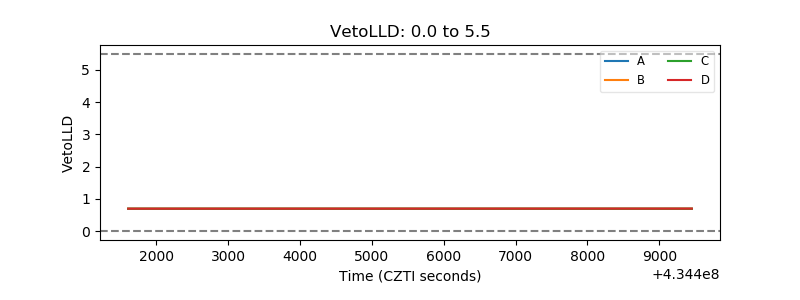 |
| Alpha Counter | 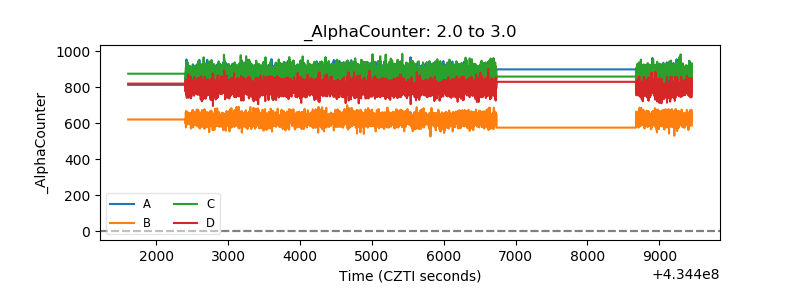 |
| _CPM_Rate | 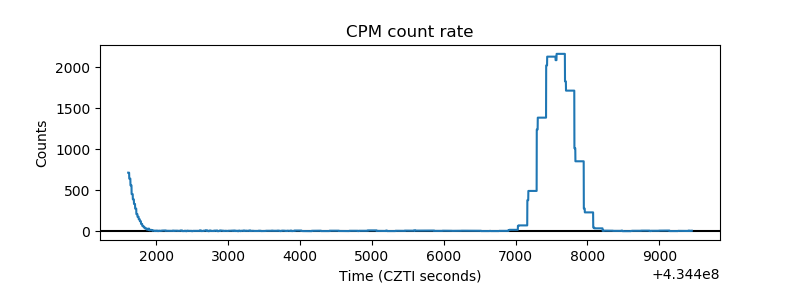 |
| CZT Counter | 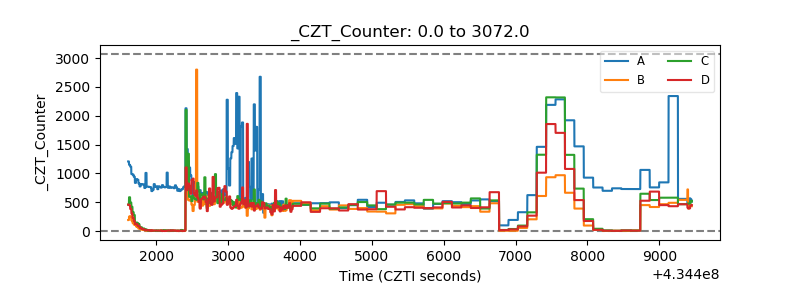 |
| +2.5 Volts monitor | 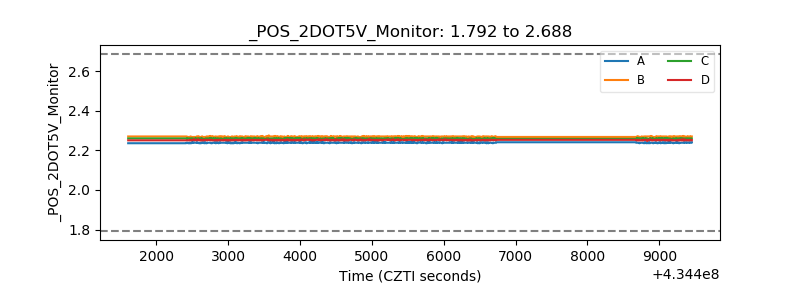 |
| +5 Volts monitor | 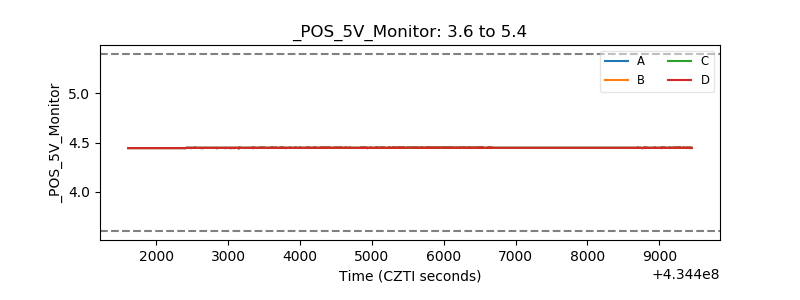 |
| _ROLL_ROT | 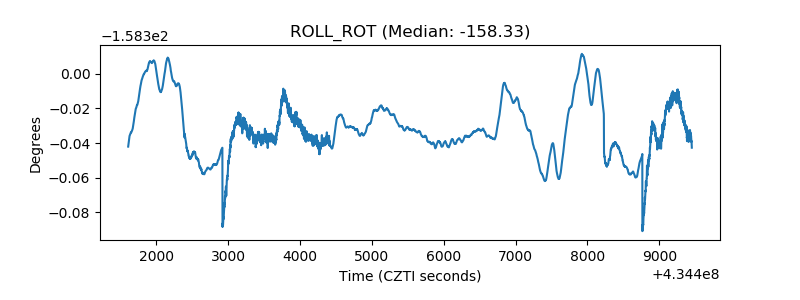 |
| _Roll_DEC | 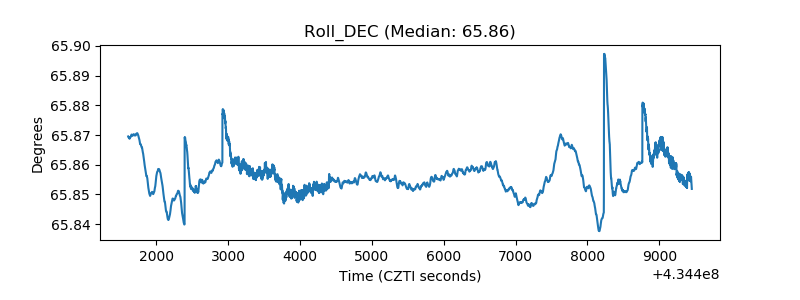 |
| _Roll_RA | 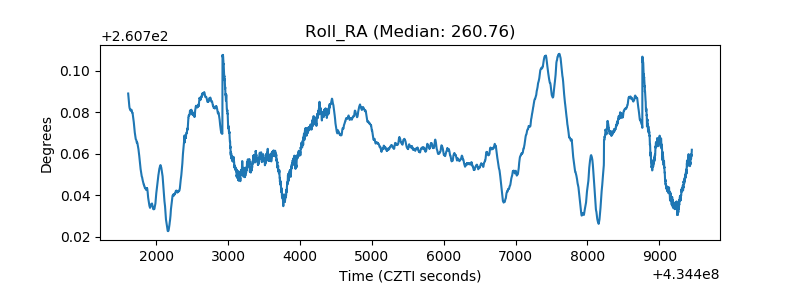 |
| Veto Counter | 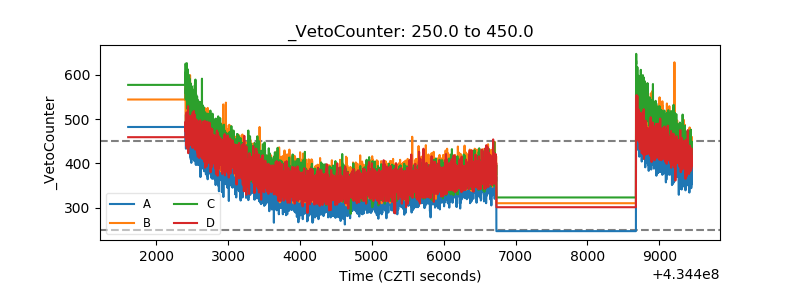 |