| Param | Original file | Final file |
|---|---|---|
| Filename | modeM0/AS1A12_018T01_9000005874_43402cztM0_level2.fits | modeM0/AS1A12_018T01_9000005874_43402cztM0_level2_quad_clean.evt |
| Size (bytes) | 298,368,000 | 89,003,520 |
| Size | 284.5 MB | 84.9 MB |
| Events in quadrant A | 2,876,927 | 592,740 |
| Events in quadrant B | 2,425,658 | 619,906 |
| Events in quadrant C | 2,610,972 | 590,481 |
| Events in quadrant D | 2,729,223 | 530,951 |
| Mode M0 | |||
|---|---|---|---|
| Quadrant | BADHDUFLAG | Total packets | Discarded packets |
| A | 0 | 11698 | 2 |
| B | 0 | 10735 | 2 |
| C | 0 | 10910 | 2 |
| D | 0 | 11885 | 2 |
| Mode M9 | |||
|---|---|---|---|
| Quadrant | BADHDUFLAG | Total packets | Discarded packets |
| A | 0 | 31 | 0 |
| B | 0 | 32 | 0 |
| C | 0 | 32 | 0 |
| D | 0 | 32 | 0 |
| Mode SS | |||
|---|---|---|---|
| Quadrant | BADHDUFLAG | Total packets | Discarded packets |
| A | 0 | 106 | 0 |
| B | 0 | 106 | 0 |
| C | 0 | 106 | 0 |
| D | 0 | 106 | 0 |
| Quadrant | Total seconds | Saturated seconds | Saturation percentage |
|---|---|---|---|
| A | 5152 | 52 | 1.009317% |
| B | 5152 | 20 | 0.388199% |
| C | 5152 | 16 | 0.310559% |
| D | 5152 | 101 | 1.960404% |
Noise dominated data is calculated using 1-second bins in cleaned event files. If a bin has >2000 counts, and if more than 50% of those come from <1% of pixels, then it is considered to be noise-dominated and hence unusable.
| Quadrant | # 1 sec bins | Bins with >0 counts | Bins with >2000 counts | High rate bins dominated by noise | Noise dominated (total time) | Noise dominated (detector-on time) | Marked lightcurve |
|---|---|---|---|---|---|---|---|
| A | 7274 | 5153 | 46 | 46 | 0.63% | 0.89% | 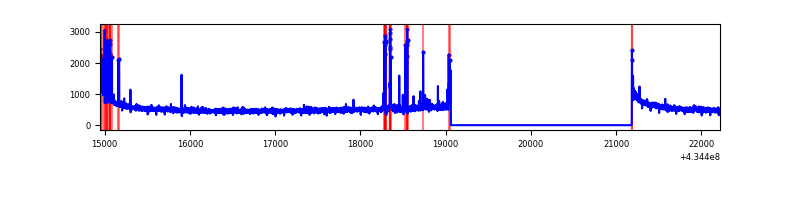 |
| B | 7274 | 5153 | 13 | 13 | 0.18% | 0.25% |  |
| C | 7274 | 5153 | 12 | 12 | 0.16% | 0.23% |  |
| D | 7274 | 5153 | 90 | 90 | 1.24% | 1.75% |  |
Top three noisy pixels from each quadrant. If the there are fewer than three noisy pixels in the level2.evt file, extra rows are filled as -1
| Pixel properties | Quadrant properties | ||||||
|---|---|---|---|---|---|---|---|
| Quadrant | DetID | PixID | Counts | Sigma | Mean | Median | Sigma |
| A | 10 | 83 | 556110 | 4950.8 | 555 | 545 | 112.2 |
| A | 15 | 237 | 146381 | 1299.59 | 555 | 545 | 112.2 |
| A | 13 | 248 | 16048 | 138.15 | 555 | 545 | 112.2 |
| B | 0 | 189 | 98668 | 916.14 | 562 | 547 | 107.1 |
| B | 0 | 245 | 62346 | 577.01 | 562 | 547 | 107.1 |
| B | 5 | 255 | 47666 | 439.94 | 562 | 547 | 107.1 |
| C | 15 | 214 | 212503 | 1667.45 | 549 | 552 | 127.1 |
| C | 3 | 233 | 155683 | 1220.44 | 549 | 552 | 127.1 |
| C | 15 | 159 | 84668 | 661.75 | 549 | 552 | 127.1 |
| D | 13 | 249 | 264247 | 1983.97 | 539 | 523 | 132.9 |
| D | 1 | 52 | 119202 | 892.81 | 539 | 523 | 132.9 |
| D | 12 | 6 | 93727 | 701.16 | 539 | 523 | 132.9 |
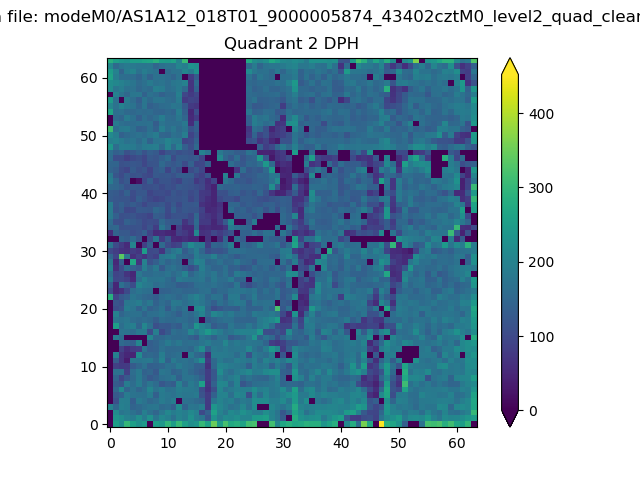
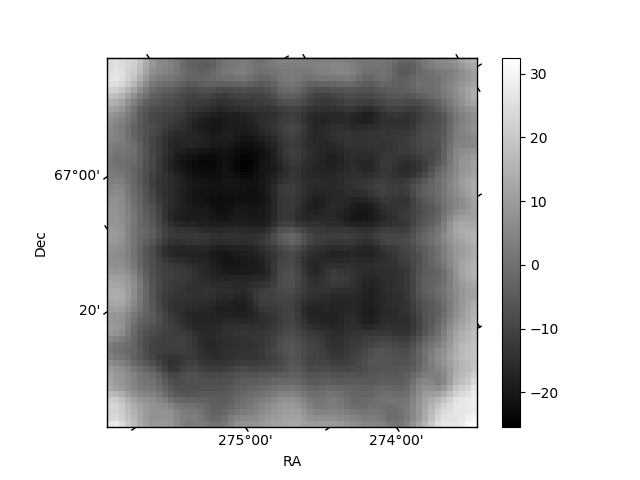
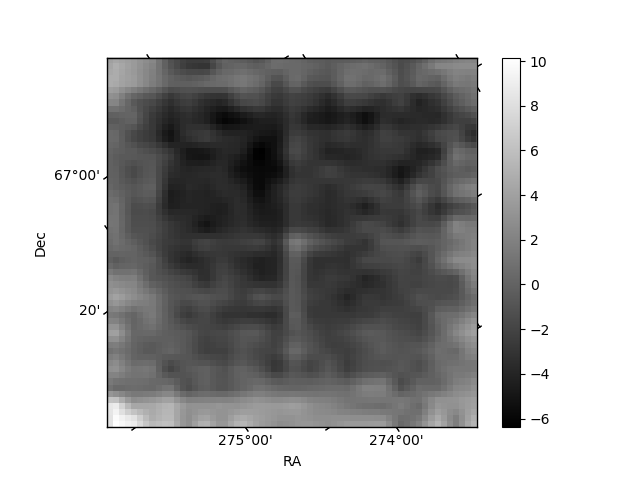
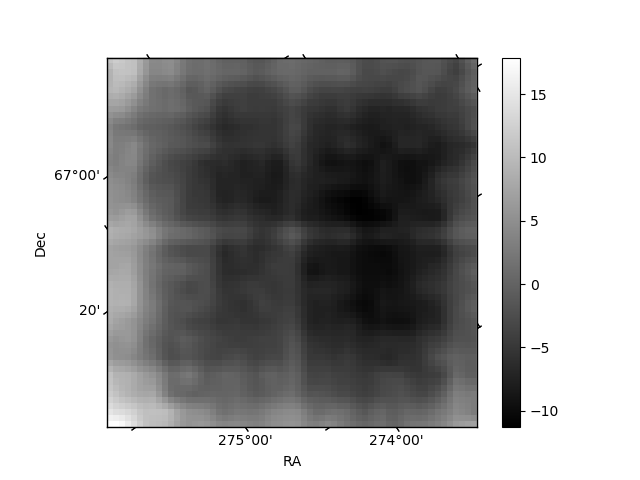
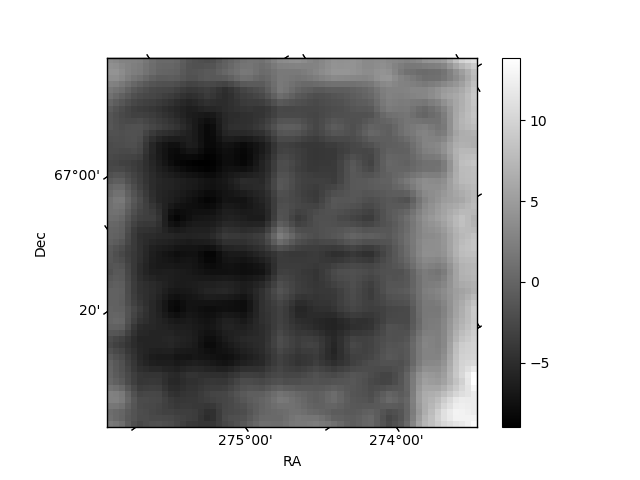
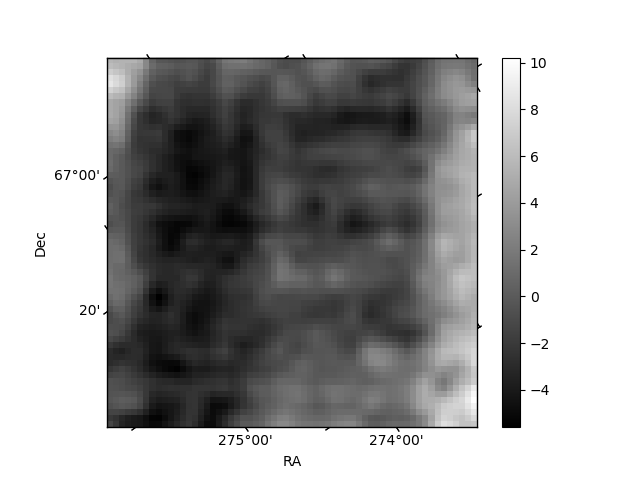
Histogram calculated using DETX and DETY for each event in the final _common_clean file
| Quadrant A | 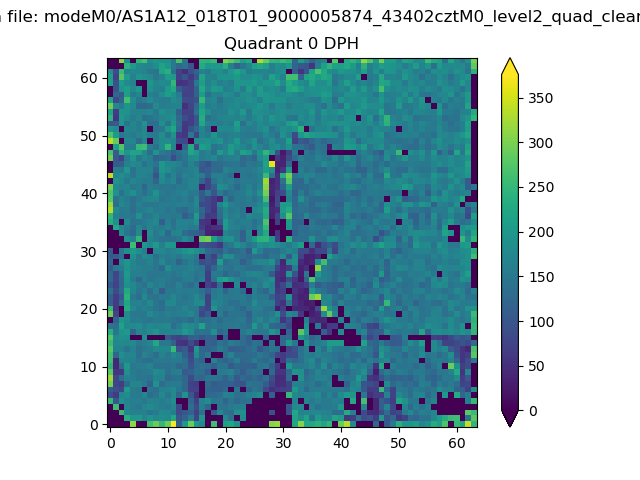 |
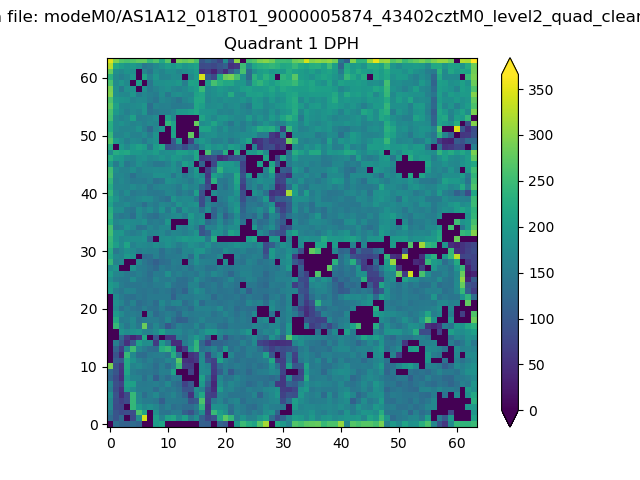 |
Quadrant B |
|---|---|---|---|
| Quadrant D | 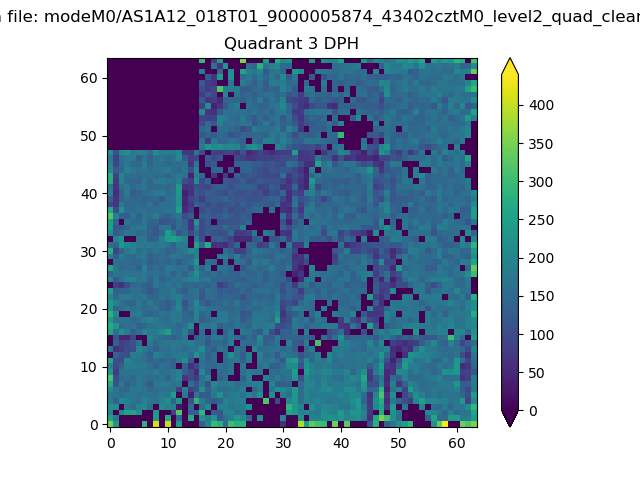 |
 |
Quadrant C |
| Plot type | Count rate plots | Images |
|---|---|---|
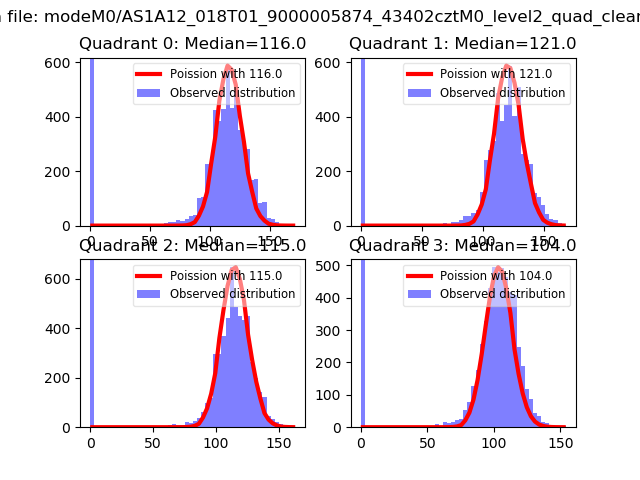
| Comparison with Poisson distribution Blue bars denote a histogram of data divided into 1 sec bins. Red curve is a Poisson curve with rate = median count rate of data. |
 |
 |
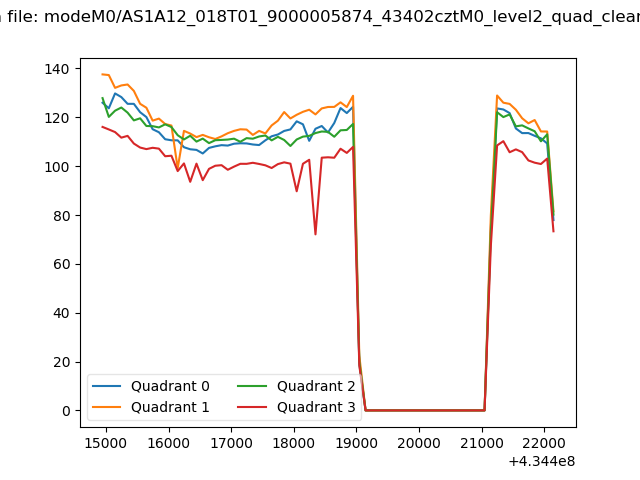
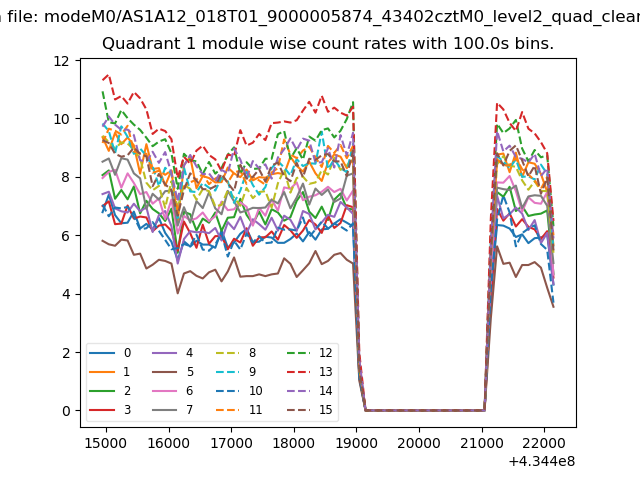
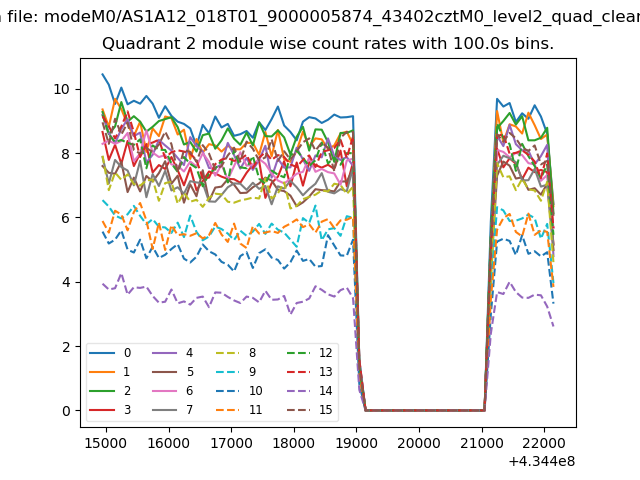
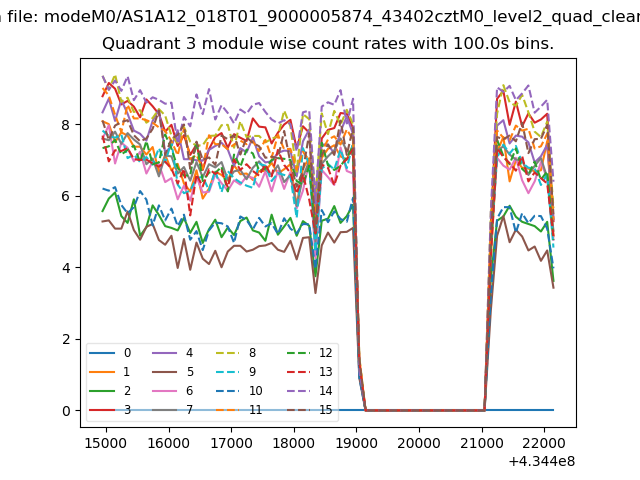
| Quadrant-wise count rates Data is divided into 100 sec bins |
 |
|
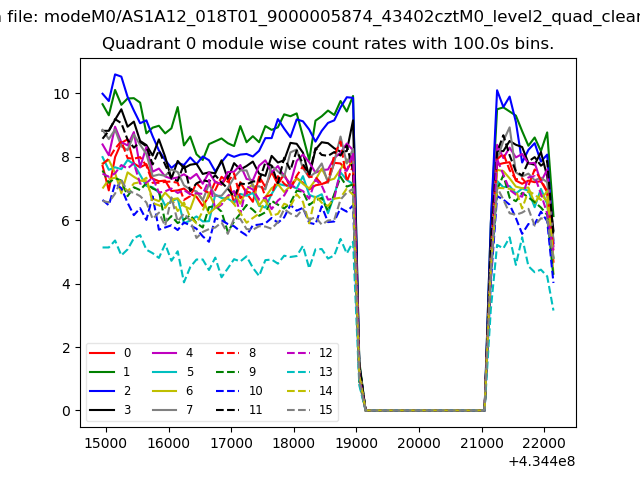
| Module-wise count rates for Quadrant A Data is divided into 100 sec bins |
 |
 |
| Module-wise count rates for Quadrant B Data is divided into 100 sec bins |
 |
 |
| Module-wise count rates for Quadrant C Data is divided into 100 sec bins |
 |
 |
| Module-wise count rates for Quadrant D Data is divided into 100 sec bins |
 |
 |
| Parameter | Plot |
|---|---|
| CZT HV Monitor | 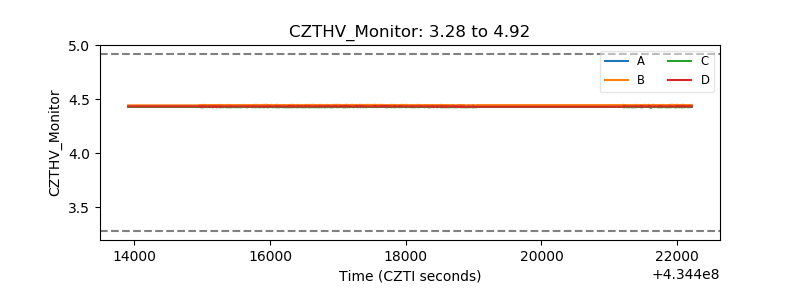 |
| D_VDD | 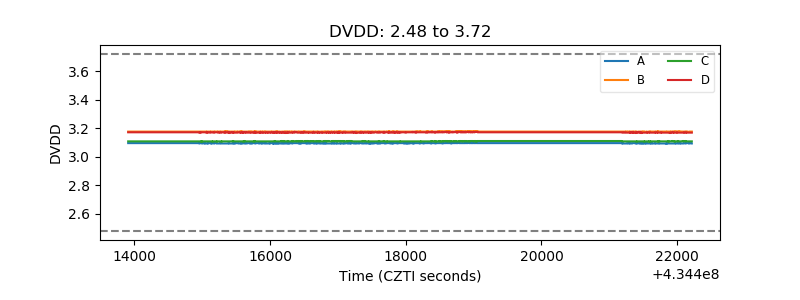 |
| Temperature 1 |  |
| Veto HV Monitor | 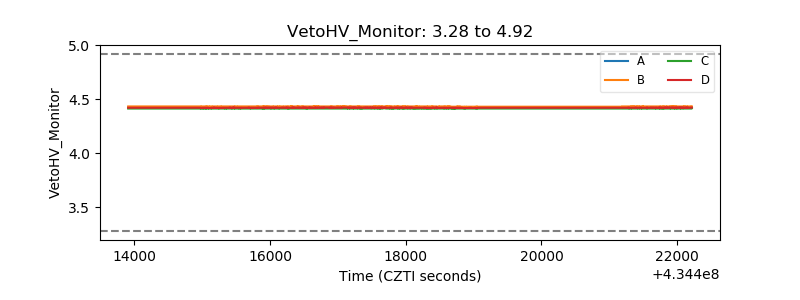 |
| Veto LLD | 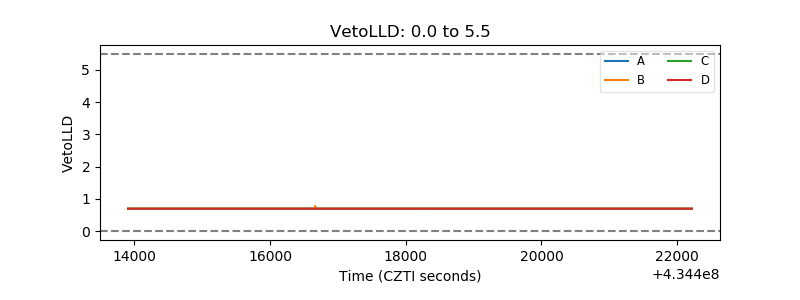 |
| Alpha Counter | 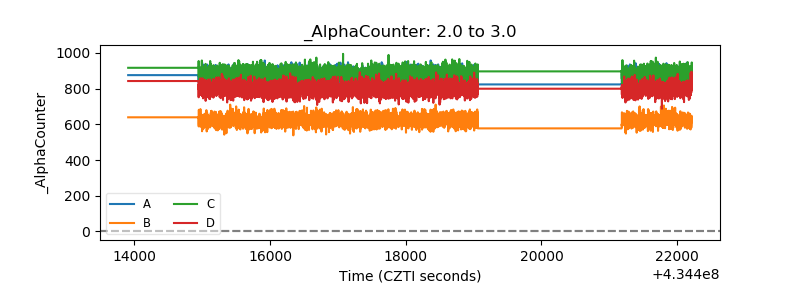 |
| _CPM_Rate | 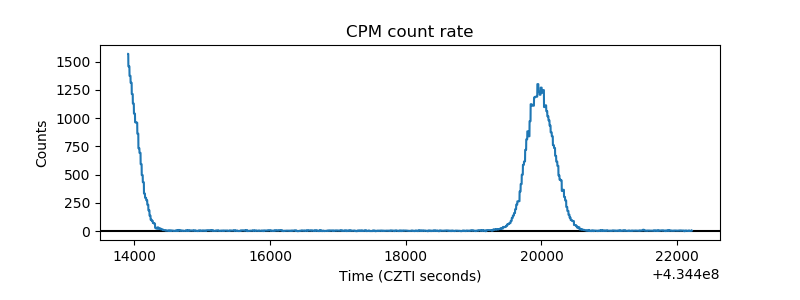 |
| CZT Counter | 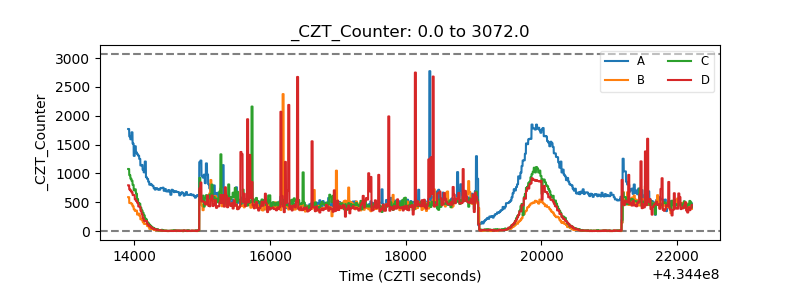 |
| +2.5 Volts monitor | 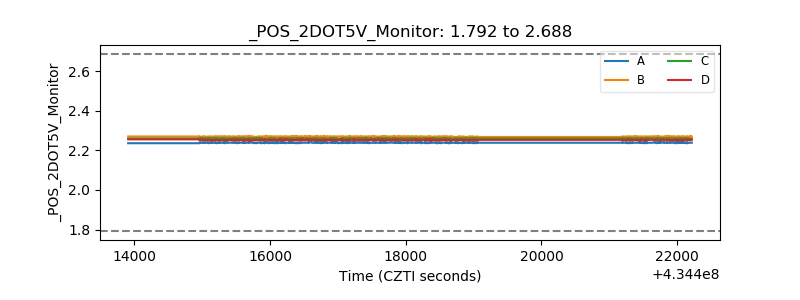 |
| +5 Volts monitor | 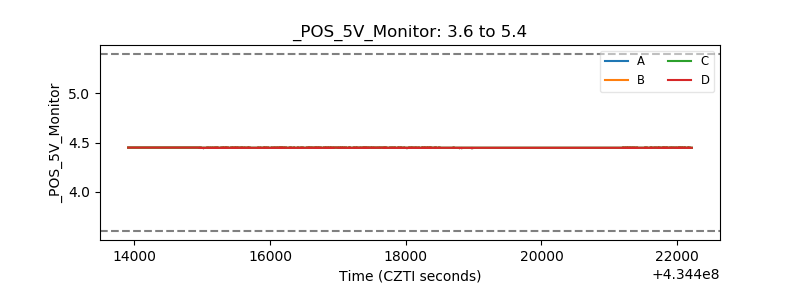 |
| _ROLL_ROT | 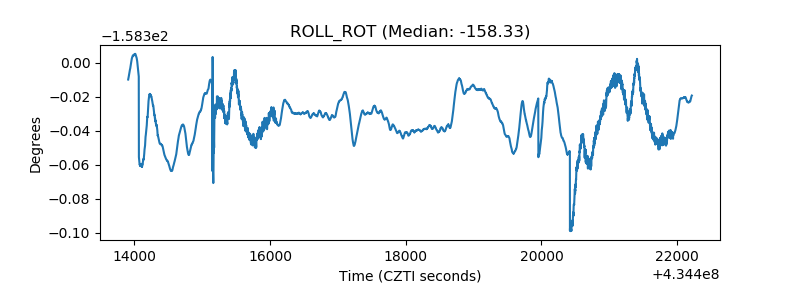 |
| _Roll_DEC | 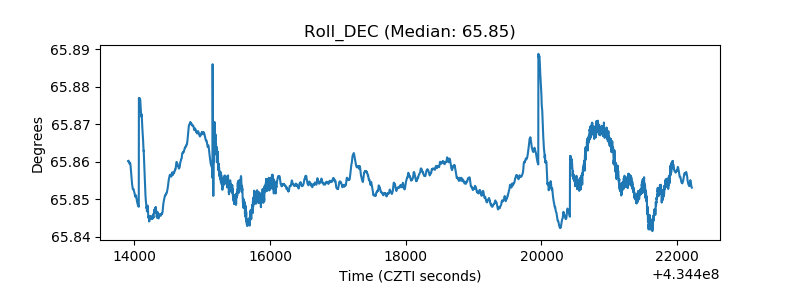 |
| _Roll_RA | 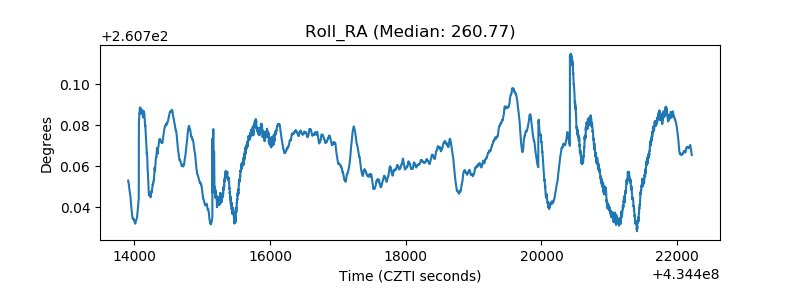 |
| Veto Counter | 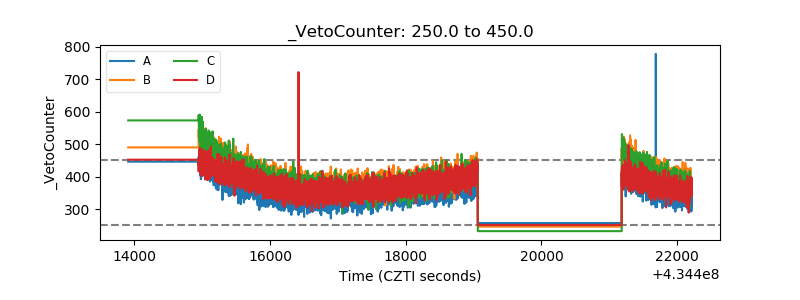 |