| Param | Original file | Final file |
|---|---|---|
| Filename | modeM0/AS1A12_018T01_9000005874_43404cztM0_level2.fits | modeM0/AS1A12_018T01_9000005874_43404cztM0_level2_quad_clean.evt |
| Size (bytes) | 334,048,320 | 83,574,720 |
| Size | 318.6 MB | 79.7 MB |
| Events in quadrant A | 3,453,090 | 548,366 |
| Events in quadrant B | 2,575,189 | 580,057 |
| Events in quadrant C | 2,531,174 | 549,930 |
| Events in quadrant D | 3,402,741 | 489,398 |
| Mode M0 | |||
|---|---|---|---|
| Quadrant | BADHDUFLAG | Total packets | Discarded packets |
| A | 0 | 13540 | 2 |
| B | 0 | 11247 | 2 |
| C | 0 | 10921 | 2 |
| D | 0 | 13935 | 2 |
| Mode M9 | |||
|---|---|---|---|
| Quadrant | BADHDUFLAG | Total packets | Discarded packets |
| A | 0 | 29 | 0 |
| B | 0 | 30 | 0 |
| C | 0 | 30 | 0 |
| D | 0 | 30 | 0 |
| Mode SS | |||
|---|---|---|---|
| Quadrant | BADHDUFLAG | Total packets | Discarded packets |
| A | 0 | 106 | 0 |
| B | 0 | 106 | 0 |
| C | 0 | 106 | 0 |
| D | 0 | 106 | 0 |
| Quadrant | Total seconds | Saturated seconds | Saturation percentage |
|---|---|---|---|
| A | 5176 | 159 | 3.071870% |
| B | 5176 | 21 | 0.405719% |
| C | 5176 | 6 | 0.115920% |
| D | 5176 | 264 | 5.100464% |
Noise dominated data is calculated using 1-second bins in cleaned event files. If a bin has >2000 counts, and if more than 50% of those come from <1% of pixels, then it is considered to be noise-dominated and hence unusable.
| Quadrant | # 1 sec bins | Bins with >0 counts | Bins with >2000 counts | High rate bins dominated by noise | Noise dominated (total time) | Noise dominated (detector-on time) | Marked lightcurve |
|---|---|---|---|---|---|---|---|
| A | 7178 | 5177 | 117 | 117 | 1.63% | 2.26% | 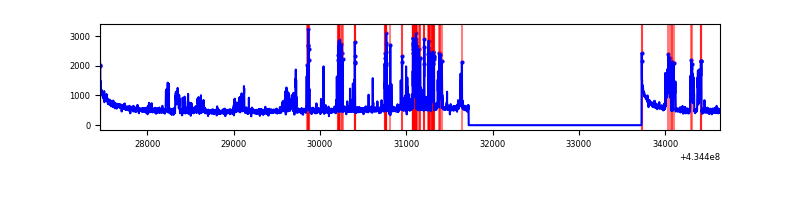 |
| B | 7178 | 5177 | 8 | 8 | 0.11% | 0.15% | 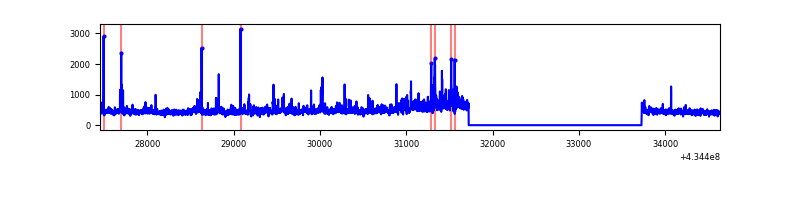 |
| C | 7178 | 5177 | 6 | 6 | 0.08% | 0.12% | 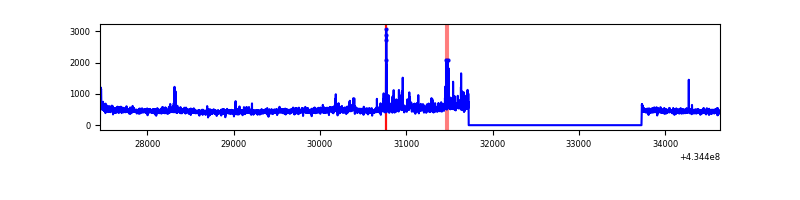 |
| D | 7178 | 5177 | 234 | 234 | 3.26% | 4.52% | 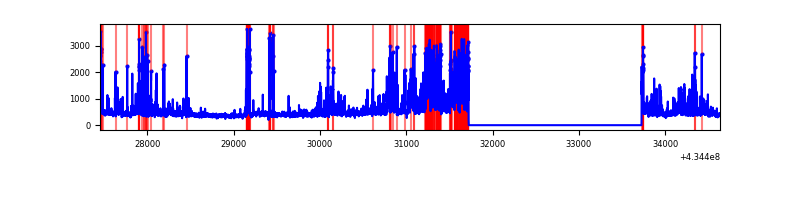 |
Top three noisy pixels from each quadrant. If the there are fewer than three noisy pixels in the level2.evt file, extra rows are filled as -1
| Pixel properties | Quadrant properties | ||||||
|---|---|---|---|---|---|---|---|
| Quadrant | DetID | PixID | Counts | Sigma | Mean | Median | Sigma |
| A | 10 | 83 | 580917 | 5262.81 | 540 | 528 | 110.3 |
| A | 15 | 237 | 448874 | 4065.48 | 540 | 528 | 110.3 |
| A | 13 | 248 | 309036 | 2797.47 | 540 | 528 | 110.3 |
| B | 0 | 189 | 265096 | 2493.81 | 547 | 532 | 106.1 |
| B | 0 | 190 | 94096 | 881.94 | 547 | 532 | 106.1 |
| B | 0 | 186 | 23053 | 212.29 | 547 | 532 | 106.1 |
| C | 15 | 214 | 217124 | 1734.66 | 532 | 535 | 124.9 |
| C | 3 | 233 | 154180 | 1230.54 | 532 | 535 | 124.9 |
| C | 15 | 159 | 81584 | 649.12 | 532 | 535 | 124.9 |
| D | 1 | 52 | 968102 | 7524.57 | 522 | 505 | 128.6 |
| D | 12 | 6 | 182973 | 1418.97 | 522 | 505 | 128.6 |
| D | 13 | 249 | 137474 | 1065.15 | 522 | 505 | 128.6 |
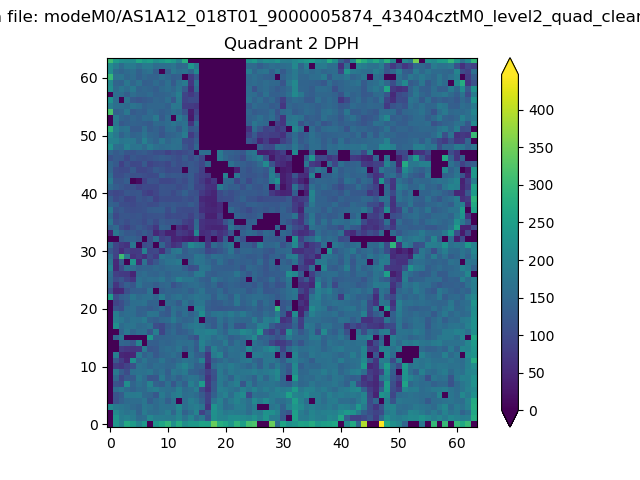
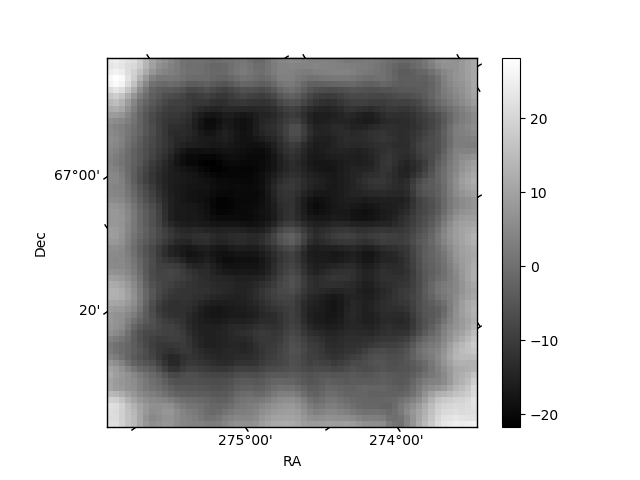
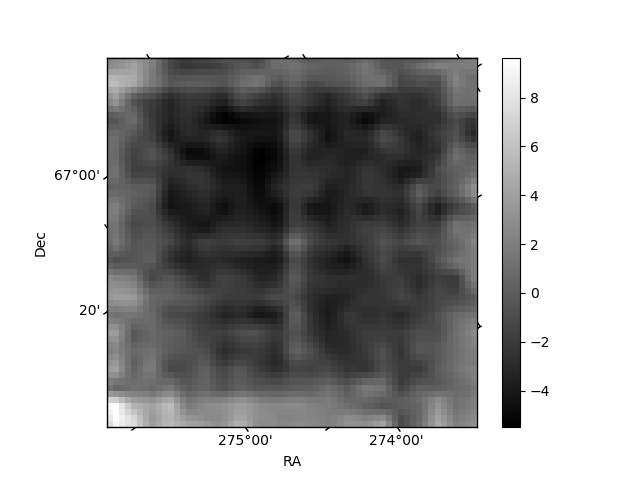
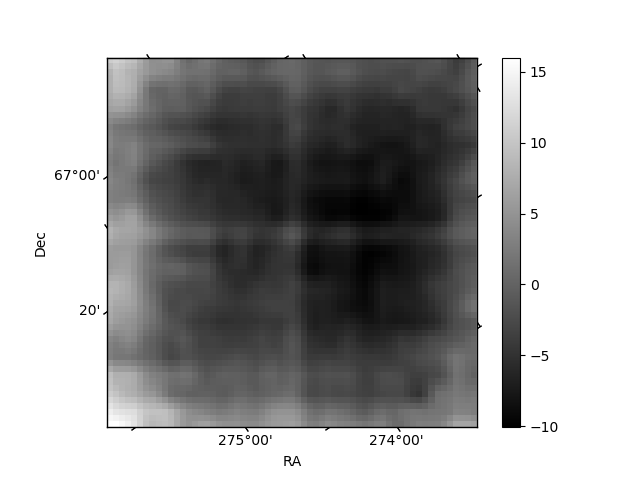
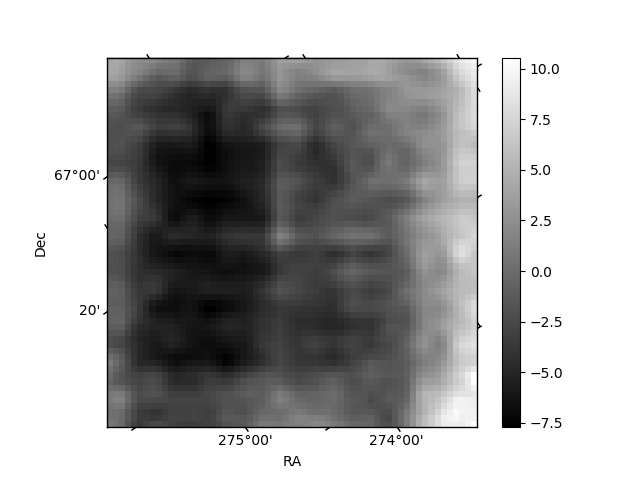
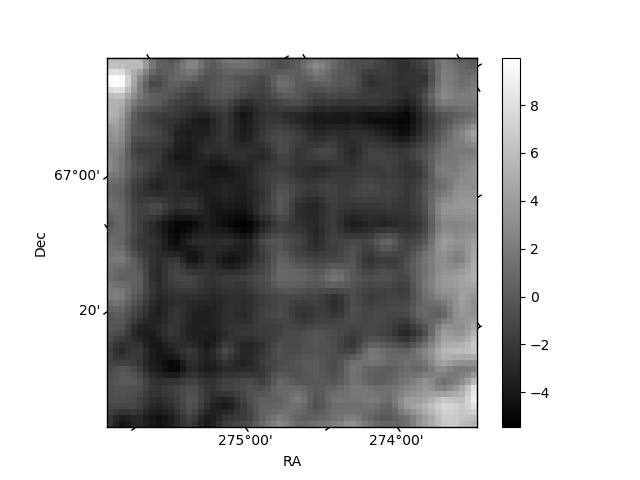
Histogram calculated using DETX and DETY for each event in the final _common_clean file
| Quadrant A | 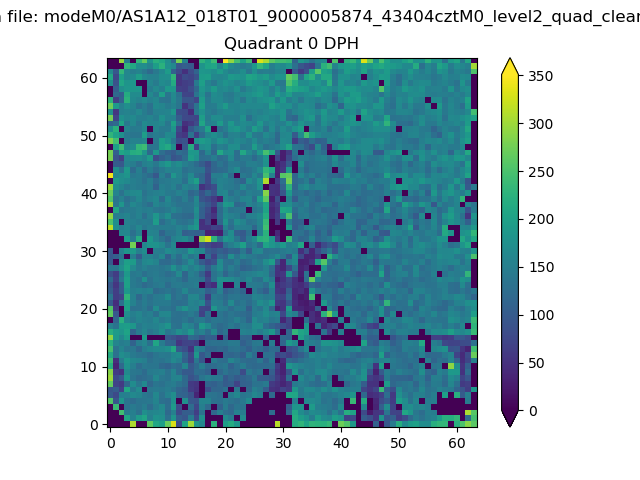 |
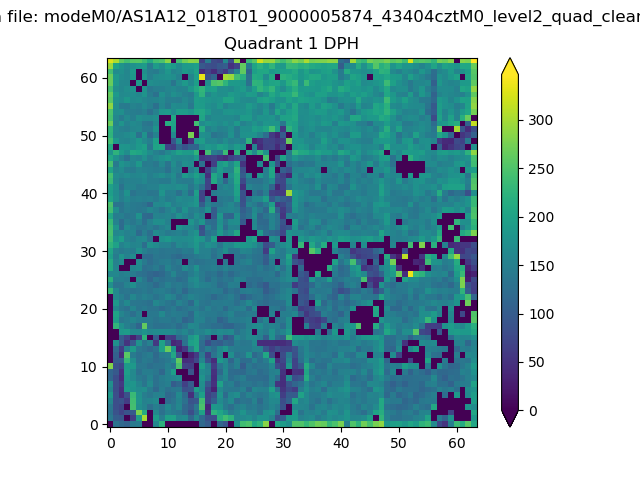 |
Quadrant B |
|---|---|---|---|
| Quadrant D | 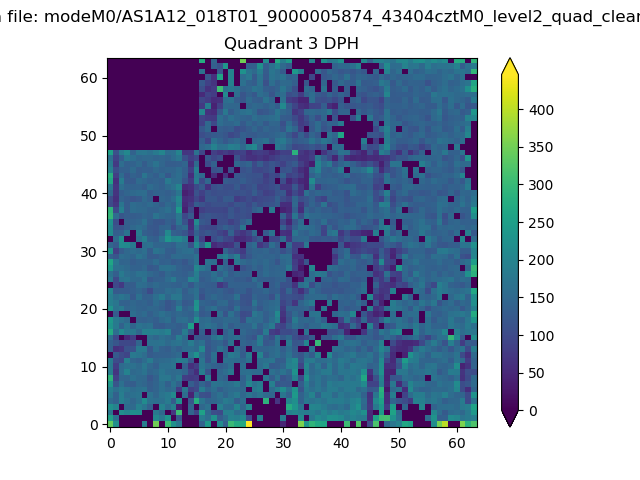 |
 |
Quadrant C |
| Plot type | Count rate plots | Images |
|---|---|---|
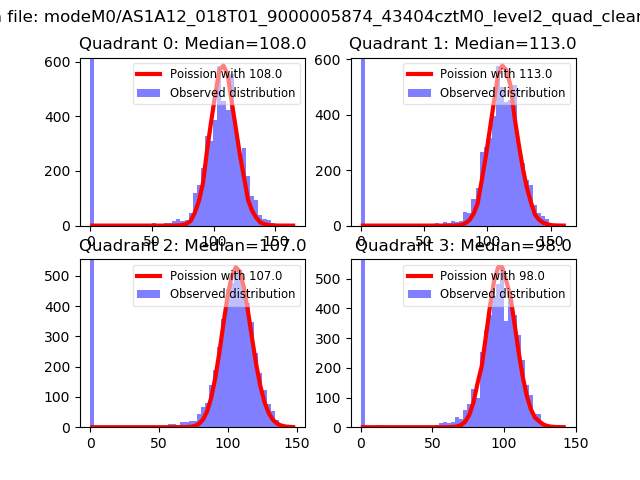
| Comparison with Poisson distribution Blue bars denote a histogram of data divided into 1 sec bins. Red curve is a Poisson curve with rate = median count rate of data. |
 |
 |
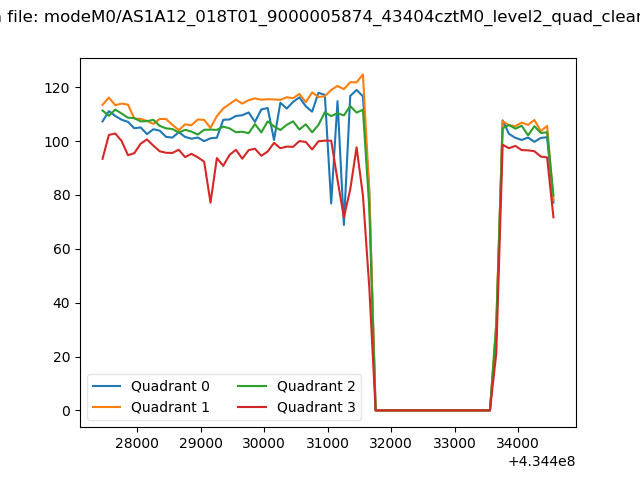
| Quadrant-wise count rates Data is divided into 100 sec bins |
 |
|
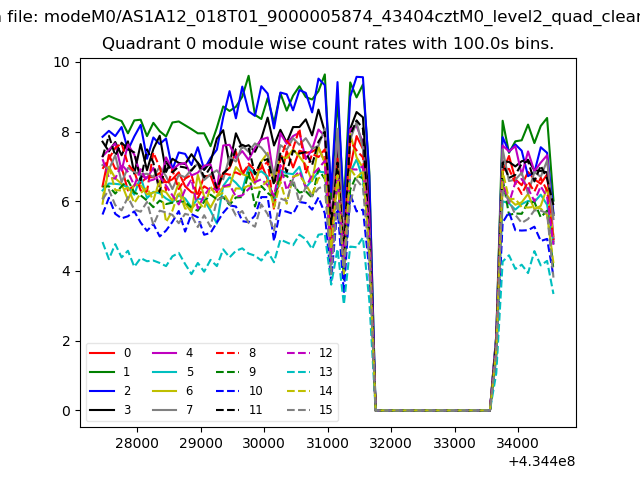
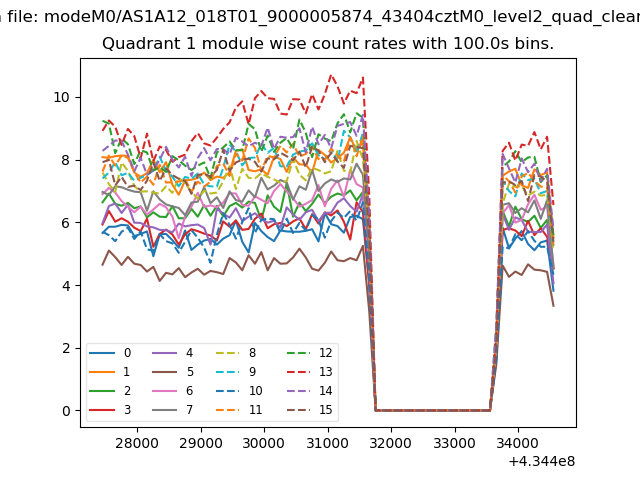
| Module-wise count rates for Quadrant A Data is divided into 100 sec bins |
 |
 |
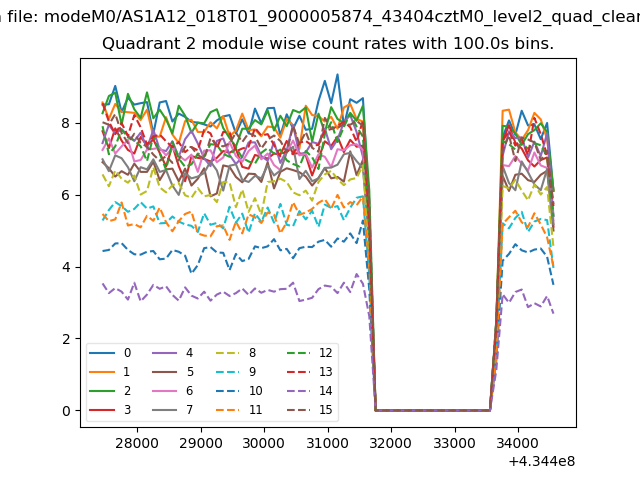
| Module-wise count rates for Quadrant B Data is divided into 100 sec bins |
 |
 |
| Module-wise count rates for Quadrant C Data is divided into 100 sec bins |
 |
 |
| Module-wise count rates for Quadrant D Data is divided into 100 sec bins |
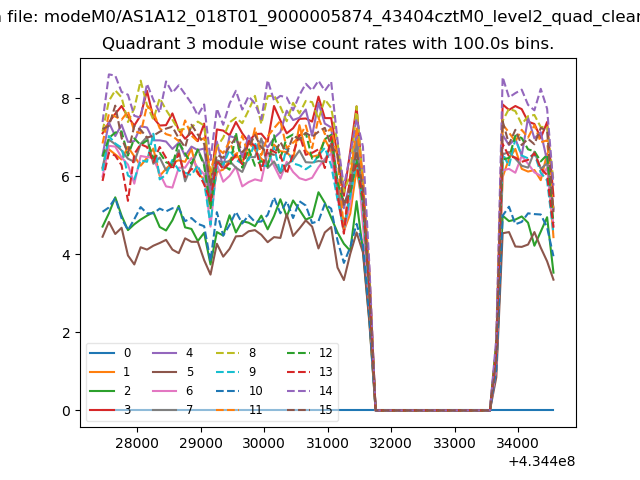 |
 |
| Parameter | Plot |
|---|---|
| CZT HV Monitor | 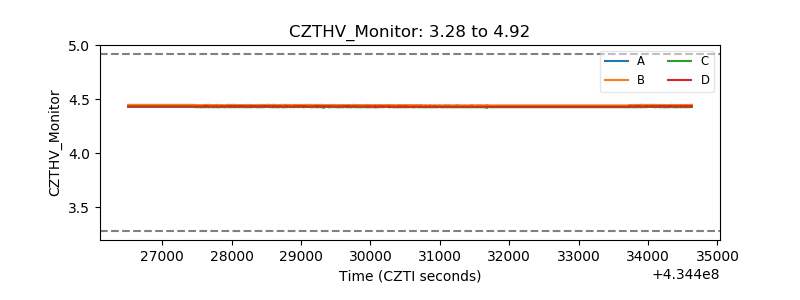 |
| D_VDD | 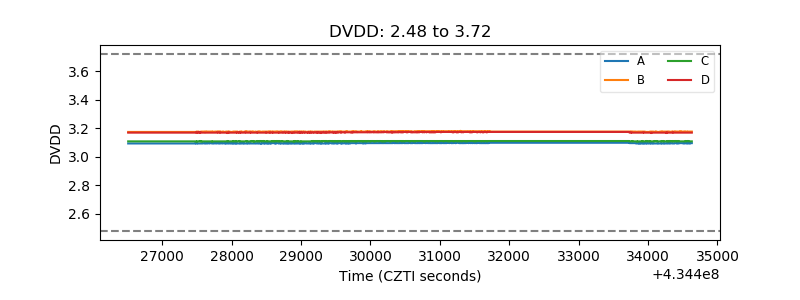 |
| Temperature 1 | 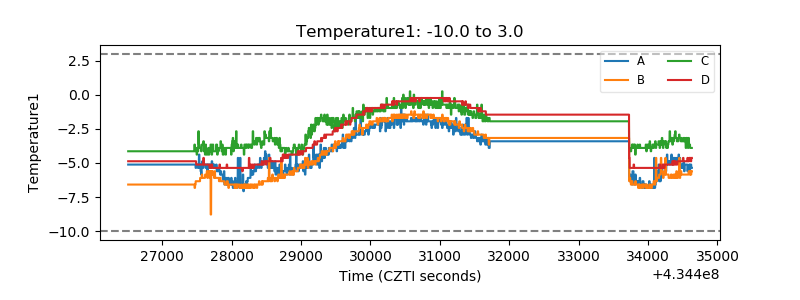 |
| Veto HV Monitor | 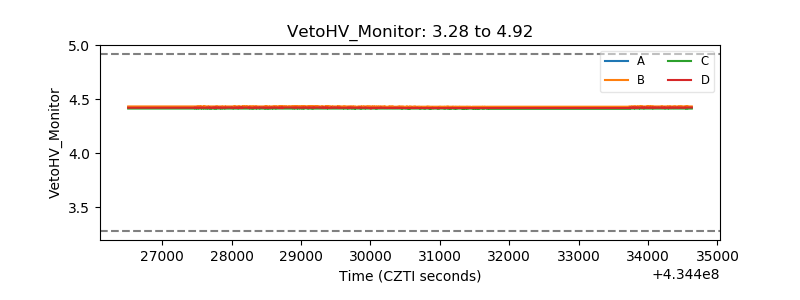 |
| Veto LLD | 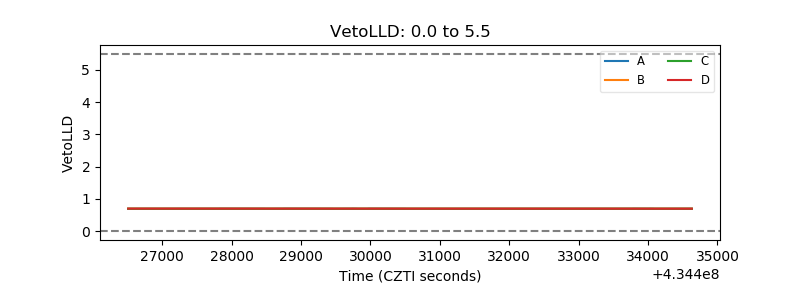 |
| Alpha Counter | 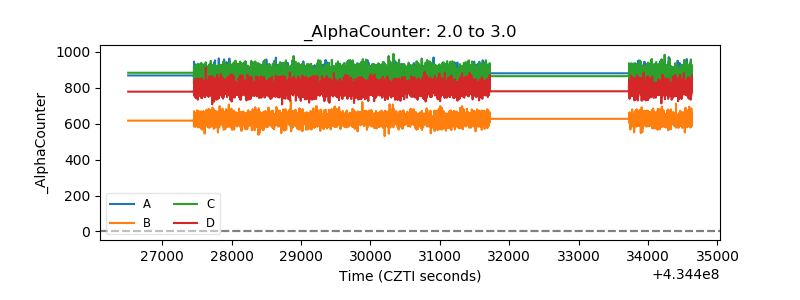 |
| _CPM_Rate | 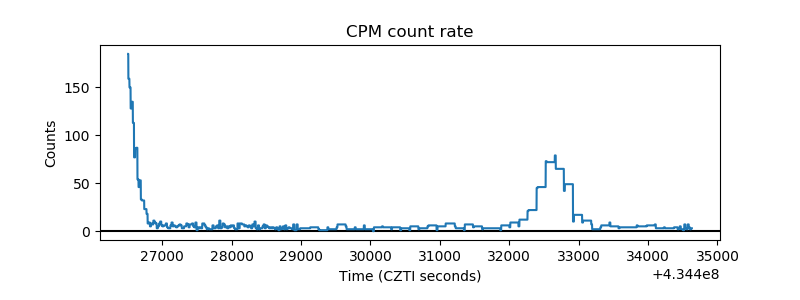 |
| CZT Counter | 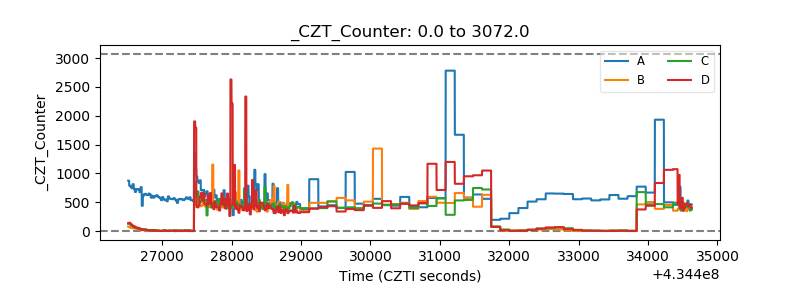 |
| +2.5 Volts monitor |  |
| +5 Volts monitor | 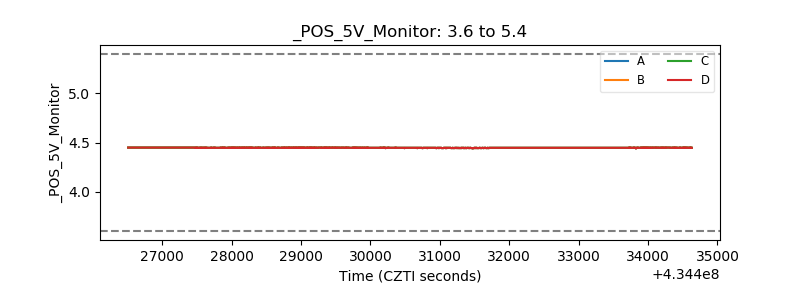 |
| _ROLL_ROT | 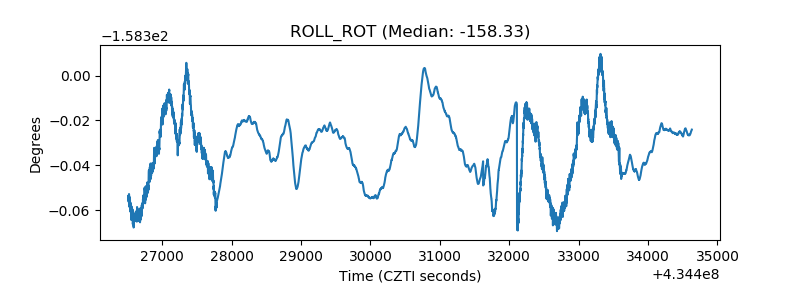 |
| _Roll_DEC | 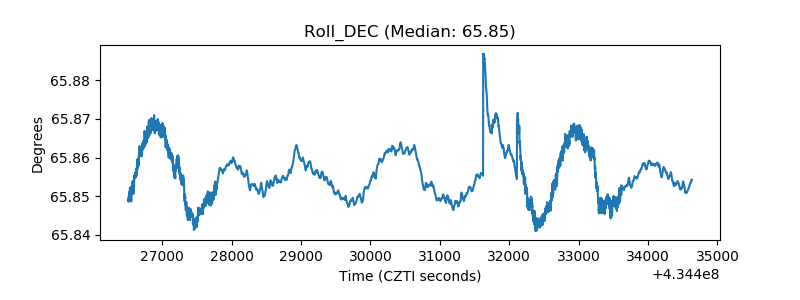 |
| _Roll_RA | 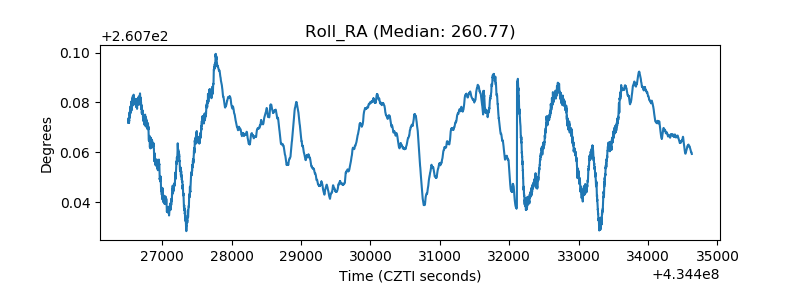 |
| Veto Counter | 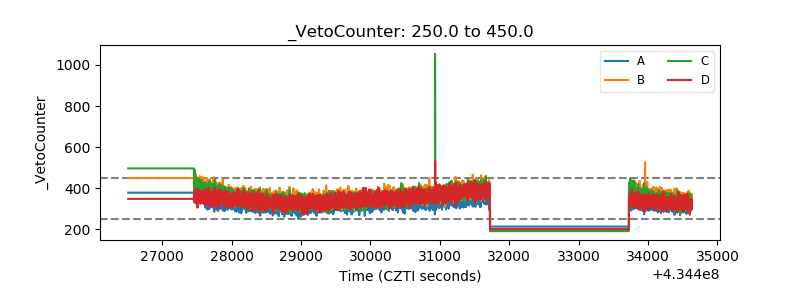 |